PRODUCTION BY LINTNERIZATION-AUTOCLAVING AND PHYSICOCHEMICAL
CHARACTERIZATION OF RESISTANT STARCH III
FROM SAGO PALM (
Metroxylon sagu
Rottb)
Wiwit Sri Werdi Pratiwi
1,2,*, Anil Kumar Anal
2, and Surya Rosa Putra
1 1Department of Chemistry, Sepuluh Nopember Institute of Technology (ITS) Jl. Arief Rahman Hakim,Sukolilo, Surabaya 60111, Indonesia 2
Food Engineering and Bioproccess Technology, Asian Institute of Technology Klong Luang, Pathumthani 12120, Thailand
Received October 2, 2014; Accepted May 6, 2015
ABSTRACT
Indonesia is one of the biggest central distributions of sago starch. There are some characteristics of sago starch which make it difficult to use in variation of foods. In this study, resistant starch type III (RS3) was produced from sago starch by using lintnerization-autoclaving (LA). Physicochemical characterizations of RS3were compared by native sago starch (NA), hydrolyzed starch by distilled water (DW) and lintnerized starch (L). Amylose content decreased after hydrolyzed by DW and L, but increasing by using LA. Protein and fat contents decreased after hydrolysis, but crude fiber content increasing, the highest value was obtained lintnerized-autoclaved starch. Lintnerized-autoclaved starch has more compact and rigid structure. The RVA viscosity, swelling power and water holding capacity values reduced after all treatments. Oil in water emulsions were also analyzed by mixture of RS3 and emulsifier (casein or SPI). Viscosities of emulsions from RS casein were lower than those of RS-SPI. Emulsion capacity and emulsion stability values were better gotten using RS-SPI than RS-casein. The highest of emulsion capacity was obtained 11.33%. For storage period, the lowest peroxide and anisidine values of mixture RS-emulsifier were resulted from 5% RS-emulsifier + 5% RS + 5% fish oil.
Keywords:sago starch; lintnerization-autoclaving method; resistant starch; fish oil; emulsion
ABSTRAK
Indonesia merupakan salah satu pusat distributor terbesar pati sagu. Sifat dasar pati yang mudah tergelatinisasi membuat penggunaan pasti sagu sangat terbatas dalam produksi makanan. Dalam penelitian ini, pati resisten tipe III (RS3) diproduksi menggunakan hidrolisis asam yang diikuti dengan metode autoklaf. Karakterisasi dari RS3dibandingkan dengan pati sagu murni, dan sagu modifikasi lainnya. Kandungan amilosa menurun setelah dihidrolisis dengan air destilasi dan hidrolisis asam, tetapi meningkat saat dihidrolisis dengan asam yang diikuti proses autoklaf. Kandungan lemak dan protein menurun setelah proses hidrolisis tetapi kandungan serat meningkat, dan nilai serat tertinggi saat menggunakan metode autoklaf. Viskositas, daya kembang dan daya ikat air menurun dibandingkan pati sagu asli dan nilai terendah didapat saat menggunakan metode autoklaf. Emulsi minyak dalam air juga dianalisis dengan menggunakan campuran RS dan emulsifier (kasein atau SPI). Viskositas emulsi yang terbuat dari RS+kasein lebih rendah dari pada emulsi yang terbuat dari RS3+SPI. Nilai kapasitas emulsi dan stabilitas emulsi lebih bagus saat menggunakan emulsi campuran dari RS3-SPI dari pada RS+kasein. Nilai kapasitas emulsi terbesar adalah 11,33%. Selama proses waktu penyimpanan emulsi, nilai peroksida dan anisidin terendah yaitu emulsi yang terbuat dari campuran RS+ emulsifier yang terbuat dari 5% emulsifier+ 5% RS3+ 5% minyak ikan.
Kata Kunci:pati sagu; metode hidrolisis asam-autoklaf; pati resisten; emulsi minyak ikan
INTRODUCTION
Sago starch is extract of the sago palm (Metroxylon saguRottb.). Starch is highly collected in the trunk of the sago palm, approximately 250 kg/dry weight plant. In Southeast Asia, it has been considered as one of the
for novel food application, native sago starch needs modification.
Resistant starch (RS) is one of the modified products and is resistant to hydrolyze by α-amylase. RS cannot be hydrolyzed in the small intestine, but fermented in the large intestine by colonic flora, and its product consists of short chain fatty acids that enhance health of human digestion [3]. Besides that, RS can improve the lipid and cholesterol metabolism. Some physicochemical properties of RS are low water holding capacity, bland flavor, improves expansion and crispness in food applications.
RS is classified to type I (inaccessible starch in a cellular matrix), type II (native uncooked starch granules that form crystalline, and make them difficult to hydrolysis), type III (retrograded starch, which be formed in cooked), type IV (chemical modified starches) [4]. Nowadays, the scientists interest of RS formation especially utilization of RS in food production. RS has stability in heating processing and also contains high nutrition. RS type III is generated by combination of the gelatinization-retrogradation process. Certain factors influence RS type III formation, including amylose content and chain length, autoclaving temperature, storage time and temperature of starch gel [1].
Lintnerized is one of ways for RS3 formation.
Lintnerized starch is obtained by mild acid hydrolysis of α-1,4 and α-1,6 glycosides linkages from amylose and amylopectin. This method increases crystalline content, which becomes resistant by enzymatic hydrolysis. Reference [4] has investigated that resistant banana starch is obtained 16% from this method, and then autoclaved, its shows a lower solubility in water than native starch and RS value is higher than only lintnerized treatment. Besides that, Aparicio’s research [4] has showed that resistant starch prepared by lintnerized-autoclaved contained slowly digestible carbohydrate. Zhao and Yang [5] suggested that utilization citric acid to de-branch on RS type III formation is better than hydrochloric acid and acetic acid.
On the other hand, fish oil, which is rich source of omega-3 poly-saturated fatty acids and very susceptible to lipid oxidation is another important functional compound that is used in food applications, such as fish oil emulsion. Fish oil emulsion needs mixtures of protein and carbohydrate to form the Millard reaction products by increasing emulsifying properties and oxidative stability of fish oil emulsions [6]. RS which has characteristics such as less solubility, high crystallinity and stability in high process temperature can be used in combination with proteins to prepare fish oil emulsion to keep oxidative stability of fish oil. Nasrin et al., [7] reported that oil in water emulsions prepared by mixture of culled banana pulp resistant starch and soy protein
isolate (SPI) were the most stable than mixture of Hylon VII and SPI or using SPI only, resulting the lowest oxidation value which were occurred for storage times. In this study, RS production is utilized as mixture of fish oil emulsion and also by comparing using emulsifiers SPI and casein.
EXPERIMENTAL SECTION
Materials
Sago starch was brought from Indonesia, processed by Alini Company. All other chemicals (citric acid, NaOH, sodium maleate buffer, sodium acetate buffer, sulfuric acid, o-dianisidine reagent, iodine, H2SO4, HCl, petroleum ether, bromocresol green
indicator, methyl red indicator, pancreatic α-amylase, amyloglucosidase, acetic acid, chloroform, potassium iodide, iodine, sodium thiosulphate, casein, hylon VII, para-anisidine, glacial acetic, isooctane, fish oil) used in this research were analytical grade.
Instrumentation
Spectrophotometer (Model UV2, Unicam, England), Soxtec system (Model HT6, Tecator, Sweden), muffle furnace (Model FSE 621-210D, Sanyo Gallenkamp, UK), Rapid Visco Analyser (Model 4, Newport Scientific Pvt., Ltd. Australia), Scanning Electron Microscopy (S-3400N HITACHI) with an accelerating voltage of 20 kV.
Procedure
Lintnerization of starch
The modified methods of Nasrin et al. [7] were used to produce lintnerized sago starch, which then was suspended into 1 N; 1.5 N; and 2 N citric acid solution at 1:1.5 (w/v) ratios. The mixtures were heated at 60 °C and used variation time of hydrolysis (3, 6, and 12 h) and then, samples were neutralized with NaOH 10% and washed properly by distilled water. The samples were dried at 40 °C for 2 days, cooled down, passed through 100 mesh sieves and stored in desiccators.
Hydrolysis starch by distilled water
Preparation of RS3
Samples, including lintnerized starch and lintnerized-autoclaved starch were suspended in water (1:10 w/w) and gelatinized at 85 °C for 30 min. Samples were autoclaved at 135 °C for 30 min, cooled down and store at 4 °C for 24 h. Autoclaving-storing treatments were repeated three times at same temperature and time. Samples were dried at 50 °C, cooled down, milled and sieved through 100 meshes.
Preparation of fish oil emulsion
Mixture starch (using RS or using Hylon VII as native starch rich amylose) and emulsifier (casein or soy protein isolate) based on Table 1 were added with water 60 °C to get aqueous suspensions (10% total solids, w/w), heated at 100 °C, cooled at room temperature and then frozen and lyophilized. Freeze-dried materials were added fish oil and water based on Table 1, to obtain 15% w/w emulsions. Each mixture was blended then homogenized. All emulsions were adjusted at pH 7.5, and then analyzed for emulsion stability, emulsion capacity, viscosity and color value. Besides that, during storage the emulsions were analyzed peroxide value and anisidine value.
Characterizations physicochemical properties
Resistant starch.The resistant starch analysis used the methods described by Nasrin [7]. Sample (100 mg) was placed into a centrifuge tube. Sodium maleate buffer 1 M (pH 6.0) containing pancreatic α-amylase (10 mg/mL) and amyloglucosidase (3 U/mL) was added 4 mL. The tube was closed, mixed up on vortex mixer and incubated them in shaking water bath at 37 °C for 16 h. The reaction was stopped, added 4 mL ethanol (99%) and followed by centrifugation at 3000 rpm for 10 min. Supernatant was separated, then starch lump was added ethanol (50% v/v) 8 mL, stirred and centrifuged again. Resistant starch is measured by adding 2 mL KOH 2 M, and added 8 mL sodium acetate buffer 1.2 M (pH 3.8) and 0.1 mL of amyloglucosidase (3000 U/mL). The mixture was incubated with continuous shaking at 50 °C for 30 min. The glucose was determined by glucose oxidase assay. Sample was added glucose oxidase peroxidase solution containing o-dianisidine reagent, and then incubated at 37 °C for 30 min. Sulfuric acids 12 N was added 2 mL to stop its reaction. The absorbance was measured by spectrophotometer (Model UV2, Unicam, England) at 540 nm.
Amylose. Sample (100 mg) was put into 100 mL Erlenmeyer. Ethanol 95% and NaOH 1 N were added 1 mL and 9 mL, respectively. Mixture was heated for 10 min in boiling water bath, cooled and volume of erlenmeyer was added water until reaching total 100 mL of that Erlenmeyer. Mixture was taken 5 mL and poured into other Erlenmeyer. Acetic acid 1 N and iodine solution
Table 1.Formulation of fish oil emulsion
Compositions (% w/w)
were added 1 mL and 2 mL, respectively. Volume of erlenmeyer was made up to 100 mL with distilled water, waited for 20 min and then absorbance was measured at 620 nm by spectrophotometer (Model UV2, Unicam, England).
Crude Fiber. Samples 2 g were put into flask; added 200 mL hot H2SO4, and then heated at 100 °C for
30 min. Residue was separated by filter, mixed with 200 mL NaOH 1.25% solution and heated-stirred again at 100 °C for 30 min. After cooling down, residue was separated and washed with hot water and ethanol 95%. Residue was dried, weighed, incinerated at 400 °C and reweighed. Crude fiber calculation [10]:
weight lost in furnace Crude fiber = 100
weight of sample x (1) Moisture. Sample 5 g was put into Petri disk which known weight, then put into an oven pre-set at 110 °C for 3 h. Sample was cooled in desiccators and reweighted, then returned into oven at 110 °C for 30 min until constant weight was obtained [10].
weight of initial sample - weight of final sample
Moisture content = x 100
weight of initial sample (2)
Protein. Crude protein was determined by Kjeldahl method. Sample 0.5 g was put in digestion tube. Concentrated H2SO4and catalyst (CuSO4: K2SO4, 0.5 :
1 w/w) was added 10 mL and 1 g, respectively, then digested in a digester at 420 °C for 1 h to liberated nitrogen bond and form ammonium sulphate. Distilled water and NaOH 40% were added 10 mL and 85 mL respectively into the tube. The distillate 25 mL was gotten, added 4% boric acid and indicator (mixing of 0.1% (w/v) of bromocresol green and 0.1% (w/v) of methyl red. Titration used HCl 0.1 until color changes [10].
titration volume x N HCl x 14.007
Total Nitrogen = x 100
weight of sample (3) Protein content = % total N x 6.25 (4)
60 mL Petroleum ether which put in weighted glass cup and evaporated 110 °C for 30 min for immersion, 30 min for washing and 60 min for recovery time. Yield was dried at 100 °C, cooled down and weighed.
weight of cup after extraction - initial weight of cup
Crude fat = x 100
weight of sample (5)
Ash. Sample (5 g) was incinerated at 600 °C for 3 h in muffle furnace (Model FSE 621-210D, Sanyo Gallenkamp, UK). Previously, silica dish was weighted. After incinerating process, the disk and sample was cooled in desiccator and weighed again.
weight of residues after incineration
Ash content = x 100
weight of sample (6)
Carbohydrate. Carbohydrate content was measured from the total (100) minus of contents of protein, fat, ash, and fiber.
Carbohydrate = 100 - (fiber + protein + fat + ash) (7)
Pasting properties
Peak properties were measured by Rapid Visco Analyser (Model 4, Newport Scientific Pvt., Ltd. Australia). Sample (2.5 g) were kept into canister and mixed with 25 mL distilled water. Suspended sample was kept at 50 °C for 1 min, and then temperature was increased until reached 95 °C, kept for 3.2 min, and then decreased to 50 °C. Sample was mixed and homogenized with 960 rpm for 10 sec during starting of test, then decrease 160 rpm and continued it throughout.
Swelling power and solubility
One gram of sample was dispersed in 50 mL distilled water in centrifuge tubes, then heated into water bath at different temperatures (60–95 °C) for 30 min with continuous stirring. Sample was cooled, centrifuged at 3000 rpm for 15 min. Supernatant was dried at 105 °C for 5 h. solubility of that sample can be calculated. While, for swelling determination, wet sample (sediments) was weighted.
weight of dry sample in supernatant
Solubility (%) = x 100
weight of dry sample (8)
weight of wet residue Swelling power (%) = x 100
weight of dry sample (9)
UV/Visible spectrometer analysis
Sample (1 g) was dispersed in 50 mL distilled water then heated in water bath at 95 °C for 30 min with continuous shaking and then cooled at 25 °C. Gelatinized starch (10 mL) was put in Erlenmeyer, added distilled water 25 mL and neutralized with HCl 0.1 M until pH 3. The suspension was mixed with 100 mL distilled water and 0.5 mL of iodine solution. The
absorbance was measured at 190–900 nm by UV spectrophotometer ((Model UV2, Unicam, England) [6].
Scanning Electron Microscopy
The sample particle is sprayed onto the surface of metal plate covered with double-side tape, put into a vacuum chamber. The sample is observed in a tool-coated SEM (S-3400N HITACHI) with an accelerating voltage of 20 kV.
Emulsion capacity and emulsion stability
Sample gotten in each emulsion was centrifuged at 2,100 x g for 30 min. The ratio of the height of the emulsified phase to the height of total liquid was emulsion capacity (%) After that, the homogenized sample was incubated at 45 °C for 30 min and centrifuged at 2,100xg for 30 min. The ratio of the height of the emulsified phase to the height of total liquid was emulsion stability (%).
Peroxide value
Sample (2 mL) was dissolved with 20 mL acetic acid-chloroform (3:2) solution. 0.25 mL of KI 95% was added, incubated shaking water bath 25 °C for 1 min and added 12 mL distilled water. Sample was titrated with 0.01 N sodium thiosulphate solutions until the color changing (transparent). Indicator of soluble starch 1% was used.
(S x M x 1000) Peroxide value (meq/L sample) =
mL of sample (11)
where, S = mL of sodium thiosulphate; M = 0.01, concentration of sodium thiosulphate
Anisidine value
Sample (0.5 mL) was put in volumetric flask 25 mL and made up to volume with isooctane. The absorbance (Ab) of the resulting solutions at 350 nm was determinate. Besides that 5 mL of each solution was pipette into a test tube and reagent also, and then para-anisidine solution (para-anisidine dissolved in acetic acid 0.25 g/100 mL solution) was added to each tube and mixed well. After 10 min, the absorbance (As) of the sample solutions was read. Anisidine value was calculated:
25 x (1.2 As-Ab) Anisidine value =
mL of sample (12)
Statistical analysis
Table 2.RS contents of lintnerized starch and lintnerized-autoclaved starch
RS value (%) Time of
hydrolysis (h)
Concentration
of Acid (N) Lintnerized-autoclaved Lintnerized 1 35.49 ± 0.003 1.24 ± 0.001
Data were mean and standard deviation of three determinations
RESULT AND DISCUSSION
Resistant Starch Content
Resistant starch (RS) contents of lintnerized starch and lintnerized-autoclaved starch by variation oftime and citric acid concentration are shown in Table 1. In the present study, time variations of hydrolysis did not affect on the amount of RS content whereas RS value was affected by concentrations of citric acid. Highest RS contents were obtained of lintnerized starch by citric acid concentration of 2 N. Previous studies reported that increased concentration of hydrochloric acid and followed by autoclaving-cooling treatment affected RS value [5,7]. In contrast, RS yields were decrease of variation of time when sago starch was only hydrolyzed by citric acid without autoclaving-cooling treatment. Partial acid hydrolysis broke down the amylopectin structure, generating short linear chains so that increasing the mobility of molecules. When autoclaving-cooling treatment, these chains rearranged and re-crystallized, forming resistant product which have tightly packed structure stabilized by hydrogen bonding while only partial acid hydrolysis was treated, the resistant product cannot be formed. Therefore lintnerized starch generated low RS.
Chemical Composition
Chemical compositions (amylose, crude fiber, moisture, protein, fat, ash and carbohydrate) both highest RS value of lintnerized starch and lintnerized-autoclaved starch were compared by composition of native sago starch and hydrolyzed starch by distilled water (Table 2). Amylose content of native starch obtained 41.14%. Amylose of lintnerized-autoclaved starch was highest than other samples. Hydrolyzed starch by distilled water followed autoclaving without cooling resulted lowest amylose content. RS value was decrease, after autoclaving [3]. Zhao [5] found effect of cycle times of autoclaving-cooling of maize starch on RS. Maize starch was dispersed in distilled water then
autoclaved-cooled, increasing RS value. Amylose contents of corn starch decreased (from 16.9% to 13.3%) after hydrolyzed by acid [9]. Aparicio [4] explained the decreased of amylose content during acid hydrolysis acid that acid attacked the amorphous regions mostly where amylose resides.
Native sago starch had the highest protein and fat than others. Hydrolysis by citric acid decreased significantly protein and fat contents. Also after autoclaving-cooling treatment, protein and lipid content decreased, because heat treatment can denature protein and saponify fat which became soluble. Crude fiber content of lintnerized-autoclaved starch was highest than native and lintnerized starch. It was related with re-associate the structure when gelatinization and retrogradation process. Moisture content of most native starches was around 12% at ambient temperature and humidity conditions. Lintnerized-autoclaved starch had the lowest moisture (8.33 ± 0.1).
Microstructure Analysis
Scanning electron micrographs of native sago starch, hydrolyzed starch by distilled water, lintnerized and lintnerized-autoclaved starch were presented in Fig. 1–4. The native starch granules were found to be oval to round shaped with well defined edges compared other samples. From that figure also looked that native starch has the smallest granules. However, as shown in Fig. 2 and 3 the starch granules lost their smoothness and structural integrity. Moreover starch granules of lintnerized starch are largely amorphous structure. Starch granules of lintnerized-autoclaved were dense and rigid structure, indicating it formed crystalline structure after gelatinization and retrogradation process.
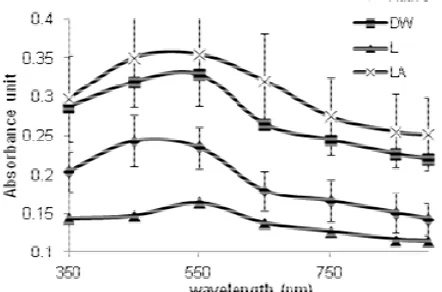
UV/Visible Spectra Analysis
Fig 1.Granule morphology of sago starch
Fig 2. Granule morphology of hydrolyzed starch by distilled water
Fig 3.Granule morphology of lintnerized starch Fig 4.starch Granule morphology of lintnerized-autoclaved
Fig 5. UV/visible spectra of native sago starch, hydrolyzed starch by distilled water (DW), lintnerized starch (L) and lintnerized-autoclaved starch (LA)
difference absorbance of native starch, hydrolyzed starch by distilled water, lintnerized starch and lintnerized-autoclaved starch. The highest intensity of peak was reached by lintnerized-autoclaved starch
whereas the lowest intensity of peak was reached by lintnerized starch.
Pasting Properties
Table 3.Chemical compositions of native sago starch, hydrolyzed starch by water (DW), lintnerized starch (L) and lintnerized-autoclaved starch (LA)
Amount of content (%) Chemical
composition Native DW L LA
Amylose 41.14 ± 0.006 30.14 ± 0.001 36.52 ± 0.001 57.20 ± 0.006 Amylopectin 58.86 ± 0.006 69.86 ± 0.001 63.48 ± 0.001 42.8 ± 0.006 Carbohydrate 97.33 ± 0.017 95.22± 0.001 97.31 ± 0.006 96.22 ± 0.025 Protein 0.58 ± 0.058 0.35 ± 0.001 0.26 ± 0.001 0.15 ± 0.058 Fat 1.67 ± 0.006 1.0 ± 0.000 0.83 ± 0.006 0.50 ± 0.000 Ash 0.36 ± 0.000 1.44 ± 0.001 0.45 ± 0.002 0.32 ± 0.001 Crude fiber 0.06 ± 0.005 1.99 ± 0.035 1.15 ± 0.015 2.5 ± 0.044
1. Data were mean and standard deviation of three determinations. 2. Dry basis
3. Production of lintnerization starch uses citric acid 2 N for 12 h.
4. Production of lintnerization-autoclaved starch uses citric acid 2 N for 12 h, and it is autoclaved at 135 °C for 30 min and cooled 4oC. Autoclaving-cooling treatments were repeated three times at same temperature and time.
Table 4. Pasting properties of native sago starch, hydrolyzed starch by distilled water, lintnerized starch and lintnerized-autoclaved starch.
Sample Properties
Native DW L LA
Peak viscosity (RVU) 403.03 ± 34.95 75.00 ± 7.32 23.33 ± 5.46 15.25 ± 3.44 Through (RVU) 146.17 ± 5.48 42.89 ± 1.69 22.17 ± 5.08 11.19 ± 1.48 Break down viscosity (RVU) 256.86 ± 35.44 32.11 ± 5.71 1.17 ± 0.38 4.05 ± 4.79 Final viscosity (RVU) 199.72 ± 8.07 50.28 ± 3.39 29.39 ± 5.92 13.22 ± 1.72 Setback viscosity (RVU) 53.56 ± 5.58 7.39 ± 1.92 7.22 ± 1.71 2.03 ± 0.43 Peak time (min) 3.49 ± 0.14 4.62 ± 0.17 6.71 ± 0.08 4.46 ± 2.91 Pasting temperature (°C) 50.57 ± 0.39 68.92 ± 3.08 ND ND
Data were mean and standard deviation of three determinations.
Native = sago starch; DW = hydrolyzed starch by distilled water; L= lintnerized starch; LA = lintnerized-autoclaved starch
Fig 6.Solubility of native sago starch, hydrolyzed starch by distilled water (DW), lintnerized starch (L) and lintnerized-autoclaved starch (LA)
Solubility
Fig. 6 shows the solubilities of native starch, hydrolyzed starch by distilled water, lintnerized starch and lintnerized-autoclaved starch. Solubility of lintnerized starch drastically increased than other samples. Nasrin [7] also found increased solubility of lintnerized starch using hydrochloric acid 2 N compared lintnerized starch using hydrochloric acid 1 N and 1.5 N. In this study,
(52.67%) was almost similar with native starch (52.00%), this value was difference with [7] and [4] that lintnerized-autoclaved sample from banana starch had the lower solubility than native starch. In contrast, [3] reported that solubility of lintnerized-autoclaved from corn starch, Hylon V and Hylon VII samples obtained higher than native and lintnerized starch. It can be related with other effect such as lipid-amylose complex, protein-amylose complex. In this study, lipid and protein contents of native starch were highest than other samples, it may be due to the fact that there is formation of lipid and protein complexes with amylose so that decreasing the solubility value subsequently giving almost similar value with lintnerized-autoclaved starch.
Swelling Power
Fig 7. Swelling power of native sago starch, hydrolyzed starch by distilled water (DW), lintnerized starch (L) and lintnerized-autoclaved starch (LA)
E1= 7.5% emulsifier (casein or SPI) + 7.5% fish oil; E2= 3.75% emulsifier + 3.75% RS + 7.5% fish oil; E3= 3.75% emulsifier + 3.75% Hylon VII + 7.5% fish oil; E4= 10% emulsifier + 5% fish oil; E5= 5% SPI + 5% RS + 5% fish oil; E6= 5% Hylon VII + 5% fish oil.
Fig 8. Emulsion capacity of RS and Casein compared Emulsion produced using RS and Soy Protein Isolate
E1= 7.5% emulsifier (casein or SPI) + 7.5% fish oil; E2= 3.75% emulsifier + 3.75% RS + 7.5% fish oil; E3= 3.75% emulsifier + 3.75% Hylon VII + 7.5% fish oil; E4= 10% emulsifier + 5% fish oil; E5= 5% SPI + 5% RS + 5% fish oil; E6= 5% Hylon VII + 5% fish oil
Fig 9. Emulsion stability of RS and Casein compared Emulsion produced using RS and Soy Protein Isolate
E1= 7.5% SPI + 7.5% fish oil; E2= 3.75% SPI + 3.75% RS + 7.5% fish oil; E3= 3.75% SPI + 3.75% Hylon VII + 7.5% fish oil; E4= 10% SPI + 5% fish oil; E5= 5% SPI + 5% RS + 5% fish oil; E6= 5% Hylon VII + 5% fish oil
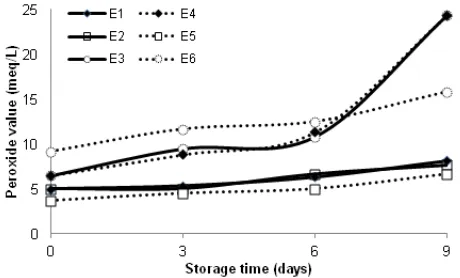
Fig 10. Peroxide value of emulsions from RS and Casein
energy which looses the intra granular bonds and then granules absorbed water. The starch granule which had low molecular weight of amylose will soluble easily and released out of the granules into surrounding medium. By shaking way during process, it can faster break down internal granular bonds so that it caused enormous swelling [7].
From Fig. 7, the lowest value of swelling power at 95 °C was lintnerized-autoclaved starch (12.37%) whereas the highest value at the same temperature was native starch (27.62%). Swelling power of lintnerized starch was 21.71% and for hydrolyzed starch by distilled water was reached 16.69%. In theoretically, lintnerized-autoclaved samples presented lower swelling power (lower water retention features) than native and lintnerized starch. Swelling power of lintnerized-autoclaved starch was lower than native and lintnerized starches [4,7].
Production Fish Oil Emulsions from RS and Casein Compared Emulsion Produced Using RS and Soy Protein Isolate (SPI)
Emulsion capacity and emulsion stability values
E1= 7.5% SPI + 7.5% fish oil; E2= 3.75% SPI + 3.75% RS + 7.5% fish oil; E3= 3.75% SPI + 3.75% Hylon VII + 7.5% fish oil; E4= 10% SPI + 5% fish oil; E5= 5% SPI + 5% RS + 5% fish oil; E6= 5% Hylon VII + 5% fish oil
Fig 11.Peroxide value of emulsions from RS and SPI
E1= 7.5% casein + 7.5% fish oil; E2= 3.75% casein + 3.75% RS + 7.5% fish oil; E3= 3.75% casein + 3.75% Hylon VII + 7.5% fish oil; E4= 10% casein + 5% fish oil; E5= 5% casein + 5% RS + 5% fish oil; E6= 5% Hylon VII + 5% fish oil
Fig 12. Anisidine value of emulsions from RS and Casein
E1= 7.5% casein + 7.5% fish oil; E2= 3.75% casein + 3.75% RS
+ 7.5% fish oil; E3= 3.75% casein + 3.75% Hylon VII + 7.5%
fish oil; E4= 10% casein + 5% fish oil; E5= 5% casein + 5% RS
+ 5% fish oil; E6= 5% Hylon VII + 5% fish oil
Fig 13.Anisidine value of emulsions from RS and RS
When compared emulsion from Hylon VII and emulsifier (casein or SPI), the emulsion capacity also showed lower value. These results indicated that RS may improve emulsifying characteristics. Emulsion capacity value of mixture Hylon VII and albumin was gotten 12%, this result was higher than using mixture of Hylon VII and casein (3.33%), because the Ozturk’s research didn’t use the same amount of water in the emulsion system, thus the value of emulsion capacity was higher that this research [3].
Emulsion stabilities (Fig. 9) also exhibited that the highest value was gotten from mixture of emulsifier (Casein or SPI) and RS, but the higher value of emulsion capacity was obtained when using mixture of RS and SPI (11.33%) than that of RS and casein (8.00%). However, emulsion made from RS-casein showed increasing of fish oil load increased emulsion stability value.
Peroxide and Anisidine Values of RS and Casein Compared Emulsion Produced Using RS and Soy Protein Isolate
Peroxide value (PV) and anisidine value (AV) were a measure of oxidation or rancidity. PV is an indicator of initial stages of oxidative change, whereby a lipid can be decay or still stable of hydroperoxide concentration by monitoring the amount of hydroperoxides as a function of time. Hydroperoxide is called as primary oxidation products and unstable, so that being susceptible to decomposition become the secondary oxidation products such as aldehydes, ketones, alcohols, and epoxy compounds. One of Methods for knowing secondary oxidation products was through anisidine value. AV method measures the content of aldehydes generated during the decomposition of hydroperoxide.
From Fig. 10-13, PV and AV of each emulsion increased with increasing storage time. Peroxide values of emulsions made from RS-casein at the storage time were higher that these of emulsion made from RS-casein. Emulsion made from 5% SPI + 5% RS + 5% fish oil (E2) had the lowest of peroxide value
(1.67 meq/L) compared other emulsions (Fig. 10 and 11) and also emulsion made from 5% casein + 5% RS + 5% fish oil (E2) had the lowest of peroxide value
(3.67 meq/L) if compared with emulsion made from only casein or mixture of casein and Hylon VII. At the 9th days of storage period, PV of E2 made from
SPI + RS was 6.33 meq/L where as PV of E2 made
fish oil than emulsion made from RS. The highest of PV was gotten emulsion made from 10% casein + 5% oil (25.00 meq/L) and also from 10% SPI + 5% fish oil (24.33meq/L). In this present study, emulsifier (casein or SPI) gave high effect because emulsion made from 7.5% emulsifier (casein or SPI) + 7.5% fish oil result PV < 10 meq/L. Nasrin [13] reported that emulsion made only 7.5% SPI + 7.5% fish oil were more susceptible to oxidation that made by 10% SPI + 5% oil.
Anisidine values of each emulsion were shown in Fig. 12-13. Each emulsion made from RS-casein had lower value than made from RS-SPI. However, emulsion made from 5% emulsifier (casein or SPI) + 5% RS+ 5% fish oil was lower value than other emulsion systems. At the 0thday, the AV made from 5% SPI+ 5% Hylon VII+ 5% fish oil were the highest value (4.86) compared other emulsions (AV< 2).
CONCLUSION
Resistant starch type III (RS3) was produced from
sago starch by using variation of time and variation of citric acid concentration through lintnerization-autoclaving methods. Variation times were not affect resistant starch production, but variation of citric acid concentrations resulted different of RS contents.
Physicochemical of RS were compared by native sago starch, hydrolyzed starch by distilled water and lintnerized starch. Amylose content decreased after hydrolyzed by distilled water and lintnerization, but increasing by using lintnerization-autoclaving method. Protein and fat contents decreased after hydrolysis, but crude fiber content increasing, the highest value was obtained lintnerized-autoclaved starch. Lintnerized-autoclaved starch had compact and rigid structure than others. UV/visible spectra showed the absorbance intensity decreased after lintnerization while increased when treated with hydrolysis by distilled water and lintnerization-autoclaving method. The RVA viscosity, swelling power values reduced after all treatments. The lowest of these values were obtained lintnerized-autoclaved starch.
Oil in water emulsions were also analyzed by mixture of RS and casein, compared also using mixture of RS and SPI, for comparison emulsions were made from Hylon VII using emulsifier (casein or SPI). Emulsion
capacity and emulsion stability values were better gotten using RS-SPI than using RS-casein. The highest of emulsion capacity was obtained 11.33% (5% SPI + 5% RS + 5% fish oil. For storage period, the lowest peroxide and anisidine values of mixture RS-SPI and RS-casein were resulted from 5% emulsifier (casein or SPI) + 5% RS + 5% fish oil, and the lowest percentage of these values was exhibited emulsion using mixture RS-SPI than RS-casein.
ACKNOWLEDGEMENT
We would like to thank DIKTI, Indonesia government scholarship for providing financial supports. (Joint Degree Program Sepuluh Nopember Institute of Technology (ITS) and Asian Institute of Technology (AIT), B-18981/Kemsetneg/Setmen/KTLN/ KL.00/09/2013).
REFERENCES
1. Lin, J.H., and Chang, Y.H., 2006, J. Agric. Food Chem., 54 (16), 5880–5886.
2. Singhal, R.S., Kennedy, J.F., Gopalakrishnan, S.M., and Kaczmarek, A., 2008, Carbohydr. Polym., 72 (1), 1–20.
3. Ozturk, S., Koksel, H., and Ng, P.K.W., 2011, J. Food Eng., 103 (2), 156–164.
4. Aparicio-Saguilán, A., Flores-Huicochea, E., Tovar, J., García-Suárez, F., Gutiérrez-Meraz, F., and Bello-Pérez, L.A., 2005, Starch-Stärke, 57 (9), 405–412.
5. Zhao, X.H., and Lin, Y., 2009, Eur. Food Res. Technol., 228 (6), 1015–1021.
6. Anal, A.K., and Singh, H., 2007, Trends Food Sci. Technol., 18, 240–251.
7. Nasrin, T.A.A., and Anal, A.K., 2014, Food Hydrocolloids, 35, 403–409.
8. AOAC, 2002, Official Method of Analysis, The Association of Official Analytical Chemistry, AOAC, Virginia.
9. Xin, J.Y., Wang, Y., Liu, T., Lin, K., Chang, L., and Xia, C.G., 2012, Int. J. Mol. Sci., 13 (6), 7226– 7236.