Vital & Growing:
The engaging cover of this report
represents two interlocking national birds,
the Javanese Hawk Eagle and the Bald
Eagle. The former belongs to Indonesia and
the latter represents the US. Together, they
depict the collaboration and relationship
Amcham Indonesia & The U.S. Chamber of Commerce, 2016 © copyright reserved
AUTHOR
PRINCIPALRESEARCHER
EDITOR
ASSOCIATE EDITORS
The US-Indonesia Investment Report 2016
Database Services Provided by CEIC Data Company, Jakarta
Peter Milne
Muhammad Abduh
A. Lin Neumann
Sarah Howe Arian Ardie John Goyer Mary Silaban
Vital & Growing:
Adding Up the US-Indonesia
Economic Relationship
Preface
The US-Indonesia Investment Initiative is now in its fourth year and is a collaborative effort between AmCham Indonesia and the U.S. Chamber of Commerce in Washington, DC. Throughout the year, companies active in the Initiative work closely with the Indonesian government and private sector leaders to identify ways in which to improve the investment climate and achieve our shared objective of higher economic growth in Indonesia.Under the Initiative, our annual Investment Summits have become key milestones at which Indonesian officials and American companies share ideas in a constructive and mutually
beneficial manner.
As part of this work, each year we prepare an Investment Report. In 2013, our first report broke new ground by more accurately calculating the real level of US company foreign direct investment into Indonesia. This year, our fourth such report, “Vital & Growing: Adding up the US-Indonesia Economic Relationship,” takes a fresh approach by looking beyond direct investment and calculating the full value for Indonesia of the total economic relationship with US companies. The “big number” we found may surprise readers, and we think it will focus needed attention on nurturing and opening up the business climate.
As always, we want to recognize our Indonesian partners in this work. The Indonesian Chamber of Commerce and Industry (KADIN) and the Employers’ Association of Indonesia (APINDO) are our key private sector partners, both of which provide counsel, support and guidance on an ongoing basis.
The other agency with whom we work particularly closely is the Indonesian Investment Coordinating Board (BKPM), which has been a co-sponsor of our Summits since the beginning. We greatly value the interaction with BKPM and look forward to more joint activities in the future.
This report would not have been possible without the hard work of both the AmCham and the U.S. Chamber staff. Our consultant Arian Ardie provides valuable advice and hard work throughout the year on the Initiative and the Report. We are also grateful to all the companies who support the Initiative and met with us to round out the data and share their insights and recommendations for the report.
Finally, we offer a word of heartfelt thanks to the authors of this report, Peter Milne and Muhammad Abduh. Peter marshalled the resources and wrote the report while Abduh dug deep into the data to return the vital figures needed to break new ground.
Our annual Investment Summits
have become key milestones at
which Indonesian officials and
American companies share ideas
in a constructive and mutually
Table Of
Contents
Pages 4–5
Pages 6–8
Pages 8–14
Pages 14–17
Pages 18–20
Pages 20–27
Pages 27–31
Pages 32–33
Key Findings
02 Recent Trends in the Indonesia–US Economic Relationship
01 The Real Impact of the US–Indonesia Economic Relationship
04 Looking Beyond Our 2014 Baseline
03 Indonesia’s Current Economic Position & Outlook
05 Cross-Sectoral Analysis & Ranking
06 Getting to a Best–Case Scenario
07 The Big Number & Our Conclusions
Index
Page 10
Page 8
Page 8
Page 9
Page 13
Page 16
Page 16
Page 16
Page 17 Page 13
Page 13
Page 18
Page 21
Tables
Figures
E1 The evolution of the five components of the Big Number, 2010-14
E1A strong recovery in realized US FDI inflows into Indonesia, 2010-14 ($ Billion)
E2Growth of total economic activities vs. Indonesia GDP Growth, 2010-15 (percent)
E3Total economic activities growth is rapidly outpacing Indonesia’s GDP growth, 2011-14 (percent)
E4Evolution of US share of ASEAN peers’ economic activities, 2010–14 (Percent)
E5Indonesia’s manufacturing is a shadow of its former self (Growth in GDP and real manufacturing output, %)
E6Indonesia’s economy has de-industrialized prematurely (Manufacturing as a share of GDP, %)
E7Indonesia’s global manufacturing market share is low and stagnant (Share in global manufacturing market, %)
E8Rupiah Depreciation against the US dollar 2013-16 (Rupiah)
E2Comparison of total US economic activities with ASEAN peers, 2010-14 (Nominal price, $ billion)
E3Comparison of US share of ASEAN peers’ economic activities, 2010–14 (Percent)
E4Values of Indonesia-US economic activities in the three scenarios, 2015-19 ($ billion)
Key
Findings
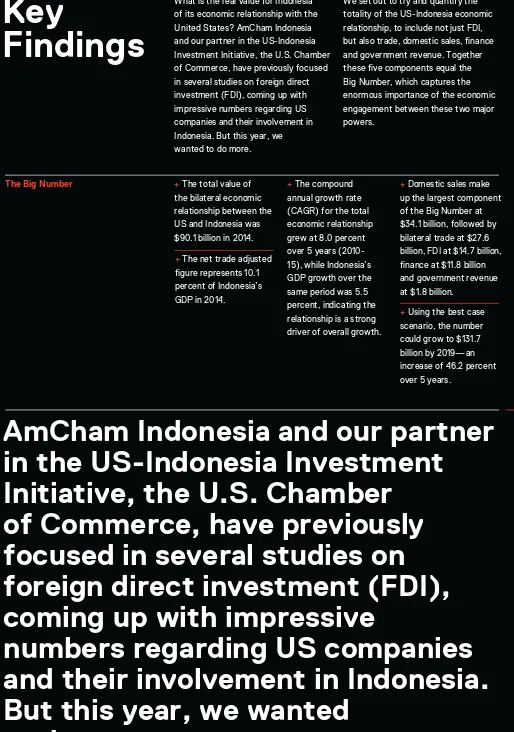
What is the real value for Indonesia of its economic relationship with the United States? AmCham Indonesia and our partner in the US-Indonesia Investment Initiative, the U.S. Chamber of Commerce, have previously focused in several studies on foreign direct investment (FDI), coming up with impressive numbers regarding US companies and their involvement in Indonesia. But this year, we wanted to do more.
We set out to try and quantify the totality of the US-Indonesia economic relationship, to include not just FDI, but also trade, domestic sales, finance and government revenue. Together these five components equal the Big Number, which captures the enormous importance of the economic engagement between these two major powers.
+ The total value of the bilateral economic relationship between the US and Indonesia was $90.1 billion in 2014.
[image:6.595.25.539.33.765.2]+ The net trade adjusted figure represents 10.1 percent of Indonesia’s GDP in 2014.
The Big Number + The compound
annual growth rate (CAGR) for the total economic relationship grew at 8.0 percent over 5 years (2010-15), while Indonesia’s GDP growth over the same period was 5.5 percent, indicating the relationship is a strong driver of overall growth.
+ Domestic sales make up the largest component of the Big Number at $34.1 billion, followed by bilateral trade at $27.6 billion, FDI at $14.7 billion, finance at $11.8 billion and government revenue at $1.8 billion.
+ Using the best case scenario, the number could grow to $131.7 billion by 2019—an increase of 46.2 percent over 5 years.
AmCham Indonesia and our partner
in the US-Indonesia Investment
Initiative, the U.S. Chamber
of Commerce, have previously
focused in several studies on
foreign direct investment (FDI),
coming up with impressive
numbers regarding US companies
and their involvement in Indonesia.
But this year, we wanted
Legal Certaintyis the foundation for business confidence and growth. Both US and Indonesian companies will be able to invest, grow and create jobs if there is greater legal certainty in terms of contract sanctity, enforcement of existing laws and an impartial judiciary.
Collaboration and Communicationare vital for the creation of an enabling economic environment and the development of rational laws and regulations. Effective communication as economic policies are developed to make use of the experience and expertise of the private sector will lead to effective policies to make Indonesia a world class economy.
Innovationis the key to keeping pace in a dynamic global economy. Incentives for taking risks, finding new ways of doing things, investing in research and development and human resource capacity building are the keys to innovation.
Bureaucratic and Policy Reformmust continue and expand. Specific examples include the abolition of the Negative Investment List (DNI), rationalization of the work permit process, streamlining of permitting at all levels of government, and reform and proper incentivization of the civil service and judiciary.
The Road to the Best Case
Economic Sector Potential
US Company Sentiment
Achieving the best-case scenario will depend on actions taken by both the Indonesian and US governments. It is also dependent on external factors that cannot necessarily be controlled. There are, however, a series of economic reforms that can be undertaken by the Indonesian government that would
increase the likelihood of achieving the best-case scenario. The process of economic reform has already been started by the Widodo administration, but will need to continue and expand to achieve the desired outcome.
These include:
The report also looks at nine industrial, extractive and service sectors. Each one is at a different stage of development with US companies playing different roles in each. The degree to which each sector is controlled by the government is a main factor in the performance of each of these sectors, now and into the future.
Based upon a ranking system developed in the report, several sectors have a high degree of future potential. These include the creative
economy, finance and infrastructure. Several sectors in which US companies have a significant presence have average prospects growing apace with GDP, such as oil and gas, consumer goods and agriculture. The final set of sectors have lower potential partly due to restrictive government policies that inhibit investment and create uncertainty. These include extractive, pharmaceutical/healthcare/ life sciences and information
communications technology (ICT).
A survey was also taken and interviews were conducted with the executives of US companies both in Indonesia and the US. Here are some of the findings:
+ When asked if the reform packages have had any impact on their own businesses, only 25 percent stated that they had “some impact,” while 75 percent stated that there was “no impact” or that it was still “too early to say.”
+ 87 percent felt that there had been “some improvement” in the investment climate under the Widodo administration;
What is the real value for Indonesia of its economic relationship with the United States? AmCham Indonesia and our partner in the US-Indonesia Investment Initiative, the U.S. Chamber of Commerce, have previously focused in several studies on foreign direct investment (FDI), coming up with impressive numbers regarding US companies and their involvement in Indonesia. But this year, we wanted to do more.
FDI is fickle and also a relatively unpredictable indicator of the true importance of the Indonesia-US economic relationship. We asked ourselves instead if we could quantify the wide range of economic activities that go into the complex relationship between the US and Indonesia. In undertaking this task— perhaps the first such effort of its kind—we believe we have found a new “Big Number” that captures the enormous importance of the economic engagement between these two major economic powers and also underscores the need to keep that economic relationship vital and growing
as we seek to deepen the partnership between the companies we represent and Indonesia.
The New Big Number
In analyzing the available data we focused on a wide-ranging series of engagements that go far beyond traditional FDI to encompass financial flows, company sales, government revenues, trade and FDI. Our aim is to capture, as best we can, the entire universe of economic activities between the US and Indonesia. In a nutshell, based on our analysis of a wide range of economic activities between the two countries, we came up with a staggering figure: In 2014, our baseline year, the total value of all economic activities shared by Indonesia and the US amounted to $90.1 billion. This amounts to about 10.1 percent of Indonesian’s total GDP in 2014.
In this summary we briefly describe the methodology we used and also discuss how the relationship can grow significantly in terms of policies. It is our strong belief that if Indonesia follows through on President Joko
01
The Real
Impact of the
US–Indonesia
Economic
Relationship
In 2014, our baseline
year, the total value of all
economic activities shared
by Indonesia and the US
amounted to US$90.1 billion.
This amounts to about 10.1
Widodo’s stated intention to reduce protectionism and bureaucratic obstacles, then economic growth will be robust with the ultimate beneficiaries being the Indonesian people. In our best case scenario— which requires getting policy and regulations right, among other things— the total value of economic activities between the US and Indonesia could grow from $90.1 billion in 2014 to $131.7 billion in 2019, or an increase of 46.2 percent over 5 years.
A Brief Methodology
Here we should digress briefly to explain the methodology behind these numbers, without going into too much detail. The full methodology can be found in Annex I of the main report. Basically, there are five major components in this Big Number. Realizing that FDI is just one part of a greater whole, we tried to capture four other areas of economic activity that are just as important, indeed sometimes far more important, than FDI. The five components are: (i) the sum of trade between the two countries including imports and exports in both directions; (ii) financing between the two countries; (iii) the sum of domestic sales by US companies in Indonesia, and Indonesian companies in the US; (iv) government revenues derived from the operations of US companies in Indonesia (however, this relies only on VAT revenue, given data availability issues); and finally (v) the sum of realized FDI, not just of US companies in Indonesia,1
but also of Indonesian companies in the US. Given the lack of sufficient data for 2015, we chose 2014 as our base year, for which the total economic activities in the relationship amount to $90.1 billion. This total figure then needs to be adapted in order to make it methodologically compatible with Indonesia’s GDP figure, as we need to
convert the various sums (of trade, FDI, finance and sales) into balance figures.2 These balances when totaled
allow us to compare like for like, which indicates that the value of economic activities is equivalent to 10.1 percent of GDP in 2014. Due to the lack of all necessary data in 2014, figures for sales and government revenue have been extrapolated from 2013.
Beyond FDI
The first AmCham Indonesia/U.S. Chamber of Commerce3 Investment
Report was published in 2013. That report focused on FDI and our analysis revealed that real US FDI into Indonesia was far higher than the officially published figures. We concluded, conservatively, that from 2004 to 2012, US FDI into Indonesia totaled about $65 billion. This contrasted significantly with most published data and suggested that the US, instead of being the fourth-largest investor in the country (at that time), was likely the largest investor in Indonesia. More narrowly defined official figures from Bank Indonesia showed US FDI for the same period as being just over a paltry $7 billion.
Moreover, back in 2013, our findings indicated that 95 percent of total US FDI into Indonesia was in the oil and gas, mining and manufacturing sectors and, while the oil and gas and mining industries were by far the largest for US companies, the manufacturing sector was increasing in prominence.
However, the world is a very different place today than it was in 2013. After weathering the first few years after the 2008 global financial crisis remarkably well, largely due to the commodities boom, the Indonesian economy has been gradually dragged down by the collapse in commodity prices since 2012 and the economic slowdown in China. This has been compounded by the local currency falling more
1 Definition of US companies: In our broad definition of US companies with economic activities in Indonesia, we include all those companies that are owned by holding companies registered in the US with the address of principal executive offices as being in the US. This also applies in those cases where operating offices may be located overseas and all their subsidiaries, and affiliates and their licensees, are engaged in business activities in markets outside the US.
2 Further details of the methodology can be found in Annex I in the main report accompanying this Executive Summary.
than 27 percent since 2013, and the higher perceived risks of investing in emerging markets globally. Meanwhile, previously robust FDI by US companies in the oil and gas and mining industries took a major hit, with all firms cutting back investment and exploration, and some firms even deciding to pull out of the country.
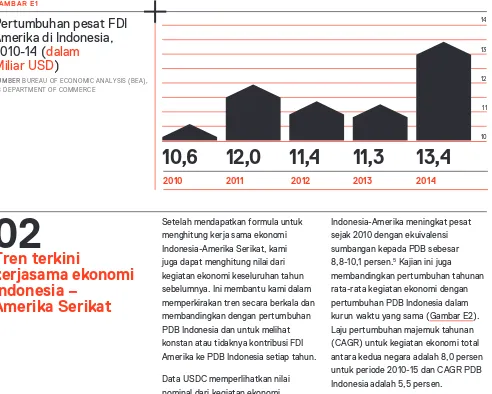
If we were to look at US FDI in the light of the current economic environment, while it is recovering well, it no longer tells such an impressive story. Based on US Department of Commerce data, in 2014 (the latest available year), realized US FDI into Indonesia rose to $13.5 billion, up from $11.3 billion in 2013, a 20 percent increase. Data from the Indonesia Investment Coordinating Board (BKPM), however, show far lower US numbers. BKPM indicates that realized FDI for 2015 made Singapore the leading investor ($5.9 billion), followed by Malaysia ($3.1 billion), Japan ($2.9 billion), the Netherlands ($1.3 billion) and South Korea ($1.2 billion).4 The US in contrast
is said to be the seventh largest investor, at just $0.9 billion in 2015.
But FDI is not always the best way to measure the true value of an economic relationship. It can fluctuate widely depending on economic conditions (Figure E1). This is what led us this year to think about the US economic relationship with Indonesia in a new and maybe unique way.
Based on more complete US Department of Commerce data for US realized FDI into Indonesia, Figure E1 below shows a very different story, however. While we see a clear slowdown in investment in the wake of the global financial crisis from 2011 through to 2013, realized FDI rebounded strongly in 2014. While admittedly we cannot compare the US Department of Commerce data for US realized FDI directly with the data from BKPM for other countries’ FDI, the US Department of Commerce data do nonetheless strongly suggest that the US is by far the largest foreign investor in Indonesia—and not just in 2014, but for several years previously.
02
Recent Trends in
the Indonesia—
US Economic
Relationship
Once we have our formula for calculating total economic activities between Indonesia and the US, we can also calculate the value of total economic activities for previous years. This allows us to see trends over time, and compare these to Indonesia’s GDP growth, as well as how constant (or
not) the size of Indonesia-US economic activities is as a share of Indonesia’s annual GDP by year. The nominal value of economic activities has been increasing rapidly since 2010, while the annual equivalent share of Indonesia-US economic activities in Indonesia’s GDP has remained more or less fixed
A strong recovery in
realized US FDI inflows
into Indonesia, 2010–14
(
$ billion
)
SOURCE BUREAU OF ECONOMIC ANALYSIS (BEA), US DEPARTMENT OF COMMERCE
FIGU RE E 1
10.6
12
11.4
11.3
13.4
2010 2011 2012 2013 2014
14 13 12 11 10
4 BKPM defines US direct investment abroad as the ownership or control, direct or indirect, by one US citizen of 10 percent or more of the voting securities if the foreign business enterprise is incorporated, or an equivalent interest if the foreign business enterprise is unincorporated.
5 Note: the rate of growth of our Big Number is expressed based on IDR, and not using $.
4 BKPM defines US direct investment abroad as the ownership or control, direct or indirect, by one US citizen of 10 percent or more of the voting securities if the foreign business enterprise is incorporated, or an equivalent interest if the foreign business enterprise is unincorporated.
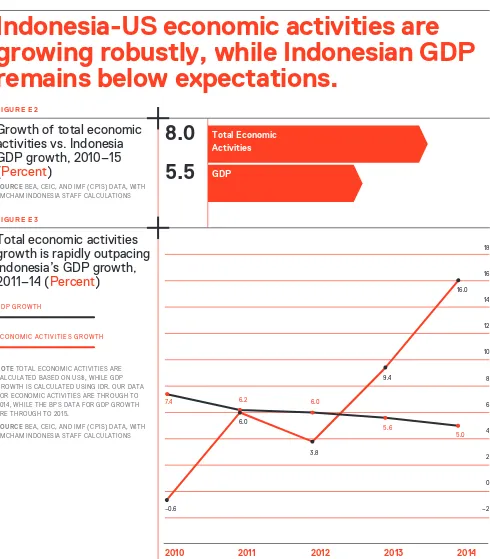
[image:10.595.37.522.412.753.2]Growth of total economic
activities vs. Indonesia
GDP growth, 2010–15
(
Percent
)
SOURCE BEA, CEIC, AND IMF (CPIS) DATA, WITH AMCHAM INDONESIA STAFF CALCULATIONS
Total economic activities
growth is rapidly outpacing
Indonesia’s GDP growth,
2011–14 (
Percent
)
FIGU RE E2
FIGU RE E3
Total Economic Activities
8.0
5.5
GDP2010 2011 2012 2013 2014
18 16 14 12 10 8 6 4 2 0 –2 –0.6
7.4 6.2 6.0
5.6
5.0
6.0
3.8
9.4
16.0
NOTE TOTAL ECONOMIC ACTIVITIES ARE CALCULATED BASED ON US$, WHILE GDP GROWTH IS CALCULATED USING IDR. OUR DATA FOR ECONOMIC ACTIVITIES ARE THROUGH TO 2014, WHILE THE BPS DATA FOR GDP GROWTH ARE THROUGH TO 2015.
SOURCEBEA, CEIC, AND IMF (CPIS) DATA, WITH AMCHAM INDONESIA STAFF CALCULATIONS
G D P G R OW T H
E CON O M IC A CT I V ITI ES G R OW T H
within the range of 8.8 to 10.1 percent.5
The average annual growth rate of the nominal value of economic activities is also compared with Indonesia’s annual average GDP growth over the same period (Figure E2). The compound annual growth rate (CAGR) for total economic activities between the two countries is 8.0 percent in the period 2010-15, while the CAGR of Indonesia’s GDP over the same period is
5.5 percent.
When seen as a timeline from 2010 to 2014 (Figure E3), it would appear that, while there was a decline in 2011-12, Indonesia-US economic activities are growing robustly, while Indonesian GDP remains below expectations. However, given their relative size, Indonesia-US economic activities alone can only have a limited impact on supporting overall Indonesian GDP growth: a 10 percent increase in the size of the economic relationship will only increase Indonesia’s GDP by 1 percent.
Indonesia-US economic activities are
[image:11.595.75.565.221.780.2]Components of the Big Number
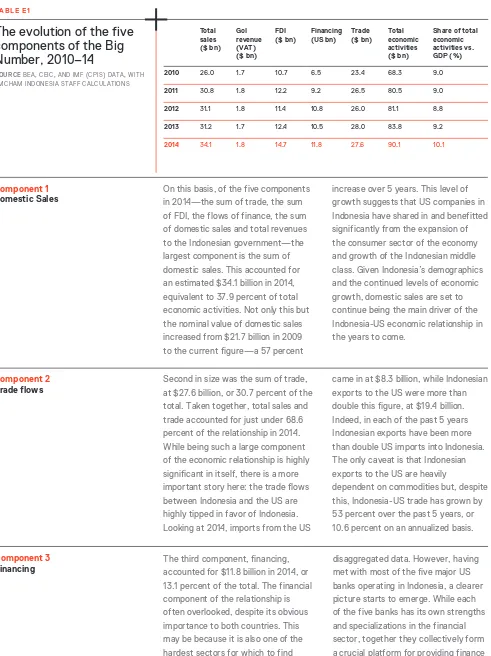
It is useful to look in more detail into how the five components of the $90.1 billion number compare. However, we should note that by selecting 2014 as our base year we have had to use estimates for two of the five
components, namely domestic sales and the total government revenue in Indonesia. These two figures are extrapolated from the data available from 2009 to 2013.
The evolution of the five
components of the Big
Number, 2010–14
SOURCE BEA, CEIC, AND IMF (CPIS) DATA, WITH AMCHAM INDONESIA STAFF CALCULATIONS
T ABLE E 1
Total sales ($ bn) GoI revenue (VAT) ($ bn) FDI ($ bn) Financing (US bn) Trade ($ bn) Total economic activities ($ bn)
Share of total economic activities vs. GDP (%)
2010 26.0 1.7 10.7 6.5 23.4 68.3 9.0
2011 30.8 1.8 12.2 9.2 26.5 80.5 9.0
2012 31.1 1.8 11.4 10.8 26.0 81.1 8.8
2013 31.2 1.7 12.4 10.5 28.0 83.8 9.2
2014 34.1 1.8 14.7 11.8 27.6 90.1 10.1
Component 1 Domestic Sales Component 2 Trade flows Component 3 Financing
On this basis, of the five components in 2014—the sum of trade, the sum of FDI, the flows of finance, the sum of domestic sales and total revenues to the Indonesian government—the largest component is the sum of domestic sales. This accounted for an estimated $34.1 billion in 2014, equivalent to 37.9 percent of total economic activities. Not only this but the nominal value of domestic sales increased from $21.7 billion in 2009 to the current figure—a 57 percent
increase over 5 years. This level of growth suggests that US companies in Indonesia have shared in and benefitted significantly from the expansion of the consumer sector of the economy and growth of the Indonesian middle class. Given Indonesia’s demographics and the continued levels of economic growth, domestic sales are set to continue being the main driver of the Indonesia-US economic relationship in the years to come.
Second in size was the sum of trade, at $27.6 billion, or 30.7 percent of the total. Taken together, total sales and trade accounted for just under 68.6 percent of the relationship in 2014. While being such a large component of the economic relationship is highly significant in itself, there is a more important story here: the trade flows between Indonesia and the US are highly tipped in favor of Indonesia. Looking at 2014, imports from the US
came in at $8.3 billion, while Indonesian exports to the US were more than double this figure, at $19.4 billion. Indeed, in each of the past 5 years Indonesian exports have been more than double US imports into Indonesia. The only caveat is that Indonesian exports to the US are heavily
dependent on commodities but, despite this, Indonesia-US trade has grown by 53 percent over the past 5 years, or 10.6 percent on an annualized basis. The third component, financing,
accounted for $11.8 billion in 2014, or 13.1 percent of the total. The financial component of the relationship is often overlooked, despite its obvious importance to both countries. This may be because it is also one of the hardest sectors for which to find
[image:12.595.36.527.119.775.2]Component 4
FDI
to Indonesia, for instance through US dollar sovereign bonds, quasi-sovereign bonds (to state-owned enterprises) and to the private sector. Looking at the past 2 years, US banks have been involved in roughly 60 to 75 percent of all US dollar bond issuances in Indonesia, which have raised about $25 billion in bond financing from 2014 to May 2016. In terms of the
US dollar debt market, growth was about 86 percent in the period 2019-14, or an impressive 17 percent on an annualized basis. Meanwhile, US banks in Indonesia also constitute some of the largest traders of equities in the domestic stock market, together with being major players in mergers and acquisitions (M&A).
The fourth component is FDI, at $14.7 billion, or 16.3 percent of the relationship in 2014. FDI is the figure most often cited as a measure of the economic relationship, but it only ranks fourth out of our five major components. While it is undoubtedly true that investment policy reform often drives the broader reform agenda, other components actually contribute more to the total
Indonesia-US economic relationship. FDI can also be volatile, proof of which can be seen in the fact that it is the only one of our components that declined due to the global economic crisis, from 2011 to 2012. That decline notwithstanding, total FDI (including Indonesian FDI in the US) increased by 47 percent during the period, from $10 billion in 2009 to $14.7 billion in 2014, an average annualized increase of 9.4 percent.
Component 5
Government Revenues
The smallest contribution to the relationship is Indonesian government revenues, which accounted for an estimated $1.8 billion, or just 2 percent of the total. Unfortunately, the unavailability of data means that this component is greatly understated, as we only have complete data on value-added tax (PPN), but not on non-tax revenue (NTR), including royalties on raw materials and excise on tobacco. However, even just taking VAT revenue into account, US companies still contributed 13 percent of total government tax revenue of $13.24 billion in 2014.
While the smallest of our five components, it is nonetheless vital to the government of Indonesia. It is worth remembering that for many years US companies also have been Indonesia’s largest contributor to government revenue, although they are not necessarily the largest companies operating in Indonesia. For example, in recent years PT. Freeport Indonesia was the largest contributor to government revenue until the collapse in commodities prices and the implementation of the export ban on mineral ore, after which
its dominant position has been taken over by PT. HM Sampoerna, another US company. (Note, both companies owe their prominent position not to VAT, but more to NTR in the form of royalties and excise, respectively, in addition to regular corporate income tax.) Other major contributors to NTR government revenues are in the oil and gas sector, including Chevron, ExxonMobil and ConocoPhillips. It is worth noting that despite the current low oil price environment, which has caused government revenue to plummet by around 43 percent,6 the
oil and gas sector still plays a vital role in supporting regional development, including through the development of the oil and gas support services sector, which provides important multiplier effects. Furthermore, Indonesia’s production share from oil and gas is generally regarded as the second highest in the world. From the US company figures that we do have access to, it is safe to say that NTR to the government was at the very least around $4.7 billion in 2014. This would boost our sectoral Big Number for government revenue from US companies by 3.6 times.
It is worth remembering that for many
years US companies have been Indonesia’s
largest contributor to government revenue,
although they are not necessarily the
largest companies operating in Indonesia.
6 2016 Oil and Gas Production in Indonesia (BOEPD): Chevron 251,000; ConocoPhillips: 241,000; and ExxonMobil: 170,000 (Source: WoodMackenzie: SKK Migas).
By way of comparison, looking back at 2009, at the start of the global financial crisis, the shares of the five components were relatively similar to 2014. Total economic activities in 2009 were valued at just shy of $57.4 billion, implying a 56.8 percent increase in the period 2009 to 2014. The main exception is that the share of financial flows was significantly lower, at just 10.96 percent compared
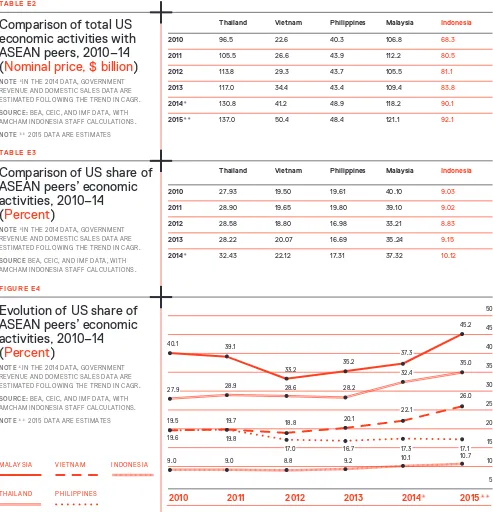
Compared to the Region
We are not limited to looking only at Indonesia in terms of economic activities with the US. We can also look at the value of the economic relationship between the US and other countries in ASEAN, for instance. Here, using the same formula and different sources of data, we can see Indonesia’s nominal values relative to the size of the other ASEAN economies (Table E2).
Table E3 then shows these nominal values converted into percentage shares of total US economic activities against GDP for each respective year.
This leads on to Figure E4, where we can see the different shares of GDP of the US economic relationship with different ASEAN countries, and observe how these have evolved over time. In comparison to Indonesia, we take as examples Malaysia, Thailand, Vietnam and the Philippines.
Indonesia’s position in terms of the value of its total economic activities with the US compared with its ASEAN peers is probably about where it should be—not too high and not too low, and also relatively stable over the five-year period. In our five-country sample, the nominal value of the economic relationship between Indonesia and the
Comparison of total US
economic activities with
ASEAN peers, 2010–14
(
Nominal price, $ billion
)
NOTE *IN THE 2014 DATA, GOVERNMENT REVENUE AND DOMESTIC SALES DATA ARE ESTIMATED FOLLOWING THE TREND IN CAGR. SOURCE: BEA, CEIC, AND IMF DATA, WITH AMCHAM INDONESIA STAFF CALCULATIONS. NOTE ** 2015 DATA ARE ESTIMATES
Comparison of US share of
ASEAN peers’ economic
activities, 2010–14
(
Percent
)
NOTE *IN THE 2014 DATA, GOVERNMENT REVENUE AND DOMESTIC SALES DATA ARE ESTIMATED FOLLOWING THE TREND IN CAGR. SOURCE BEA, CEIC, AND IMF DATA, WITH AMCHAM INDONESIA STAFF CALCULATIONS.
Evolution of US share of
ASEAN peers’ economic
activities, 2010–14
(
Percent
)
NOTE *IN THE 2014 DATA, GOVERNMENT REVENUE AND DOMESTIC SALES DATA ARE ESTIMATED FOLLOWING THE TREND IN CAGR. SOURCE: BEA, CEIC, AND IMF DATA, WITH AMCHAM INDONESIA STAFF CALCULATIONS. NOTE ** 2015 DATA ARE ESTIMATES
TABL E E2
TABL E E3
FIGU RE E 4
Thailand Vietnam Philippines Malaysia Indonesia
2010 96.5 22.6 40.3 106.8 68.3
2011 105.5 26.6 43.9 112.2 80.5
2012 113.8 29.3 43.7 105.5 81.1
2013 117.0 34.4 43.4 109.4 83.8
2014* 130.8 41.2 48.9 118.2 90.1
2015** 137.0 50.4 48.4 121.1 92.1
Thailand Vietnam Philippines Malaysia Indonesia
2010 27.93 19.50 19.61 40.10 9.03
2011 28.90 19.65 19.80 39.10 9.02
2012 28.58 18.80 16.98 33.21 8.83
2013 28.22 20.07 16.69 35.24 9.15
2014* 32.43 22.12 17.31 37.32 10.12
2010 2011 2012 2013 2014* 2015**
50 45 40 35 30 25 20 15 10 5
MAL AY SIA
TH AIL AN D
V IETN AM
PH I LI P P IN ES
I NDONESI A
40.1
27.9
19.5 19.6
9.0 9.0 8.8 9.2 10.1 10.7 19.8
17.0 16.7 17.3 17.1 19.7 18.8 20.1
28.9 28.6 28.2
[image:15.595.72.565.279.791.2]US lies sandwiched between Malaysia and Thailand with the highest values, and the Philippines and Vietnam, with the lowest. While it is true to say that growing the size of the economy is what is most important here, the fact that in some countries the value of their economic activities with the US is growing faster than others may indicate that these countries are more open and attractive to US economic activities.
If this growth is indeed occurring, while the share of the value of economic activities in GDP remains more or less constant, it infers that all economic relationships with a country are growing together and mutually benefiting each other. This, after all, is the ultimate goal.
03
Indonesia’s Current
Economic Position
& Outlook
Recent Economic Trends in Indonesia
The Indonesian economy has been struggling to maintain growth since 2012 in the face of lower commodity prices and slower global growth. Despite the recent slowdown, however, the country’s per capita GDP has grown steadily from $560 in 2000 to $3,630 in 2014. With Indonesia’s export revenues contracting throughout 2015, GDP growth slipped to 4.8 percent. While still respectable, especially for a commodities exporter, Indonesia will struggle to absorb new entrants into the country’s labor force at this rate of growth. Going forward, Indonesia will need to adapt to a less favorable global environment and focus even more on facilitating investment and reducing the costs of doing business.
The fiscal stimulus provided by the government, aided by additional funds coming from the shift in public expenditure away from wasteful fuel subsidies, will undoubtedly help to support economic expansion. There was, for instance, a threefold increase in infrastructure spending in the first quarter of 2016, together with a 10-fold spike in physical construction for the same quarter. However, government activity alone will not raise growth above 5 percent in 2016. The only way to ensure that growth rebounds will be through greater private sector activity, especially through private sector investment. This is where US companies can play an important role—especially in generating new jobs.
Driven mainly by the increase in public spending at the end of the year,
growth did pick up in the final quarter of 2015 to 5 percent year-on-year, after three previous quarters of 4.7 percent growth. However, at the same time consumption remained moderate, while exports and imports both continued to decline, highlighting the challenges faced by the private sector. Worryingly, the biggest contributor to the overall decline in the trade balance came from a contraction in manufacturing exports, which fell by 13.4 percent year-on-year.
Weakening FDI and Stemming the Outflows of Capital
Indonesia also experienced a significant decline in its financial account in 2015, as capital fled emerging markets generally. Total 2015 capital flows to Indonesia declined to just $17.1 billion in 2015, down from $45 billion in 2014. The outflows of capital from Indonesia were only stemmed by foreign
investment into Indonesian government bonds toward the end of 2015, helping to stabilize the rupiah at 4.4 percent in February. Most of these investments flowed through US investment banks in Indonesia. A stronger rupiah and lower inflation helped Bank Indonesia (BI) to finally start easing its monetary policy in January with two consecutive cuts in interest rates of 25 basis points each. However, as we have seen in the past few months, BI will need to remain vigilant amid continuing global financial market volatility and the possibility of rising US interest rates putting pressure on the rupiah.
contingent on private sector spending picking up in the second half of the year. Beyond 2016, the economic recovery in Indonesia will ultimately rely on policies designed to attract far greater private investment and diversify the economy away from reliance on the extractive industries. The first welcome signs of this new approach were seen in September 2015, with the unveiling of the first of a continuing series of economic reform packages.
The Economic Reform Packages
The government’s series of economic reform packages—12 packages at the time of writing—is a step in the right direction for the private sector. We discuss the details of the individual packages in the main report and how they address some of the concerns of US companies. Looking at the details, however, it seems as though the government is addressing specific problems that it sees as holding up investment. While the packages are certainly positive, it is not yet clear that they add up to a clear reform strategy, which is really what is needed to attract enough investment to boost
growth significantly. One of the reform packages does address the Negative Investment List (DNI), allowing more foreign investment into the creative economy and other sectors. However, the DNI still restricts to varying degrees some 600 sectors that represent about 70 percent of the economy.
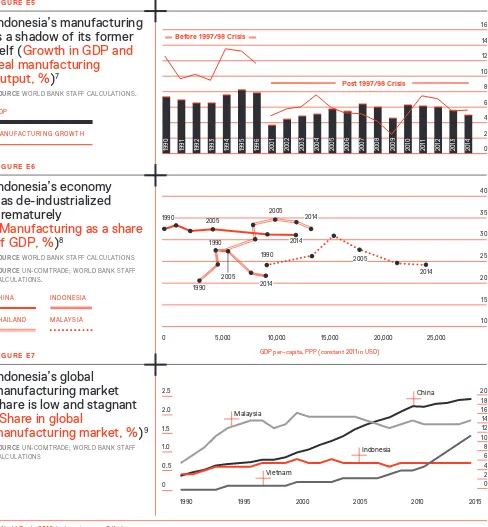
Shifting from Commodities to Manufacturing
Both Indonesian and US private sector companies need to move away from an over-reliance on Indonesian commodities in the wake of one of the greatest commodity booms ever seen, from 2003 to 2012. One side-effect of the commodities boom was that it rendered investing in the Indonesian manufacturing sector less attractive to investors when easy returns could be made in commodities with little or no valued-added. Given that manufacturing tends to be highly labor-intensive and the extractive industries just the opposite, it should come as little surprise that while Indonesia comprises half of ASEAN’s total labor force, it contributes only 16 percent of ASEAN’s manufacturing
Both Indonesian and US private sector
companies need to move away from an
exports. In fact, looking more closely at data from the World Bank, Indonesia underwent a process of “premature deindustrialization” from about 2002 onward, as commodities overtook manufacturing as the largest exports from 2005 onward.
This de-industrialization is seen to be premature because it is occurring far too early in the cycle of economic development compared with other countries in the region (Figure E6).
With the focus of investment in Indonesia leaning heavily toward commodities in recent years, countries in the region with fewer natural resources have been busy expanding their shares of the global manufacturing market. As illustrated in Figure E7, this has led to stagnation in Indonesia’s market share of global manufacturing, while countries such as China and Malaysia have soared, and Vietnam’s manufacturing share has expanded rapidly since 2010, overtaking and surging ahead of Indonesia.
Indonesia’s manufacturing
is a shadow of its former
self (
Growth in GDP and
real manufacturing
output, %
)
7SOURCE WORLD BANK STAFF CALCULATIONS.
Indonesia’s economy
has de-industrialized
prematurely
(
Manufacturing as a share
of GDP, %
)
8SOURCE WORLD BANK STAFF CALCULATIONS SOURCE UN-COMTRADE; WORLD BANK STAFF CALCULATIONS.
Indonesia’s global
manufacturing market
share is low and stagnant
(
Share in global
manufacturing market, %
)
9SOURCE UN-COMTRADE; WORLD BANK STAFF CALCULATIONS
FIGU RE E 5
FIGU RE E 6
FIGU RE E 7
16 14 12 10 8 6 4 2 0 40 35 30 25 20 15 10 20 18 16 14 12 10 8 6 4 2 0 2.5 2.0 1.5 1.0 0.5 0 0 5,000 1990 Malaysia China Indonesia Vietnam
1995 2000 2005 2010 2015 10,000 15,000 20,000 25,000
1990 1991 1992 1993 1994 1995 1996 2001 2002 2003 2004 2005 2006 2007 2008 2009 2010 2011 2012 2013 2014
Post 1997/98 Crisis
GDP per–capita, PPP (constant 2011 in USD)
Before 1997/98 Crisis
GD P
MA NU F A CTU R ING G R OW T H
7 World Bank, 2016. Indonesian Economic Quarterly, June 2016. Resilience through reforms.
8 Ibid.
9 Ibid.
CHIN A
THA I L A ND
I N D O N ESI A
M AL A Y S IA
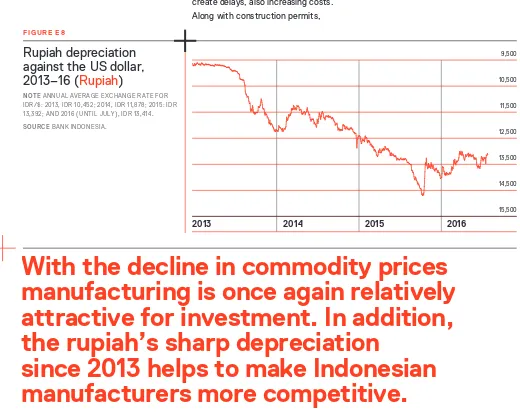
[image:18.595.37.525.234.761.2]Several issues are holding Indonesian manufacturing back. First, while Indonesia has the lowest wage costs in US dollar terms in the region, this advantage is erased by low labor productivity. In 2014, unit labor costs were higher in Indonesia than in the Philippines and Vietnam, as a result of low productivity. Malaysia’s unit labor costs are only slightly higher than Indonesia’s, despite the fact that Malaysian workers’ wages are 7-8 times higher. Second, efficient logistics are crucial for supplying the domestic market and competing internationally. Indonesia’s logistics costs account for 24 percent of GDP, compared with Thailand at only 16 percent. This is equivalent to Indonesia wasting $70 billion a year on inefficient and costly logistics. The inefficiencies and unreliability of logistics in Indonesia force companies to stock higher inventory, increasing costs. Third, regulatory procedures, licensing and permitting are overly complex and create delays, also increasing costs. Along with construction permits,
paying taxes and enforcing contracts in Indonesia are among the most cumbersome in the world (World Bank, 2016).
With the decline in commodity prices manufacturing is once again relatively attractive for investment. In addition, the rupiah’s sharp depreciation since 2013 should now help to make Indonesian manufacturers more competitive (Figure E8).
The recent government reform packages appear to herald a new and fundamental shift toward reducing regulatory burdens and improving the business climate. The government has even expressed its interest in joining the Trans-Pacific Partnership (TPP). In this new and more positive outward-looking environment, US companies stand ready to contribute to boosting the manufacturing sector and helping Indonesia to regain its former prowess as a regional manufacturing powerhouse.
With the decline in commodity prices
manufacturing is once again relatively
attractive for investment. In addition,
the rupiah’s sharp depreciation
since 2013 helps to make Indonesian
manufacturers more competitive.
Rupiah depreciation
against the US dollar,
2013–16 (
Rupiah
)
NOTE ANNUAL AVERAGE EXCHANGE RATE FOR IDR/$: 2013, IDR 10,452; 2014, IDR 11,878; 2015: IDR 13,392; AND 2016 (UNTIL JULY), IDR 13,414. SOURCE BANK INDONESIA.
FIGUR E E8
9,500 10,500 11,500 12,500 13,500 14,500 15,500
[image:19.595.48.568.382.796.2]04
Looking Beyond
Our 2014 Baseline
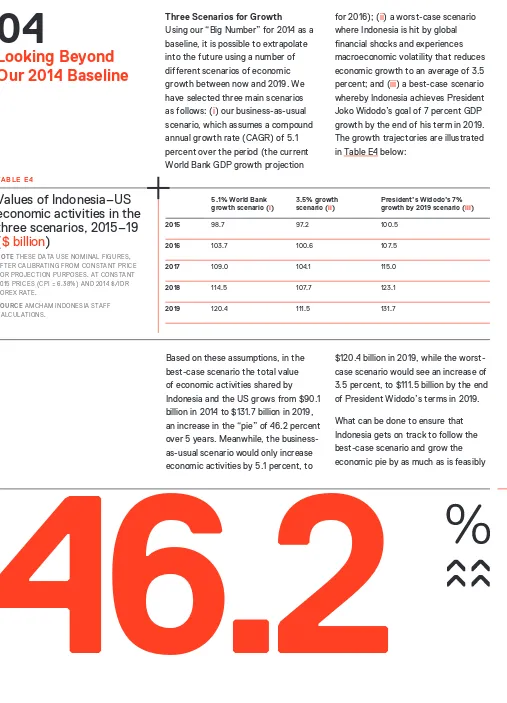
Three Scenarios for Growth
Using our “Big Number” for 2014 as a baseline, it is possible to extrapolate into the future using a number of different scenarios of economic growth between now and 2019. We have selected three main scenarios as follows: (i) our business-as-usual scenario, which assumes a compound annual growth rate (CAGR) of 5.1 percent over the period (the current World Bank GDP growth projection
for 2016); (ii) a worst-case scenario where Indonesia is hit by global financial shocks and experiences macroeconomic volatility that reduces economic growth to an average of 3.5 percent; and (iii) a best-case scenario whereby Indonesia achieves President Joko Widodo’s goal of 7 percent GDP growth by the end of his term in 2019. The growth trajectories are illustrated in Table E4 below:
46.2
Values of Indonesia–US
economic activities in the
three scenarios, 2015–19
(
$ billion
)
NOTE THESE DATA USE NOMINAL FIGURES, AFTER CALIBRATING FROM CONSTANT PRICE FOR PROJECTION PURPOSES. AT CONSTANT 2015 PRICES (CPI = 6.38%) AND 2014 $/IDR FOREX RATE.
SOURCE AMCHAM INDONESIA STAFF CALCULATIONS.
T AB LE E4
5.1% World Bank growth scenario (i)
3.5% growth scenario (ii)
President’s Widodo’s 7% growth by 2019 scenario (iii)
2015 98.7 97.2 100.5
2016 103.7 100.6 107.5
2017 109.0 104.1 115.0
2018 114.5 107.7 123.1
2019 120.4 111.5 131.7
Based on these assumptions, in the best-case scenario the total value of economic activities shared by Indonesia and the US grows from $90.1 billion in 2014 to $131.7 billion in 2019, an increase in the “pie” of 46.2 percent over 5 years. Meanwhile, the business-as-usual scenario would only increase economic activities by 5.1 percent, to
$120.4 billion in 2019, while the worst-case scenario would see an increase of 3.5 percent, to $111.5 billion by the end of President Widodo’s terms in 2019.
What can be done to ensure that Indonesia gets on track to follow the best-case scenario and grow the economic pie by as much as is feasibly
[image:20.595.34.541.17.720.2]AmCham’s 2016
Investment Sentiment
Survey
BOX E 1
In order to better understand the current investment sentiment of US companies in Indonesia and the current characteristics of US companies already operating here, AmCham Indonesia conducted a combined investment survey and data questionnaire among large companies in May and June of this year. The survey provides the following insights.
Company Perceptions
First of all, we asked US companies whether they had seen an
improvement in the investment climate over the past two years (i.e., since the new Widodo administration took office). In response, 87 percent of companies felt that there had been “some improvement.” Meanwhile, when asked whether the 12 economic reform packages had had any impact on the business environment, fully 100 percent replied that they perceived “some impact.” This figure drops considerably when the same companies were asked if the packages had had any tangible impact of their own businesses. Here, only 25 percent felt there was “some impact,” while 75 percent felt there had been “no impact,” or that it was still “too early to say.”
We then asked the companies about those areas they felt needed improvement in order for their businesses to prosper, asking them
to rank five areas in terms of importance. The most important area of concern was Legal Certainty, with 50 percent of companies ranking this the highest priority. This was followed by Regulatory Reform, ranked first by 37 percent of companies, followed by the need for Policy Reform. This was followed by Infrastructure Improvements. The fifth most important area was seen as Improvements in Human Resources.
Lastly, we asked the companies if they felt more positive today than they did two years ago about doing business. Here we found that while 50 percent of companies were “more positive” now, the other 50 percent were either “less positive” or “not sure.” The structural, procedural and behavioral changes underway need to be continuously encouraged to bring about more positive reforms.
The Characteristics of US Companies in Indonesia In terms of the characteristics of the US companies in our survey, the average amount of total FDI invested in Indonesia was about $3 billion. Average revenue in 2015 was about $1.9 billion, with average total salaries of $83 million. Total salaries and employee compensation paid by US companies in 2015 were about $344 million.
The figures for government revenue paid by the companies in our survey are also interesting, as they shed some light on the degree to which the government revenue component in our Big Number is understated. The average payments for total VAT (PPN), total indirect taxes (royalties and excise) and corporate income tax by US companies in 2015 were $171.3 million, $2.0 billion and $105 million, respectively. Meanwhile, the totals were $685.2 million for VAT, $4.0 billion for NTR, and $315.8 million for corporate income tax. It is interesting to note that the revenue from NTR is almost six times that from VAT. Bearing in mind that our Big Number uses data built on only VAT revenue, this means that our Big Number is understated by at least $4.3 billion, if we include both NTR and corporate income tax.
Looking at investment intentions going forward, on average the US companies in our survey had plans to invest $334 million over the next 5 years. In terms of employment, the US companies in our survey employed about 112,000 workers in 2015, while fewer than 100 employees in these companies were expatriates—less than 0.1 percent. Therefore, US companies operating in Indonesia can be seen to be major employers of Indonesians,
not expatriates. possible? This assumes that the
share of the Indonesia-US economic relationship to overall Indonesian GDP remains more or less constant at 9.5 percent from 2014 to 2019, while the nominal size of the relationship grows to $ 131.7 billion by 2019.
05
Cross-Sectoral
Analysis & Ranking
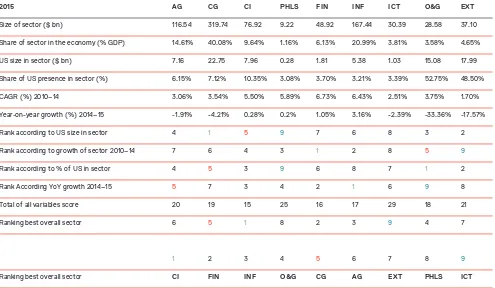
In the main report that accompanies this Executive Summary, we analyze the nature, characteristics and challenges of nine sectors of the Indonesian economy. These nine sectors comprise: agriculture; consumer goods; creative industries; extractive (mining and quarrying); finance; ICT; infrastructure; oil and
gas; and pharmaceuticals, healthcare and life sciences.
In order to analyze the nature of the involvement of US companies across our nine sectors, and the relative prospects for the sectors, we constructed a methodology to rank sectors according to four criteria. These four criteria are:
10 For each of these criteria we ranked each sector from 1 to 9 and then added their rankings to give sector scores of 4-36. Then dividing them by 4 gives equal weighting to each of our four criteria. The result is a sectoral ranking from 1 to 9, where 1 is the sector with the greatest potential for growth and investment for US companies and 9 is the least. By including all four factors in this way we try to relatively accurately reflect, albeit subjectively, what is happening in the overall Indonesian economy.
These factors were chosen such that we could compare the potential for investment and growth in the various sectors in which US companies have investments. The absolute size of the sector and the portion of the sector that is occupied by US companies, gives us an indication of the relative importance and opportunities for further investments in the sector. The CAGR (2010-14) gives historical perspective on sector growth, while the 2014-15 growth rate gives us information about the current direction and potential of the sector. The growth rates differ from those given
by the Indonesian government, as they are based upon rupiah converted to US dollar values, thus reflecting the continued devaluation of the rupiah over the past 5 years. Ultimately, this is the value that US investors use in making their investment decisions and the return on the US dollar invested. Cross-sectoral comparisons are difficult at best and our ranking system does not take the policy and regulatory environment into account, which is highly subjective, but would probably also change the rankings of the sectors.
1
2
3
4
Total US economic activities of US
companies in each sector;
Overall share of US companies in each sector as
a fraction of the total size of each sector;
Compound annual growth rate (CAGR) of each
sector in 2010-14; and
Sector rankings and best overall sector for growth and investment
TABL E E5
2015 AG CG CI PHLS FIN INF ICT O&G EXT
Size of sector ($ bn) 116.54 319.74 76.92 9.22 48.92 167.44 30.39 28.58 37.10
Share of sector in the economy (% GDP) 14.61% 40.08% 9.64% 1.16% 6.13% 20.99% 3.81% 3.58% 4.65%
US size in sector ($ bn) 7.16 22.75 7.96 0.28 1.81 5.38 1.03 15.08 17.99
Share of US presence in sector (%) 6.15% 7.12% 10.35% 3.08% 3.70% 3.21% 3.39% 52.75% 48.50%
CAGR (%) 2010–14 3.06% 3.54% 5.50% 5.89% 6.73% 6.43% 2.51% 3.75% 1.70%
Year-on-year growth (%) 2014–15 -1.91% -4.21% 0.28% 0.2% 1.05% 3.16% -2.39% -33.36% -17.57%
Rank according to US size in sector 4 1 5 9 7 6 8 3 2
Rank according to growth of sector 2010–14 7 6 4 3 1 2 8 5 9
Rank according to % of US in sector 4 5 3 9 6 8 7 1 2
Rank According YoY growth 2014–15 5 7 3 4 2 1 6 9 8
Total of all variables score 20 19 15 25 16 17 29 18 21
Ranking best overall sector 6 5 1 8 2 3 9 4 7
1 2 3 4 5 6 7 8 9
Ranking best overall sector CI FIN INF O&G CG AG EXT PHLS ICT
Ranking Based on US Companies’ Economic Activities in the Sector
This ranking simply states which sector has the largest amount of US company economic activity. The largest sector on this basis is the consumer goods sector, followed by the extractive sector, and oil and gas. This makes sense, as consumer goods in our definition is a vast catch-all sector of the economy, while extractive, and oil and gas, are also major sectors, regardless of the recent downturn in commodities prices. Conversely, the
smallest sectors are pharmaceuticals, healthcare and life sciences, followed by ICT and finally by finance. Despite the importance of financial flows as a component of our Big Number, the relative size of the finance sector reflects actual booked revenue and taxes, as opposed to the huge size of financial transactions supported by the sector.
Ranking Based on the Share of the US Presence in the Sector
This ranking reflects the share of a sector filled by US companies. The percentage share number can also be viewed as a saturation number, indicating those sectors that have already reached a mature stage where US companies have little further scope for expansion. Not surprisingly, the ranking shows that the oil and gas, and extractive sectors both have the largest respective market shares. The creative industries sector comes in at a surprising third position, perhaps reflecting the relatively new nature
[image:23.595.72.567.496.784.2]Ranking Based on the Growth Rate of the Sector
Ranking Based on the Year–on –Year Growth Rate 2014-15
The calculated 2010-14 CAGR for the sectors helps to complete the overall picture by ranking sectors according to how well they were doing in the recent past. Historically, the fastest growing sectors are finance, infrastructure, healthcare and life sciences, and the
creative industries. It comes as no surprise that the worst performing sector is oil and gas given the decline in commodity prices, investment and production.
The latest annual growth rate for 2014-15 reflects the current status of each sector. The growth rate has been impacted by the depreciation of the rupiah over the period, which fell by 11 percent during this period. During 2015, infrastructure and finance
grew the fastest, with agriculture and consumer goods contracting, while the extractive and oil and gas sectors plummeted with -17.6 percent and -33.4 percent year-on-year declines.
During 2015, infrastructure
and finance grew the
fastest, with agriculture
and consumer goods
contracting, while the
extractive and oil and gas
sectors plummeted with
-17.6 percent and -33.4
percent year-on-year
1st
2nd
The creative industries sector is the newest of the sectors that we cover, exhibiting strong historical and current growth. It also is third best in terms of US company sector penetration. Although the creative economy did not rank top for any of the four factors, and faces challenges with excessive
regulatory oversight together with inconsistent enforcement measures impacting the exploitation and distribution of creative content, a strong combination of market penetration and growth indicates that this sector has good potential.
The nature of the finance sector is that companies take only a small amount of its huge overall turnover. This tends to understate the impact of the sector on overall economic activity, despite its obvious importance and overall size, as shown by the relative size of financial flows as a component of our Big Number. While US companies play a vital role in this sector and the overall economy, there are relatively few US players operating in Indonesia. With a CAGR of 6.73 percent over the past 5 years, growth in the sector is
the best of all sectors. Given the US presence of just 3.7 percent, there should be significant scope for further US expansion in the sector, especially as the insurance market starts to open up and gains traction from the growing middle class. It may be difficult for US banks not already present in Indonesia to penetrate the market, given the regulatory environment. However, the large US banks already here are well positioned to benefit from future robust economic growth.
Below are some thoughts on each of the sectors based upon their overall ranking from
the most promising for growth and investment to the least promising.
Creative Industries Sector
4th
Being the largest sector in terms of US company presence, at 52.8 percent, and the third-largest sector in terms of US company economic activities, the oil and gas sector should be a good one for US companies. However, this has to be tempered by negative growth in the sector—it experienced the largest contraction in 2015. As a result, we rank the oil and gas sector fourth. This is a sector that has also reached maturity for US companies, and is likely to see a decline in the coming years as the impact of low commodity prices forces companies to scale back their operations. As a result, we are likely to see the ranking of the oil and
gas sector decline in future years. However, this decline is not entirely due to falling prices; severe regulatory challenges were already in place for years before the price decline, discouraging investment. Collective efforts are required to correct
persistent regulatory problems in order to improve the investment climate and reverse the declines. Given the size of the sector for Indonesia, further declines, if they occur, will have a large negative impact on total US company activities in Indonesia.
Oil & Gas Sector
3rd
The infrastructure sector exhibits strong historical growth and the best recent growth rate of all of the sectors. Given the government’s priority on infrastructure, and the constraints on meeting the huge financial
requirements needed, this should make the sector attractive to US companies
going forward, although competition will be fierce from major Asian and European infrastructure companies. The potential in the sector is so large that US companies should be able to make inroads in the coming years.
6th
5th
The agriculture sector appears to be stable for US companies, with sizeable economic activities, together with a US presence slightly above the median. The growth rate, at a CAGR of 3.06 percent in 2010-14, is below the national GDP growth rate of 5.1 percent, which is probably
largely due to the depreciation of the rupiah. At 6.2 percent presence in the sector, there is still ample scope for US companies to expand their penetration should government policies encourage higher levels of investment in agriculture.
This is the largest sector in the Indonesian economy and it provides the largest amount of US company economic activities. In terms of our ranking, the consumer goods sector comes in fifth overall, primarily due to relatively slow growth historically and negative growth in 2015. Overall, US companies are already well positioned in the sector and making strong revenues, but at the same time the sector has been hurt by slow growth and rupiah depreciation. If the Indonesian economy gradually recovers from the 2015 slowdown, growth in
the sector should start to reverse its contraction of -4.21 percent in 2015, and move back toward its historical CAGR of 5.5 percent in 2010-14. It is likely therefore that going forward we can expect the consumer goods sector to not only consolidate its primary position for US companies in Indonesia, but also to attract further interest from US companies that have yet to start operations in Indonesia.
7th
The extractive sector comes in seventh in our ranking, despite being second in US sectoral activity, at $18 billion, and market penetration at 48.5 percent. However, slow growth in the sector, at just 1.7 percent annually in 2010-14, and a severe contraction of -17.6 percent in 2015, coupled with severe regulatory problems over the past few years, indicates that the extractive sector has reached maturity and offers
little future potential for expansion. Indeed, if progress cannot be made to resolve current regulatory issues, then the sector’s ranking can be expected to decline further as the presence of US companies wanes and total US company economic activity declines as a result.
Extractive Sector
8th
The pharmaceuticals, healthcare and life sciences sector came in second to bottom of all of the sectors due to the small market penetration by US companies, at just 3.1 percent, as well as low US company economic activities, at only $265.5 million in 2015. The relatively strong growth rate of the sector, with a CAGR of
5.89 percent in 2010-14, indicates that there is considerable room for further penetration by US companies. However, future expansion may be constrained by implementing regulations for the 2014 Halal Law, which is set to have a major impact on pharmaceuticals.
9th
Another relatively new industry, the ICT sector is at the bottom of the rankings due to the relatively small US company presence in the sector, which is dominated by the large domestic telecommunications companies, as well as slow historical growth and a contraction in 2015. The presence of US companies in the sector is also
low, at just 3.4 percent, limiting the scope for total US company economic activities. Overall, this indicates good growth potential, not only for the sector but also for US companies, as the non-telecommunications portions of the sector develop.
ICT
06
Getting to a
Best–Case
Scenario
What Is Holding Indonesia Back?
It can be tempting at times to wonder why optimal progress toward growth, prosperity and equality seems to be so hard to achieve in Indonesia. Indonesia is well-endowed in many ways, yet it has struggled to unleash rapid economic progress and social empowerment—at least since the start of the Reformasi era. This may have its roots in the command-and-control economy of the Soeharto era that was established in the wake of economic collapse in the 1960s. This focus on control is still alive in today’s government bureaucracy.
This has become further complicated in recent years by an apparent yearning to become self-sufficient without relying on international trade or investment. Despite the welcome efforts made by President Widodo to encourage investment, there is a strong perception that many Indonesians—both in the elite and the broader population—see foreign direct investment (FDI) as something of an embarrassment. When times are bad it may be tolerated, but when times are good then maybe it could be done away with completely. Even the Investment Coordinating Board (BKPM), which has been tasked in recent years with
making international investment easier, was originally established as part of the broader command-and-control system to limit FDI, as opposed to enabling it. In light of this, its new role of investment facilitator has been challenging for BKPM, although it has taken the transition seriously.
Over the course of the five
governments that have come and gone since Reformasi in 1998, Indonesia has become increasingly inward-looking. As a consequence, the space that had previously been created for foreign private sector businesses has narrowed. A sense of complacency was also apparent after Indonesia avoided the direct impact of the global financial crisis in 2009-11, protected as it was by the commodities boom. Bureaucrats could claim that restrictive policies were having the desired effect, but in reality the collapse in commodity prices and the economic slowdown in China left Indonesia in the doldrums.
allowed other more open economies in the region, such as Vietnam, India and the Philippines, to power ahead of Indonesia. While some senior technocrats make the case for greater participation in the global economy— an idea backed by President Widodo with orders to streamline regulations— the reality is that many career
bureaucrats have been resisting the directives as they continue to pursue regulatory complexity.
While AmCham Indonesia and the U.S. Chamber of Commerce are mostly focused on issues that directly challenge our members in their respective sectors, we also view this broader context with concern. In the
nine sector chapters of this investment report, we dwell on specifics but we also wish to offer some ideas—inspired by the President’s own rhetoric—for continuing to shift the country away from protectionism and policies that discourage private sector investment. We believe these ideas would help the Indonesian people and that if these shifts take root in the next year or two, it is quite possible to reach President Widodo’s goal of 7 percent GDP growth in 2019. This could also grow the size of the economic relationship between Indonesia and the US to $131.7 billion by that year, a potential 46 percent increase on its 2014 level. That should certainly be a goal worth striving for.
While some senior
technocrats make the case
for greater participation in
the global economy—an
idea backed by President
Widodo with orders to
streamline regulations—the
reality is that many career
Ideas for a 21st Century
Global Economy
In interviews with senior executives of major US companies operating in Indonesia, we have put together a short list of themes that resonate across sectors and that might be useful
in helping Indonesia move toward becoming a truly 21st century global
economy that embraces trade and investment and feels confident enough to become a competitive player in the global economic system.
Achieving a best-case scenario Innovation
We frequently hear that Indonesia must become more innovative. Clearly, in a world that is changing rapidly, in both creative and disruptive ways, Indonesia needs to embrace change if it is to avoid falling behind its peers. In Indonesia, however, (and not only in Indonesia) there are strong forces resisting innovation, as it threatens established controls Not only do controls need to be loosened, but perhaps more importantly a vital ingredient for innovation is the opportunity to fail. Failure is an inseparable part of innovation and many, if not most, initial attempts at innovation result in failure. For innovation to take root across the business environment and society, failure and acceptance of risk must be accepted as part of this process.
Ownership and equity
One facet of the protectionist environment in Indonesia has long been an overemphasis on ownership and equity. Instead of focusing on performance and excellence, artificial limits have been placed on ownership through equity shares. The result is often an uncomfortable mix of “partners” and hesitation among foreign investors who feel uneasy about being limited to holding a minority stake in their businesses. The recent revision of the Negative Investment List (DNI) partially addressed this in a few sectors but huge potential could be unleashed by allowing the best and the most capable investors—regardless of whether they are foreign or local—to prove their worth by lifting restrictions on ownership. As long as companies follow the law, pay their taxes and create employment, generating wealth along the way, ownership percentages should be of secondary concern.
Regulations: Control or enable?
Excessive control can be stifling for innovation and investment. The government bureaucracy seems designed to exert control, often unnecessarily, and this has become a justification for government itself. This is in stark contrast to facilitating an enabling environment in which businesses, both local and foreign, can thrive and prosper. BKPM is a good example of change. It has moved from being an instrument for restricting and controlling investment to becoming a modern government agency focused on enabling business. Following this model, regulations should be seen as enabling tools, not restrictive barriers that may benefit a few to the detriment of the majority.
Incentives
Let business decide
Executives frequently raise concerns about government regulators interfering in what are essentially management and business decisions. We mention above the question of ownership limits as an example, but often just as debilitating are restrictions placed on hiring expatriates, including limiting the age of expatriate workers regardless of their competence. Hiring decisions should be made by companies themselves with the full understanding that employing expatriates is expensive and is often done as a last resort when local talent cannot be found. Frequently, expatriates create jobs and bring much needed revenue into the country. Government should not try to micromanage corporate hiring, and in an enabling environment for business, it would focus instead on monitoring compliance with necessary regulations and imposing sanctions, if needed.
Actions that could transform the economy
Based on the themes we have articulated above, we have come up with four possible actions that could unleash great economic potential if implemented. Some of them would be immensely challenging politically, while others would serve to strength what is already taking place but has yet to be fully optimized.
Abolish the DNI
The Negative Investment List (DNI) is an outdated throwback. It has been humorously refe