Tabel 8
Masukan SPSS
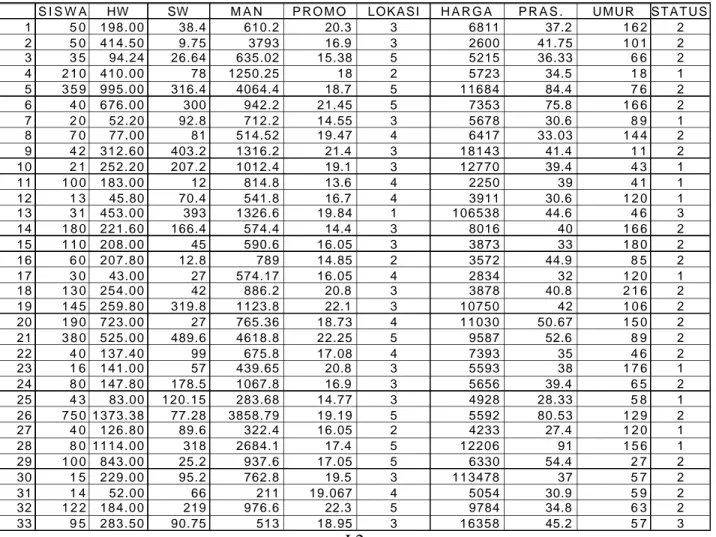
S I S W A HW SW M A N P R O M O L O K A S I H A R G A P R A S . U M U R S T A T U S 1 5 0 198.00 38.4 610.2 20.3 3 6811 37.2 1 6 2 2 2 5 0 414.50 9.75 3793 16.9 3 2600 41.75 1 0 1 2 3 3 5 94.24 26.64 635.02 15.38 5 5215 36.33 6 6 2 4 2 1 0 410.00 78 1250.25 18 2 5723 34.5 1 8 1 5 3 5 9 995.00 316.4 4064.4 18.7 5 11684 84.4 7 6 2 6 4 0 676.00 300 942.2 21.45 5 7353 75.8 1 6 6 2 7 2 0 52.20 92.8 712.2 14.55 3 5678 30.6 8 9 1 8 7 0 77.00 81 514.52 19.47 4 6417 33.03 1 4 4 2 9 4 2 312.60 403.2 1316.2 21.4 3 18143 41.4 1 1 2 10 2 1 252.20 207.2 1012.4 19.1 3 12770 39.4 4 3 1 11 1 0 0 183.00 12 814.8 13.6 4 2250 39 4 1 1 12 1 3 45.80 70.4 541.8 16.7 4 3911 30.6 1 2 0 1 13 3 1 453.00 393 1326.6 19.84 1 106538 44.6 4 6 3 14 1 8 0 221.60 166.4 574.4 14.4 3 8016 40 1 6 6 2 15 1 1 0 208.00 45 590.6 16.05 3 3873 33 1 8 0 2 16 6 0 207.80 12.8 789 14.85 2 3572 44.9 8 5 2 17 3 0 43.00 27 574.17 16.05 4 2834 32 1 2 0 1 18 1 3 0 254.00 42 886.2 20.8 3 3878 40.8 2 1 6 2 19 1 4 5 259.80 319.8 1123.8 22.1 3 10750 42 1 0 6 2 20 1 9 0 723.00 27 765.36 18.73 4 11030 50.67 1 5 0 2 21 3 8 0 525.00 489.6 4618.8 22.25 5 9587 52.6 8 9 2 22 4 0 137.40 99 675.8 17.08 4 7393 35 4 6 2 23 1 6 141.00 57 439.65 20.8 3 5593 38 1 7 6 1 24 8 0 147.80 178.5 1067.8 16.9 3 5656 39.4 6 5 2 25 4 3 83.00 120.15 283.68 14.77 3 4928 28.33 5 8 1 26 7 5 0 1373.38 77.28 3858.79 19.19 5 5592 80.53 1 2 9 2 27 4 0 126.80 89.6 322.4 16.05 2 4233 27.4 1 2 0 1 28 8 0 1114.00 318 2684.1 17.4 5 12206 91 1 5 6 1 29 1 0 0 843.00 25.2 937.6 17.05 5 6330 54.4 2 7 2 30 1 5 229.00 95.2 762.8 19.5 3 113478 37 5 7 2 31 1 4 52.00 66 211 19.067 4 5054 30.9 5 9 2 32 1 2 2 184.00 219 976.6 22.3 5 9784 34.8 6 3 2 33 9 5 283.50 90.75 513 18.95 3 16358 45.2 5 7 3L2
Tabel 9
Ketidakberhasilan Survai
Yang tidak berhasil disurvai:
1 Advent College
Cemp.Putih
Jkt Pusat
2 Bina Sarana Inf.
Kramat
Jkt Pusat
3 Citra Media
Palmerah
Jkt Barat
4 CP/M
Roxy
Jkt Barat
5 Ganesha
Slipi
Jkt Barat
6 IBMIK
Palmerah
Jkt Barat
7 Informatika
Kelapa Gad.
Jkt Utara
8 ISKI
Cawang
Jkt Timur
9 KSM
Kelapa Gad.
Jkt Utara
10 LPKT Gramedia
Palmerah
Jkt Barat
11 Media College
Bintaro
Jkt Selatan
12 PPMK
Pasar Baru
Jkt Pusat
13 Prof. Edu. Cent.
Roxy
Jkt Barat
14 Rilis
Tebet
Jkt Selatan
15 Science College
Slipi
Jkt Barat
16 Stena
Kelapa Gad.
Jkt Utara
17 TEC
Tebet
Jkt Selatan
18 Vistas
Rw. mangun
Jkt Timur
19 Widya Loka Pusat
Harmoni
Jkt Pusat
Gambar 24
Residu Baku Regresi versus Frekuensi
Sumber: Keluaran SPSS
Gambar 25
Probabilitas Kumulatif Teramati versus Probabilitas Kumulatif yang Diharapkan
Sumber: Keluaran SPSS
KORELASI ANTAR VARIABEL
DAN SIGNIFIKANSINYA
- - Correlation Coefficients - -SISWA HARGA HW LOKASI MAN PRASARAN SISWA 1.0000 -.1397 .6973 .3681 .6874 .5502 ( 33) ( 33) ( 33) ( 33) ( 33) ( 33) P= . P= .438 P= .000 P= .035 P= .000 P= .001 HARGA -.1397 1.0000 .0403 -.3441 -.0129 -.0017 ( 33) ( 33) ( 33) ( 33) ( 33) ( 33) P= .438 P= . P= .824 P= .050 P= .943 P= .993 HW .6973 .0403 1.0000 .4470 .6907 .9120 ( 33) ( 33) ( 33) ( 33) ( 33) ( 33) P= .000 P= .824 P= . P= .009 P= .000 P= .000 LOKASI .3681 -.3441 .4470 1.0000 .3666 .5186 ( 33) ( 33) ( 33) ( 33) ( 33) ( 33) P= .035 P= .050 P= .009 P= . P= .036 P= .002 MAN .6874 -.0129 .6907 .3666 1.0000 .6543 ( 33) ( 33) ( 33) ( 33) ( 33) ( 33) P= .000 P= .943 P= .000 P= .036 P= . P= .000 PRASARAN .5502 -.0017 .9120 .5186 .6543 1.0000 ( 33) ( 33) ( 33) ( 33) ( 33) ( 33) P= .001 P= .993 P= .000 P= .002 P= .000 P= . PROMO .1926 .2277 .2221 .1467 .2490 .2248 ( 33) ( 33) ( 33) ( 33) ( 33) ( 33) P= .283 P= .203 P= .214 P= .415 P= .162 P= .208 STATUS .1690 .3775 .1730 -.0334 .1403 .1639 ( 33) ( 33) ( 33) ( 33) ( 33) ( 33) P= .347 P= .030 P= .336 P= .854 P= .436 P= .362 SW .1786 .2858 .3017 .1010 .4567 .4141 ( 33) ( 33) ( 33) ( 33) ( 33) ( 33) P= .320 P= .107 P= .088 P= .576 P= .008 P= .017 UMUR .1026 -.2535 .0908 .0872 -.0223 .1653 ( 33) ( 33) ( 33) ( 33) ( 33) ( 33) P= .570 P= .155 P= .615 P= .629 P= .902 P= .358 (Coefficient / (Cases) / 2-tailed Significance)
- - Correlation Coefficients - - PROMO STATUS SW UMUR SISWA .1926 .1690 .1786 .1026 ( 33) ( 33) ( 33) ( 33) P= .283 P= .347 P= .320 P= .570 HARGA .2277 .3775 .2858 -.2535 ( 33) ( 33) ( 33) ( 33) P= .203 P= .030 P= .107 P= .155 HW .2221 .1730 .3017 .0908 ( 33) ( 33) ( 33) ( 33) P= .214 P= .336 P= .088 P= .615 LOKASI .1467 -.0334 .1010 .0872 ( 33) ( 33) ( 33) ( 33) P= .415 P= .854 P= .576 P= .629 MAN .2490 .1403 .4567 -.0223 ( 33) ( 33) ( 33) ( 33) P= .162 P= .436 P= .008 P= .902 PRASARAN .2248 .1639 .4141 .1653 ( 33) ( 33) ( 33) ( 33) P= .208 P= .362 P= .017 P= .358 PROMO 1.0000 .3828 .5331 .1033 ( 33) ( 33) ( 33) ( 33) P= . P= .028 P= .001 P= .567 STATUS .3828 1.0000 .2215 -.0627 ( 33) ( 33) ( 33) ( 33) P= .028 P= . P= .215 P= .729
L5
SW .5331 .2215 1.0000 -.1719 ( 33) ( 33) ( 33) ( 33) P= .001 P= .215 P= . P= .339 UMUR .1033 -.0627 -.1719 1.0000( 33) ( 33) ( 33) ( 33) P= .567 P= .729 P= .339 P= . (Coefficient / (Cases) / 2-tailed Significance) " . " is printed if a coefficient cannot be computed
REGRESI LINIER BERGANDA DENGAN 9 VARIABEL BEBAS
METODE: BIASA
03 Jan 98 SPSS for MS WINDOWS Release 6.0 * * * * M U L T I P L E R E G R E S S I O N * * * * Listwise Deletion of Missing Data
Mean Std Devia Label SISWA 110.939 145.307 HARGA 13492.061 25201.472 HW 343.049 331.699 LOKASI 3.545 1.063 MAN 1217.853 1170.267 PRASARAN 472.519 377.650 PROMO 18.172 2.496 STATUS 1.758 .561 SW 139.214 132.162 UMUR 97.212 53.635 N of Cases = 33 Descriptive Statistics
Block Number 1. Method: Enter
HARGA HW LOKASI MAN PRASARAN PROMO STATUS SW UMUR
Variable(s) Entered on Step Number 1.. UMUR 2.. MAN 3.. STATUS 4.. LOKASI 5.. PROMO 6.. HARGA 7.. SW 8.. HW 9.. PRASARAN Multiple R .82238 R Square .67630 Adjusted R Square .54964 Standard Error 97.51395 Analysis of Variance
DF Sum of Squares Mean Square Regression 9 456945.56892 50771.72988 Residual 23 218706.30987 9508.96999 F = 5.33935 Signif F = .0006
L6
--- Variables in the Equation --- Variable B SE B 95% Confdnce Intrvl B Beta HARGA -.001030 8.6392E-04 -.002817 7.57545E-04 -.178571 HW .450276 .150791 .138341 .762212 1.027866 LOKASI 10.662378 21.631277 -34.085328 55.410084 .078026 MAN .050325 .022444 .003896 .096754 .405304 PRASARAN -.285255 .140089 -.575051 .004542 -.741371 PROMO -1.158981 9.480328 -20.770534 18.452572 -.019909
STATUS 34.379354 35.733013 -39.540016 108.298725 .132663 SW .036055 .208061 -.394353 .466462 .032793 UMUR .283872 .377116 -.496253 1.063997 .104781 (Constant) -65.917250 147.987861 -372.053465 240.218966
--- Variables in the Equation --- Variable Tolerance VIF T Sig T HARGA .626880 1.595 -1.192 .2455 HW .118780 8.419 2.986 .0066 LOKASI .561667 1.780 .493 .6267 MAN .430740 2.322 2.242 .0349 PRASARAN .106168 9.419 -2.036 .0534 PROMO .530663 1.884 -.122 .9038 STATUS .740236 1.351 .962 .3460 SW .392995 2.545 .173 .8639 UMUR .726343 1.377 .753 .4592 (Constant) -.445 .6602 Equation Number 1 Dependent Variable.. SISWA Residuals Statistics:
Min Max Mean Std Dev N *PRED -35.3474 517.8037 110.9394 119.4971 33 *RESID -251.5840 232.1963 .0000 82.6715 33 *ZPRED -1.2242 3.4048 .0000 1.0000 33 *ZRESID -2.5800 2.3812 .0000 .8478 33 Total Cases = 33 Durbin-Watson Test = 2.38342 Collinearity Diagnostics
Number Eigenval Cond Variance Proportions
Index Constant HARGA HW LOKASI MAN PRASARAN 1 7.64906 1.000 .00020 .00225 .00072 .00070 .00253 .00058 2 .86842 2.968 .00003 .42114 .00373 .00076 .01101 .00231 3 .71027 3.282 .00175 .02825 .01333 .00289 .04778 .00534 4 .33006 4.814 .00007 .16487 .03022 .00010 .00897 .00646 5 .17495 6.612 .00227 .00013 .00589 .00696 .43578 .02805 6 .14509 7.261 .00181 .06016 .01602 .03319 .40581 .01146 7 .06166 11.138 .00469 .25081 .01598 .23064 .00493 .00076 8 .03429 14.935 .04025 .05378 .47819 .15773 .04812 .28541 9 .02016 19.478 .15870 .01824 .34627 .55871 .02667 .55703 10 .00604 35.592 .79022 .00036 .08965 .00831 .00839 .10259
PROMO STATUS SW UMUR 1 .00015 .00101 .00215 .00209 2 .00004 .00151 .00649 .00375 3 .00091 .00468 .02224 .04340 4 .00030 .00000 .33152 .01706 5 .00061 .01853 .17276 .19307 6 .00069 .01774 .00004 .49565 7 .00043 .65414 .00251 .00040 8 .03821 .17070 .02834 .00475 9 .01803 .09270 .14282 .17550 10 .94061 .03899 .29113 .06432
End Block Number 1 All requested variables entered.
L7
REGRESI LINIER BIVARIAT ANTARA VARIABEL TAK BEBAS
DENGAN TIAP-TIAP VARIABEL BEBAS
1.
Siswa dengan Perangkat Keras
* * * * M U L T I P L E R E G R E S S I O N * * * * Equation Number 1 Dependent Variable.. SISWA
Variable(s) Entered on Step Number 1.. HW Multiple R .69729 R Square .48622 Adjusted R Square .46965 Standard Error 105.82038 Analysis of Variance
DF Sum of Squares Mean Square Regression 1 328515.34863 328515.34863 Residual 31 347136.53016 11197.95259 F = 29.33709 Signif F = .0000
--- Variables in the Equation --- Variable B SE B Beta T Sig T HW .305463 .056396 .697295 5.416 .0000 (Constant) 6.150499 26.713787 .230 .8194 End Block Number 1 All requested variables entered.
2.
Siswa dengan Perangkat Lunak
Equation Number 1 Dependent Variable.. SISWA Block Number 1. Method: Enter SW
Variable(s) Entered on Step Number 1.. SW Multiple R .17860 R Square .03190 Adjusted R Square .00067 Standard Error 145.25833 Analysis of Variance
DF Sum of Squares Mean Square Regression 1 21552.45931 21552.45931 Residual 31 654099.41948 21099.98127 F = 1.02144 Signif F = .3200
--- Variables in the Equation --- Variable B SE B Beta T Sig T SW .196366 .194294 .178602 1.011 .3200 (Constant) 83.602471 37.027173 2.258 .0311 End Block Number 1 All requested variables entered.
3.
Siswa dengan Perangkat Manusia
Equation Number 1 Dependent Variable.. SISWA Block Number 1. Method: Enter MAN
Variable(s) Entered on Step Number 1.. MAN Multiple R .68744 R Square .47257 Adjusted R Square .45556 Standard Error 107.21668 Analysis of Variance
L8
DF Sum of Squares Mean Square Regression 1 319293.97371 319293.97371 Residual 31 356357.90508 11495.41629 F = 27.77576 Signif F = .0000
--- Variables in the Equation --- Variable B SE B Beta T Sig T MAN .085356 .016196 .687439 5.270 .0000 (Constant) 6.988006 27.154856 .257 .7986 End Block Number 1 All requested variables entered.
4.
Siswa dengan Promosi
Equation Number 1 Dependent Variable.. SISWA Block Number 1. Method: Enter PROMO Variable(s) Entered on Step Number
1.. PROMO Multiple R .19255 R Square .03708 Adjusted R Square .00601 Standard Error 144.86935 Analysis of Variance
DF Sum of Squares Mean Square Regression 1 25050.90155 25050.90155 Residual 31 650600.97724 20987.12830 F = 1.19363 Signif F = .2830
--- Variables in the Equation --- Variable B SE B Beta T Sig T PROMO 11.209284 10.259890 .192553 1.093 .2830 (Constant) -92.756060 188.140849 -.493 .6255 End Block Number 1 All requested variables entered.
5.
Siswa dengan Lokasi
Equation Number 1 Dependent Variable.. SISWA Block Number 1. Method: Enter LOKASI Variable(s) Entered on Step Number
1.. LOKASI Multiple R .36812 R Square .13551 Adjusted R Square .10762 Standard Error 137.26522 Analysis of Variance
DF Sum of Squares Mean Square Regression 1 91557.88968 91557.88968 Residual 31 584093.98911 18841.74158 F = 4.85931 Signif F = .0350
--- Variables in the Equation --- Variable B SE B Beta T Sig T LOKASI 50.304020 22.819984 .368117 2.204 .0350 (Constant) -67.411223 84.361954 -.799 .4303 End Block Number 1 All requested variables entered.
6.
Siswa dengan Harga
Equation Number 1 Dependent Variable.. SISWA Block Number 1. Method: Enter HARGA Variable(s) Entered on Step Number
1.. HARGA
L9
Multiple R .13967 R Square .01951 Adjusted R Square -.01212 Standard Error 146.18504 Analysis of VarianceDF Sum of Squares Mean Square Regression 1 13179.87915 13179.87915 Residual 31 662471.99964 21370.06450 F = .61674 Signif F = .4382
--- Variables in the Equation --- Variable B SE B Beta T Sig T HARGA -8.05295E-04 .001025 -.139667 -.785 .4382 (Constant) 121.804478 28.965254 4.205 .0002 End Block Number 1 All requested variables entered.
7.
Siswa dengan Prasarana
Equation Number 1 Dependent Variable.. SISWA Block Number 1. Method: Enter PRASARAN
Variable(s) Entered on Step Number 1.. PRASARAN Multiple R .55019 R Square .30271 Adjusted R Square .28022 Standard Error 123.27824 Analysis of Variance
DF Sum of Squares Mean Square Regression 1 204528.65527 204528.65527 Residual 31 471123.22352 15197.52334 F = 13.45803 Signif F = .0009
--- Variables in the Equation --- Variable B SE B Beta T Sig T PRASARAN .211696 .057706 .550194 3.669 .0009 (Constant) 10.909035 34.699183 .314 .7553 End Block Number 1 All requested variables entered.
8.
Siswa dengan Umur Kursus
Equation Number 1 Dependent Variable.. SISWA Block Number 1. Method: Enter UMUR
Variable(s) Entered on Step Number 1.. UMUR Multiple R .10262 R Square .01053 Adjusted R Square -.02139 Standard Error 146.85259 Analysis of Variance
DF Sum of Squares Mean Square Regression 1 7115.68008 7115.68008 Residual 31 668536.19870 21565.68383 F = .32995 Signif F = .5698
--- Variables in the Equation --- Variable B SE B Beta T Sig T UMUR .278028 .484018 .102623 .574 .5698 (Constant) 83.911734 53.548432 1.567 .1273 End Block Number 1 All requested variables entered.
L10
9.
Siswa dengan Status Kursus
Equation Number 1 Dependent Variable.. SISWA Block Number 1. Method: Enter STATUS Variable(s) Entered on Step Number
1.. STATUS Multiple R .16896 R Square .02855 Adjusted R Square -.00279 Standard Error 145.50950 Analysis of Variance
DF Sum of Squares Mean Square Regression 1 19288.46011 19288.46011 Residual 31 656363.41867 21173.01351 F = .91099 Signif F = .3472
--- Variables in the Equation --- Variable B SE B Beta T Sig T STATUS 43.786145 45.875337 .168961 .954 .3472 (Constant) 33.981928 84.514516 .402 .6904 End Block Number 1 All requested variables entered.
REGRESI LINIER BERGANDA DENGAN 9 VARIABEL BEBAS
METODE: STEPWISE
* * * * M U L T I P L E R E G R E S S I O N * * * * Listwise Deletion of Missing Data
Equation Number 1 Dependent Variable.. SISWA
Block Number 1. Method: Stepwise Criteria PIN .0500 POUT .1000 HARGA HW LOKASI MAN PRASARAN PROMO STATUS SW UMUR
Variable(s) Entered on Step Number 1.. HW Multiple R .69729 R Square .48622 Adjusted R Square .46965 Standard Error 105.82038 Analysis of Variance
DF Sum of Squares Mean Square Regression 1 328515.34863 328515.34863 Residual 31 347136.53016 11197.95259 F = 29.33709 Signif F = .0000
--- Variables in the Equation --- Variable B SE B Beta T Sig T HW .305463 .056396 .697295 5.416 .0000 (Constant) 6.150499 26.713787 .230 .8194 --- Variables not in the Equation --- Variable Beta In Partial Min Toler T Sig T HARGA -.168029 -.234230 .998377 -1.320 .1969 LOKASI .070528 .088019 .800204 .484 .6319 MAN .393571 .397043 .522884 2.369 .0244 PRASARAN -.509923 -.291754 .168190 -1.671 .1052 PROMO .039634 .053913 .950668 .296 .7695 STATUS .049788 .068413 .970055 .376 .7099 SW -.034935 -.046468 .908991 -.255 .8006 UMUR .039611 .055034 .991749 .302 .7648
L11
* * * * M U L T I P L E R E G R E S S I O N * * * * Equation Number 1 Dependent Variable.. SISWAVariable(s) Entered on Step Number 2.. MAN Multiple R .75314 R Square .56721 Adjusted R Square .53836 Standard Error 98.72737 Analysis of Variance
DF Sum of Squares Mean Square Regression 2 383239.05222 191619.52611 Residual 30 292412.82657 9747.09422 F = 19.65914 Signif F = .0000
--- Variables in the Equation --- Variable B SE B Beta T Sig T HW .186373 .072764 .425441 2.561 .0157 MAN .048868 .020624 .393571 2.369 .0244 (Constant) -12.509636 26.137814 -.479 .6357 --- Variables not in the Equation --- Variable Beta In Partial Min Toler T Sig T HARGA -.152445 -.231170 .520461 -1.280 .2108 LOKASI .042437 .057473 .479499 .310 .7588 PRASARAN -.570630 -.354532 .152738 -2.042 .0504 PROMO 4.987E-05 .000073 .513267 .000 .9997 STATUS .041377 .061921 .516976 .334 .7407 SW -.163694 -.221310 .455043 -1.222 .2315
UMUR .074380 .111808 .511598 .606 .5493
End Block Number 1 PIN = .050 Limits reached.