35
J Trop Soils, Vol. 23, No. 1, 2018: 35-45Available online at:
http://journal.unila.ac.id/index.php/tropicalsoil DOI: 10.5400/jts.2018.v23i1.35-45
J Trop Soils, Vol. 23, No. 1, 2018: 35-45 ISSN 0852-257X
Phosphorus (P) Adsorption Behavior and Harvested P by the
Sugar-cane (Saccharum officinarum L.) Affected by Inorganic
and Organic Fertilizer Applications on an Ultisol
Jamalam Lumbanraja1*, Catur Putra Satgada1, Sarno1, Muhajir Utomo1, Rosma Hasibuan1, Dermiyati1 and Sugeng Triyono2
1Department of Agrotechnology and2Department of Agricultural Engineering, Faculty of Agriculture, University
of Lampung, Jl. Sumantri Brojonegoro No.1 Bandar Lampung, Indonesia 35145. *corresponding author e-mail:
j.lumbanraja53@gmail.com; jamalam.lumbanraja@fp.unila.ac.id.
Received 14 September 2017/ Accepted 4 January 2018
ABSTRACT
Penelitian lapangan dan laboratorium dilakukan (1) untuk mengetahui perilaku adsorpsi fosfor (P) yang menggunakan Metode Langmuir dan hasil tebu serta P terangkut panen yang dipengaruhi oleh pupuk organik (kompos) dan anorganik dan (2) untuk mengetahui korelasi antara parameter Langmuir dan ketersediaan P atau P terangkut panen tebu. Percobaan lapangan dan laboratorium disusun dalam rancangan acak kelompok, terdiri dari lima perlakuan (A = 100% NPK, B = 100% kompos, kompos C = 100% NPK + 50% kompos, D = 50% NPK + 100%, kompos , dan E = tidak ada pupuk). Setiap perlakuan diulang tiga kali. Penelitian lapangan dilakukan di Laboratorium Lapang Terpadu Fakultas Pertanian (FP) Universitas Lampung dan Studi Langmuir P dilakukan di Laboratorium Ilmu Tanah Fakultas Pertanian Universitas Lampung. Hasil penelitian menunjukkan bahwa kombinasi pupuk 100% NPK+50% organik, dan 100% NPK mempengaruhi ketersediaan P dalam tanah tertinggi, adsorpsi P maksimum terendah (Xm) dan energi ikatan relatif terendah (km) P; serta pengaruh tertinggi pada peningkatan produksi tebu. Sedangkan perlakuan tanpa pupuk dan 100% kompos (pupuk organik) memiliki adsorpsi P maksimum tertinggi (Xm) dan produksi gula terendah. Ada korelasi negatif yang sangat nyata antara adsorpsi maksimum (Xm) dengan keberadaan P tanah dan P terangkut panen dan biomassa batang; namun tidak berkorelasi secara nyata antara energi ikatan relatif (km) dengan keberadaan P dalam tanah, P terangkut panen dan biomassa daun dan batang tebu.
Kata kunci: Kompos, Langmuir, pupuk organik, pupuk anorganik, tebu, Ultisols
ABSTRAK
Keywords: Compost, inorganic fertilizers, Langmuir, sugarcane, Ultisols
The field and laboratory experimental studies were conducted to determine the phosphorus (P) adsorption behavior employing Langmuir Method and yield of sugarcane as affected by compost and inorganic fertilizer applications, and to determine the correlations between the Langmuir parameters and the availability of P in soil or harvested P by the sugarcane. Both field and lab experiments were arranged in a randomized block design, consisting of five treatments (A= 100% NPK, B=100% compost, C=100% NPK + 50% compost, D= 50% NPK + 100%,compost, and E= no fertilizer). Each treatment was replicated three times. Field and laboratory studies were carried out in the sugarcane field and in the Laboratory of Soil Science, the University of Lampung for Langmuir P studies, respectively. The results showed that the applications of 100% NPK plus 50% organic fertilizer, and 100% NPK resulted in the highest amount of available-P in the soil, the lowest maximum adsorption of P (X
m) and the lowest relative bonding energy
of P (k
m); as well as the highest effect on the increase of sugarcane production. On the other hand, the treatments
of no fertilizer and the 100% organic fertilizer resulted in the highest maximum adsorption of P (X
m) and the lowest
sugar production. There were very significant negative correlations between the maximum adsorption of P (X
m) and
soil P, harvested P by the sugarcane and stem biomass; while similar trend but no significant correlations between the relative bonding energy of P (k
The availability of phosphorus (P) in soils can directly affect crop production (Williamset al. 2013; Oelkers and Valsami-Jones 2008; Lumbanraja 1995; Lumbanrajaet al. 1982). Regardless of P is naturally present at high concentration in some soils, it is often a limiting nutrient factor due to the insoluble nature of most soil P compounds and the rapid formation of poorly available P after phosphorus fertilizer incorporation (Maliket al. 2012; Arai and Sparks 2007; Lumbanrajaet al. 1994; Lindsayet al. 1989; Sparks 1989; Lumbanrajaet al., 1981). Application of inorganic fertilizers can sufficiently supply P to crops (Reddyet al. 2005; Ayagaet al.2006) and it is timely dependent (Vetterleinet al. 1999; van der Zee et al. 1988; van der Zee et al. 1986; Lumbanrajaet al. 2017). This practice can saturate binding sites of P in soil particles and result in a reduction of the capability of the soil to retain P. In soil with low P retention potential, there is high release of P into soil solution, therefore the P could be available to crops (Manthambala et al. 2016). Such the degree of P saturation is a potential indicator of P release into soil solution, which does not only indicate that P is available for crops but might be also indicate P losses through leaching and erosion through runoff or drainage water (Kanget al. 2011; Allenet al. 2006; Cassonet al. 2006).
The dependency on inorganic fertilizers can be reduced by applying organic fertilizers such as animal manure, crop byproducts, and any waste products containing high nutrients (Nugrohoet al.
2012; Nugrohoet al. 2013; Zhaoet al. 2009; Reddy
et al. 2005). Moreover, by beneficially utilizing animal manure and any other natural organic byproducts, there is no need to waste the animal manure or burn the rice straw. Therefore, applying a combination of inorganic and organic P fertilizers can be beneficial because of the synergetic effects that cause an increase of the efficient use of applied P fertilizers, thus improving agricultural productivity (Kaur et al. 2008; Kasno 2009). Organic amendments can improve P recovery by crops either through applied organic P and inorganic P fertilizers from the irreversible adsorption complexes in the soils (Delgadoet al. 2002; Siddique and Robinson 2003) or it can mobilize native soil P (Mohantyet al. 2006).
Sugarcane (Saccharum officinarum L.) is an important crop in Indonesia that is lately cultivated in the upland area of humid tropical soils. The crop is a high nutrient uptake crop, which can remove about 2 kg N, 0.2 kg P and 2.3 kg K from soil for every one ton of its production (Singhet al. 2007). The removed NPK nutrients are supplied mostly by
unbalanced inorganic NPK fertilizers applied to the soil, while the sugarcane also removes the other macro and micronutrients contained in the soil. It has been observed that the yield of sugarcane has decreased due to the imbalanced availability of nutrients in soils (Babu et al. 2007). The loss of organic matter in the soils is the main factor for the declining productivity. Restoration of organic matter is needed for maintaining the soil health and improving soil productivity.
One source of organic materials that can be used to reduce P adsorption on soil colloids is Organonitrophos fertilizer that has been introduced by Nugrohoet al. (2012), in which its application can be combined with inorganic fertilizers. The use of both Organonitrophos and inorganic fertilizers in the current study was intended to study their impacts on sugarcane production and phosphorus uptake by the sugarcane. In addition, the same rates of the fertilizers were applied on subsoil samples in the laboratory experiment to study the effect of the fertilization on the maximum adsorption of P and relative P bonding energy on the soil, which were estimated by fitting the empirical Langmuir model.
MATERIALS AND METHODS
Study Site
The field experiment was performed in the sugarcane area of Integrated Agricultural Experimental Stations (Laboratorium Lapang Terpadu), the University of Lampung, in September 2015 until September 2016 (one year period). A laboratory experiment of P adsorption on subsoil samples was conducted in the Laboratory of Soil Science, the University of Lampung. The soil characteristics including available-P (Bray 1 Method), total-P (25% HCl Method), total-N (Kjeldahl Method), exchangeable-K (Method 1N
NH4OAc pH 7), total-C (Walkley and Black Method), and CEC (1 N NH4OAc pH 7) (Thom and Utomo 1991) were measured in the laboratory. The yield of sugarcane and harvested P by the sugarcane were also determined.
Experimental Design
37
J Trop Soils, Vol. 23, No. 1, 2018: 35-45150 kg ha-1; KCl: 300 kg ha-1; Organonitrophos: 5000 kg ha-1 (100% NPK + 50% compost); D = Urea: 150 kg ha-1; TSP: 75 kg ha-1; KCl: 150 kg ha-1; Organonitrophos: 10,000 kg ha-1(50% NPK +100% compost), E= without Fertilization) were arranged using a Randomized Block Design (RBD). Each treatment was replicated three times.
The subsoil samples (20-40 cm depth) were taken from the same field as used for the field experiment in order to conduct a laboratory experiment. The soil samples were air-dried and sieved through 2 mm sieve, then applied with similar fertilizer treatments as used in the field experiment. About 2 kg of subsoil sample that had been treated with each treatment was saturated with water with the ratio of soil to water of 1:1 for one week. The use of subsoil samples in the laboratory experiment was aimed to minimize the effects of soil organic matter and the fertilizer treatments applied on the topsoil on the P adsorption estimated using the Langmuir model (Parfitt 1978; Bubba 2003; Yang
et al. 2014; Dianaet al. 2010; Lumbanraja 2017). Phosphoprus Adsorption Analysis
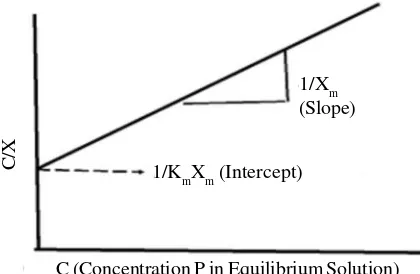
The Langmuir Isotherm Model with a modified series solution: 0 ppm P, 10 ppm P, 20 ppm P, 50 ppm P, 100 ppm P, and 200 ppm P (KH2PO4) in 5 mmol CaCl2 solution had been applied to the saturated subsoil samples. The treated subsoil sample of each treatment were weighed 2 g and put into a shaker bottle, then the representing subsoil sample of the treatment was added each with 20 ml of representing of series solutions (0, 10, 20, 50, 100, and 200 ppm P). Then the soil suspension was shaken using shakers during two hours, and then centrifuged at 3,000 rpm for 10 minutes. The clear supernatant was used to measure P in equilibrium solution using a spectrophotometer with 720 nm wavelength (Sari 2015; Carter and Gregorich 2008; Fiantis 2004). The Langmuir equation curve is presented in Figure 1.
C
C (Concentration P in Equilibrium Solution)
(Parfitt 1978; Bubba 2003; Mohammadet al. 2012; Dianaet al. 2010; Lumbanraja 2017).
In whichC = P equilibrium concentration in solution (mg P L-1),X = the amount of adsorbed P (mg P kg-1 soil),X
m = maximum adsorption (mg P
kg-1 soil);k
m= relative bond energy;C/X = solution
to adsorbed P index. Data Analysis
The student-t test was performed (Susilo 2013) to see the difference between each maximum phosphorus adsorption (Xm) of each treatment and each relative phosphorus bond energy (km) of each treatment using the Langmuir isotherm model. Analysis of variance was performed to analyse the data of vegetative and generative components of the sugarcane. In addition, the Least Significant Difference (LSD) test was futher performed to see the differences among means.
RESULTS AND DISCUSSION
Chemical Properties of the Soil from Field Experiment
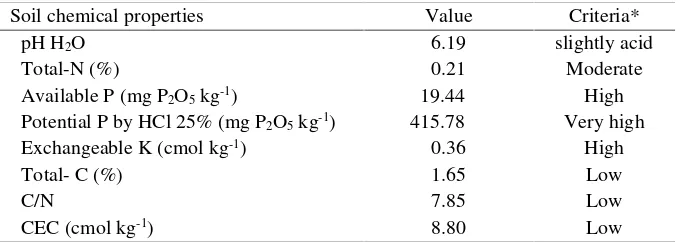
The results of the soil analysis showed that the Ultisol that had been used for the field experiment has slightly acidic pH, and the nutrient availability in the soil such as total-N, exchangeable K, and available-P is in moderate, high, and very high amount, respectively (Table 1). The very high available-P content in the soil can be affected by the residual P fertilizer applied in the previous cultivation of crops and by the soil parent material that is formed from the basaltic materials.
because of the addition of compost in the treament A that could increase the content of available-P in the soil.
The results of analysis of soil samples taken after sugarcane harvesting showed that all the treatments decreased the total C contents in the soil (Table 2). The decrease in soil organic matter content can be due to the rapid decomposition process of soil organic matter. Rindyastuti and Darmayanti (2010) reported that organic materials with a C/N ratio of 26.15 can be decomposed within 1 up to 3 months, whereas in the current study the average value of soil C/N ratio is 7.85, which is considered as low. The amount of available-P in soil after sugarcane harvesting also decreased in comparison to that in the initial soil. This result can be understood by the high uptake of P by the sugarcane. The decreasing of soil organic matter content could also cause the decrease of available-P in the soil. This result indicates that the amount of available-P in the soil is strongly influenced by the amount of organic matter contained in the soil. If the soil organic matter content is high then the amount
of available-P in the soil will be high as well (Sari 2015; Utami and Handayani 2003; Singh 2015). Sugar Production and The Amount of Harvested P by the Sugarcane
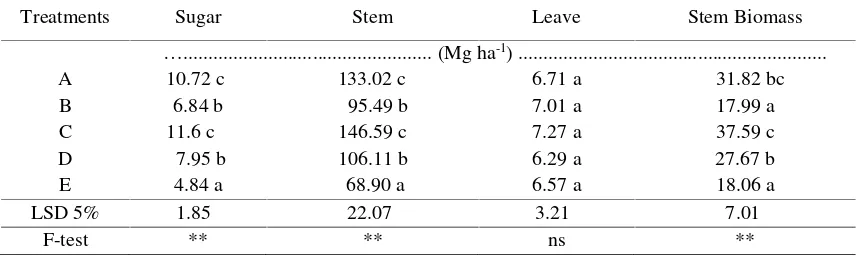
Table 3 shows the production of sugar and dry biomass of leaves and stems obtained from all the treatments. There were similar trends of the significant effects of the treatments on the sugar production and the stem biomass. On the other hand, there was no significant effect of the treatments on the leave biomass. The sugar production and sugarcane stem biomass in the treatment A (100% NPK) were not significantly different from those in the treatment C (100% NPK + 50% compost), but the sugar production and stem biomass in both A and C treatments were significantly higher than those in the treatment B (100% compost) and D (50% NPK + 100% compost). However, there was no significant different effect between treatment B and D on the sugar production and stem biomass. The result also showed that the the highest sugar production and stem biomass were obtained in the Table 2. Chemical properties of the soil after sugarcane harvesting.
Table 1. Chemical properties of the soil in the study site.
Soil chemical properties Value Criteria*
pH H2O 6.19 slightly acid
Total-N (%) 0.21 Moderate
Available P (mg P2O5kg-1) 19.44 High
Potential P by HCl 25% (mg P2O5kg-1) 415.78 Very high
Exchangeable K (cmol kg-1) 0.36 High
Total- C (%) 1.65 Low
C/N 7.85 Low
CEC (cmol kg-1) 8.80 Low
*Based on the criteria proposed by the Balai Penelitian Tanah (2009).
Chemical properties Treatments
A B C D E
pH H2O 6.15sa 6.22sa 6.41sa 6.50sa 5.96sa
pH KCl 4.96 5.48 5.39 5.56 4.98
Total N (%) 0.21m 0.18m 0.24m 0.16l 0.16l
Available P (mg P2O5kg-1) 7.15l 6.29l 12.03S 6.74l 5.62l
Potential P (mg P2O5kg-1) 374.02vh 350.20vh 405.82vh 372.72vh 288.64vh
Ex. K (cmol kg-1) 0.22l 0.21l 0.25l 0.23l 0.13l
Total C (%) 1.61l 1.60l 1.43l 1.60l 1.15l
CEC (cmol kg-1) 8.00l 7.00l 8.50l 7.50l 7.00l
A= (100% NPK); B= (100% compost); C= (100% NPK + 50% compost); D= (50% NPK + 100% compost); E= (without fertilizer). The numbers followed by the same letters indicate the criteria of soil chemical properties, namely vh= very high; m=moderate; l=low; sa= slightly acid (Balai Penelitian Tanah 2009).
39
J Trop Soils, Vol. 23, No. 1, 2018: 35-45treatment C. This result indicates that the soil needs the combination of inorganic and organic fertilizer application to increase the sugar production to some rates. It has been also reported that the maize crops grown on similar soil without fertilizer application resulted in the lowest yield (Soplanit and Soplanit 2012; Christine 2013; Dermiyatiet al. 2016).
The results in Table 4 showed that all the treatments did not significantly affect the amount of harvested P by the sugarcane leaves. In contrast, the amount of harvested P by the sugarcane stems of all the treatments showed a different trend. Similar to that of sugar production, the total harvested P in the treatment C was the highest, but not significantly different from that in the treatment A; while, the effect of the treatment D was not significantly different from that of the treatment A. Furthermore, the lowest amount of harvested P was measured in the treatment E and B, and surprisingly the amount of harvested P in the treatment E was not significantly different from that of the treatment
Table 3. The effect of application of organic and inorganic fertilizers on sugarcane production.
Treatments Sugar Stem Leave Stem Biomass
…... (Mg ha-1) ...
A 10.72 c 133.02 c 6.71 a 31.82 bc
B 6.84 b 95.49 b 7.01 a 17.99 a
C 11.6 c 146.59 c 7.27 a 37.59 c
D 7.95 b 106.11 b 6.29 a 27.67 b
E 4.84 a 68.90 a 6.57 a 18.06 a
LSD 5% 1.85 22.07 3.21 7.01
F-test ** ** ns **
A= 100% NPK; B= 100% compost; C= 100% NPK + 50% compost; D= 50% NPK + 100% compost; E= without fertilizer. The numbers followed by the same letters in the same column are not significantly different based on LSD test at 5% significance level. ** is significant atp< 0.01, ns is not significant.
A= 100%NPK; B= 100% compost; C= 100% NPK + 50% compost; D= 50% NPK + 100% compost; E= without fertilizer. The numbers followed by the same letters in the same column are not significantly based on
L S D test at 5% significance level. ** = significant atp < 0.01, * = significant onp < 0.05, ns = not significant.
B. Several studies have reported that the P content in plants showed a significant effect on the dry biomass of stems (Hossainet al. 2010; Grantet al. 2004; Prado 2010). The lower the amount of harvested P, the lower the dry biomass of stems is, and vice versa.
Isothermal P Adsorption
Table 5 shows the soil pH, and the amounts of available-P and potential-P measured after treatments and one week incubation of subsoil samples. The results indicate that the highest soil pH was measured in the treatment C (100% NPK + 50% compost) and the lowest pH was measured in the soil without fertilization as it was expected.
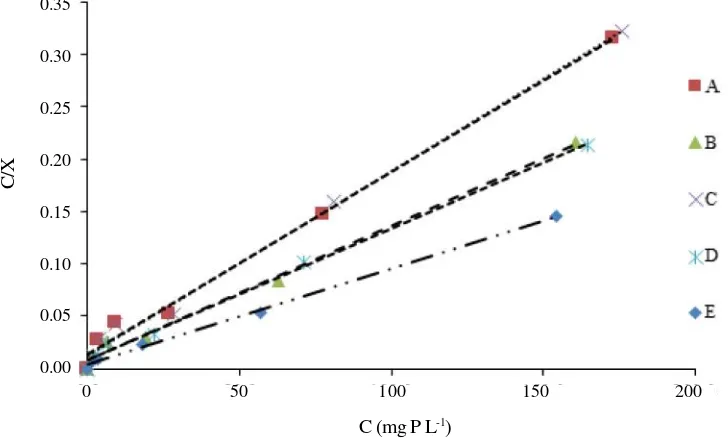
The Langmuir curves are presented in Figure 2 and the linear equations are presented in Table 6. Based on the curves presented in Figure 2, it shows that the higher the P index (C/X) in the soil, the higher the availability of P in the soil is and vice versa. Figure 2 shows that the subsoil samples
Treatments Leaves stem Total
……... (kg ha-1)…...……..
A 13.34 a 25.89 bc 39.22 b
B 13.93 a 14.64 a 28.57 a
C 14.44 a 30.58 c 45.01 b
D 12.49 a 22.51 b 35.00 ab
E 13.05 a 14.69 a 27.74 a
LSD 5% 6.37 5.70 9.66
F-test ns ** *
applied with both treatment A (100% NPK) and treatment C (100% NPK + 50% compost) have the highest equilibrium P (can be interpreted as available-P) in the solutions, and the subsoil applied with treatment E (no fertilizer) has the lowest P in the equilibrium solution. On the other hand, the equilibrium P in the solution of the subsoil applied with both treatment B (100% compost) and D (50% NPK +100% compost) are lower than that of in the treatments A and C but higher than that in the treatment E.
The Langmuir equations are represented in Table 6 and the results of t-test to differentiate the values of Xm andkmamong the treatments are listed in Table 7. The results show that the treatment A (100% NPK) and C (100% NPK + 50% compost) have the lowest maximum P adsorption (Xm =
574.789 mg P kg-1 and X
m = 549.342 mg P kg
-1, respectively) and both treatments A and C are not significantly different for Xm and km(Table 7). In contrast, the highest maximum P adsorption and the
Table 5. The results of subsoil chemical analysis after one week incubation of the treatments.
Properties Treatments
A B C D E
pH H2O 7.23N 6.96N 7.31N 7.11N 6.95N
P-Bray-1 (mg P2O5kg-1) 26.17vh 18.42vh 28.54vh 19.52vh 9.22m
P-extracted HCl 25% (mg P2O5kg-1) 521.11vh 415.69vh 1240.3vh 502.65vh 289.17vh
A= 100% NPK; B= 100% compost; C= 100% NPK + 50% compost; D= 50% NPK + 100% compost; E= without fertilizer. The numbers followed by the same letters indicate the criteria of soil P, namely vh = very high; m = moderate; N = neutral (Balai Penelitian Tanah 2009).
Figure 2. The relationship between the P (C/X) index of the P concentration in the solution
equilibrium (C). A= 100% NPK; B= 100% compost; C= 100% NPK + 50% compost; D= 50% NPK + 100% compost; E= without fertilizer.
relative adsorption energy are obtained in the treatment E (no fertilizer) (Xm = 1103.699 mg P kg-1,k
m = 0.218). The maximum P adsorption (Xm)
of the treatment E is highly significant different from that of the treatment A and significantly higher than that of the treatment B, C, and D. It is understood that when the soil has been fertilized with full recommended amount of phosphorus such as in the treatment A and C, the soil has less capacity to adsorb P from soil solution. On the other hand, when it is not fertilized, the soil has high capacity to adsorb P from the soil solution. The most interesting results ofXm andkm are found for the treatment B (100% compost) and D (50% NPK and 100% compost). Even though the maximum adsorption of P (Xm) of the treatment B is not significantly higher compared to that of the treatment D, but the relative adsorption energy for P binding (km) for the treatment B is significantly lower compared to that of the treatment D (Table.7). The addition of 50% NPK and 100% compost in the treatment D has lowered the
0.35
0.30
0.25
0.20
0.15
0.10
0.05
0.00
C
/X
0 50 100 150 200
41
J Trop Soils, Vol. 23, No. 1, 2018: 35-45maximum adsorption of P but increase the relative adsorption energy for P binding on to the soil colloids. Laverdière and Karam (1984) reported that Ultisols that were treated neither with organic nor inorganic fertilizers had maximum adsorption of P up to 1278
m g P k g
-1 caused by high Al and Fe oxide content. The same result has been reported by Lumbanraja
et al. (2016), which shows that the Al and Fe oxides are the main cause of the maximum pile of P in the soil colloids, and when the soil treated with organic matter, the amount of available-P in the soil indirectly increases by the process of organic matter chelating the Al and Fe ions in the soil solution.
Table 7 also indicates that the relative P-adsorption energy in soil (km) of the treatment A is significantly lower than that of the treatment B and D. It is assumed that full-rate of NPK fertilizer application is sufficient for P in the soil so that the soil in the treatment A has lower capacity to adsorb P from soil solution. Therefore, when the soil has
Table 6. Langmuir isotherm equations for the soil affected by organic and inorganic fertilizer applications.
Treatment Linear equation R2 X
m(mg P kg-1) km
A y = 0.01361+0.00174x 0.993 574.789 0.128 B y = 0.00791+0.00128x 0.994 781.298 0.162 C y = 0.01323+0.00176x 0.992 549.342 0.204 D y = 0.00828+0.00126x 0.991 639.098 0.193 E y = 0.00423+0.00092x 0.993 1103.699 0.218
A= 100% NPK; B= 100% compost; C= 100% NPK + 50% compost; D= 50% NPK + 100% compost; E= without fertilizer. R2 = coefficient of determination;X
m = maximum adsorption of P;km = relative adsorption energy of P.
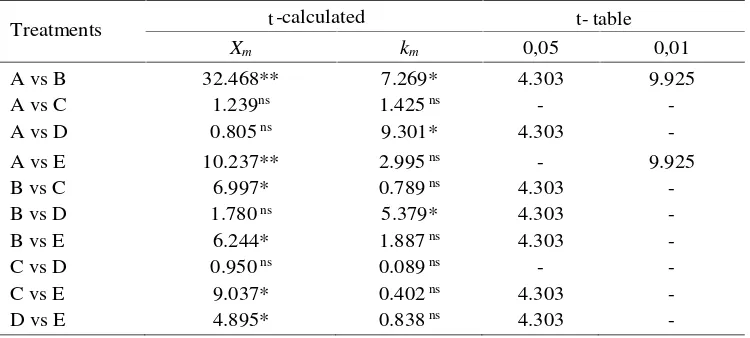
Table 7. The results of student-t test on the maximum adsorption of P (Xm) and relative adsorption energy of P (km).
A= 100% NPK; B= 100% compost; C= 100% NPK + 50% compost; D= 50% NPK + 100% compost; E= without fertilizer. The student-t test is performed to compare the differences of Xm and km in each
treatment. ** = highly significant at 1% level, * = significant at 5% level, and ns = not significant.
been saturated with P and if there is an addition of fertilizer in to the soil, the possibility of P could be
le a c h e d o r e ro d e d fro m th e so il (K a n g et al. 2011).
The results of student-t test also show that the reduction of half doses of NPK fertilizers combined with 10 Mg ha-1 compost has a limited capacity to decrease the value of km..
The Relationship Between Soil Adsorption Behavior and Crop Analysis
Based on the results of the correlation test (Table 8), there are positive correlations between soil P (available-P and total-P) and the amount of harvested P by the sugarcane. The results suggest that the increase of available-P in the soil can increase the P content of the sugarcane, thus affecting the dry biomass of leaves and stems of the sugarcane. However, the amount of harvested P by the sugarcane has no significant effect on the dry biomass of sugarcane leaves. Similar result has
Treatments T-calculated T-Table
Xm km 0,05 0,01
A vs B 32.468** 7.269* 4.303 9.925
A vs C 1.239ns 1.425ns -
-A vs D 0.805ns 9.301* 4.303
-A vs E 10.237** 2.995ns - 9.925
B vs C 6.997* 0.789ns 4.303
-B vs D 1.780ns 5.379* 4.303
-B vs E 6.244* 1.887ns 4.303
-C vs D 0.950ns 0.089ns -
-C vs E 9.037* 0.402ns 4.303
-D vs E 4.895* 0.838ns 4.303
-t t- table
been reported by Temegneet al. (2015) that shows that the content of P in the plant does not affect the number of leaves of the plant. This is due to the content of N in the plant further affects the leaf biomass of the plant (Nguyenet al. 2003). It has been reported that the phosphorus feeding into the soil and increasingly high amount of available-P in soil solution can increase the phosphorus uptake by plant and increase the growth and production of plant (Kasno 2009; Grant
et al. (2004).
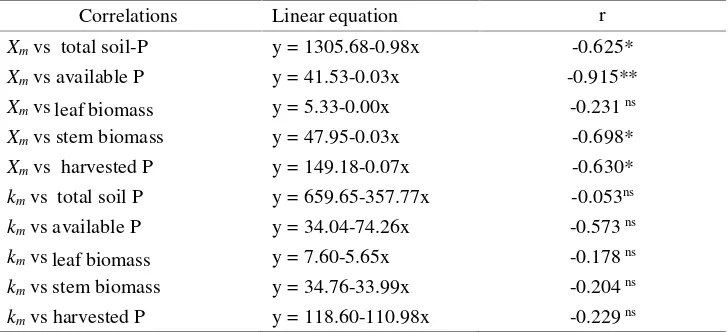
Table 9 shows that the maximum adsorption of P (Xm) has a significantly negative effect on the amounts of total-P and available-P in the soil, stem biomass, and the amount of harvested P by the sugarcane, but not significantly affect the leaf biomass. The results indicate that the higher maximum adsorption of P in the soil will lower the P uptake by the sugarcane, resulting the low production of the sugarcane (Morel et al., 2014). This is because P is an essential nutrient that plays a role in increasing the dry weight of plants (Babu
et al. 2007). The same is true for the relative bonding energy of P (km), which has a negative relationship but does not significantly affect the total-P content,
Table 8. Relationship between soil P, harvested P and stem and leaf biomass of sugarcane.
Correlations Linear equations r Soil available P vs harvested P y = 34.61+2.89x 0.791** Soil total P vs harvested P y = 58.28+0.06x 0.778** Harvested P vs leave biomass y = 5.46+0.01x 0.253ns
Harvested P vs stem biomass y = 17.76+2.84x 0.988**
r = correlation coefficient, ** = highly significant at 1% level; ns = not significant
.
Correlations Linear equation r
Xmvs total soil-P y = 1305.68-0.98x -0.625* Xmvs available P y = 41.53-0.03x -0.915** Xmvs leaves biomass y = 5.33-0.00x -0.231ns Xmvs stem biomass y = 47.95-0.03x -0.698* Xmvs harvested P y = 149.18-0.07x -0.630* kmvs total soil P y = 659.65-357.77x -0.053ns kmvs available P y = 34.04-74.26x -0.573ns kmvs leaves biomass y = 7.60-5.65x -0.178ns kmvs stem biomass y = 34.76-33.99x -0.204ns kmvs harvested P y = 118.60-110.98x -0.229ns
available-P, leaf and stem biomass, and harvested P (Table 9). It is also reported in the study of Handayani (1988) that the addition of organic matter to the soil is able to increase the amount of available-P in the soil and increase the uptake of P by the sugarcane. The increasing harvested P by the sugarcane can speed up the process of cell division that can increase crop production (Babuet al. 2007).
CONCLUSIONS
The results showed that the applications of 100% NPK plus 50% organic fertilizer, and 100% NPK resulted in the highest amount of available-P in the soil, the lowest maximum adsorption of P (Xm) and the lowest relative bonding energy of P (km); as well as the highest effect on the increase of sugarcane production. On the other hand, the no fertilizer and the 100% organic fertilizer applications resulted in the the highest maximum adsorption of P (Xm) and the lowest sugar production. There were very significant negative correlations between the maximum adsorption of P (Xm) and soil P, harvested P by the sugarcane and stem biomass, while similar
Table 9. Correlations between the maximum adsorption of P (Xm), relative adsorption energy of P (km) onto soil and soil P, sugarcane biomass and harvested P by the sugarcane.
r = correlation coefficient; ** = highly significant at 1% level; * = significant at 5% level; ns = not significant.
leaf biomass
leaf biomass
43
J Trop Soils, Vol. 23, No. 1, 2018: 35-45trend but no significant correlations between the relative bonding energy of P (km) and soil P, harvested P, leaf biomass and stem biomass were detected.
REFERENCES
Arai Y, and DL Sparks. 2007. Phosphate reaction dynamics in soils and soil minerals: a multiscale approach. Adv Agron 94: 135-179
Ayaga G, A Todd and PC Brookes. 2006. Enhanced biological cycling of phosphorus increases its availability to cropsin low input sub Saharan farming systems.Soil Biol Biochem 38: 81-90. Allen BL, AP Mallarino, JG Klat, JL Baker and M Camara.
2006. Soil and surface runoff phosphorus relationships for five typical USA Midwest soils. J Environ Qual. 35: 599-610.
Balai Penelitian Tanah. 2009.Petunjuk Teknis Analisis Kimia Tanah, Tanaman, Air, dan Pupuk edisi 2. Balai Penelitian Tanah. Bogor. 234 p. (in Indonesian).
Babu M, C Reddy and A Subramanyam. 2007. Effect of integrated use of organic and inorganic fertilizers on soil properties and yield of sugarcane. J Indian Soc Soil Sci55: 161-166.
Bubba MD, CA Arias and H Brix. 2003. Phosphorus adsorption maximum of sands for use as media in subsurface flow constructed reed beds as measured by the Langmuir isotherm.Water Res J37: 3390-3400. Casson JP, DR Bennett, SC Nolan, BM Olson and GR Ontkean. 2006. Degree of phosphorus saturation thresholds in manure amended soils of Aberta.J Environ Qual 35: 2212-2221.
Christine B. 2013. Uji Efektivitas Pupuk Organonitrofos dengan Pupuk Kimia terhadap Pertumbuhan, Serapan Hara, dan Produksi Tanaman Cabai Rawit Kathur (Capsicum frutescens) pada Tanah Ultisol Gedung Meneng. Skripsi. Fakultas Pertanian Universitas Lampung. 70 hal. (in Indonesian).
Diana G, C Beni and S Marconi. 2010. Comparison of adsorption isotherm equation to describe boron behavior in soils affected by organic and mineral fertilization.Commun soil Sci Plant Anal41:1112-1128. Delgado A, A Madrid, S Kassem, I Andrew and MC Carnpillo. 2002. Phosphorus fertilizer recovery from calcareous soils amended with humic and fulvic acids.Plant Soil 245: 277-286.
Dermiyati, SD Utomo, KF Hidayat, J Lumbanraja, S Triyono, H Ismono, N.E. Ratna, N.T. Putri, dan R. Taisa. 2016. Organonitrofos plus fertilizer test on sweet corn and changes of chemical properties of Ultisols.J Trop Soils21: 9-17.
Grant C, S Bittman, M Montreal, C Plenchette and C Morel. 2004. Soil and fertilizer phosphorus : effects on plant p supply and mycorrhizal development. J Plant Sci85: 3-14.
Handayani S. 1988. Perbandingan pengaruh bioearth dan blotong terhadap ketersediaan dan serapan, Nitrogen, Fosfor, Kalium serta produksi bahan
kering tanaman tebu(Saccharum officinarumL.)
pada Regosol (Tropopsamment, Krembung, Sidoarjo). Skripsi. Jurusan Tanah Fakultas Pertanian IPB. 55 hal (in Indonesian).
Helling CS, G Chester and RB Corey. 1964. Contribution of organic matter and clay to soil cation-exchange capacity as affected by the pH of the saturating solution.Soil Sci Soc Am J28: 517-520.
Hossain MD, MH Musa, J Talib and H Jol. 2010. Effects of nitrogen, phosphorus and potassium levels on kenaf (Hibiscus cannabinus L) growth and photosynthesis under nutrient solution. J Agric Sci2: 49-57.
Kang J, A Amoozegar, D Hesterberg and DL Osmond. 2011. Phosphorus leaching in a sandy soil as affected by organic and inorganic fertilizer sources.
Geoderma161: 194-201.
Kasno A. 2009. Response of maize plant to phosphorus fertilization on typic distrudepts. J Trop Soils14: 111-118.
Kaur T, BS Brar and NS Dhillon. 2008. Soil organic matter dynamics as affected by long term use of organic and inorganic fertilizers under maize- wheat cropping systems. Natr Cycl Agroecosys 81: 59-69. Laverdière MR and A Karam. 1984. Sorption of
phosphorus by some surface soils from quebec in relation to their properties.Commun soil Sci Plant Anal 15: 1215-1230.
Lumbanraja J. 2012.Geologi, Petrologi, dan Mineralogi Tanah. Penerbit Lembaga Penelitian Unila.191 hal (in Indonesian).
Lumbanraja J. 2017.Kimia Tanah: Prinsip dasar dan lingkungan. Penerbit Aura, Bandar Lampung, 297 hal (in Indonesian).
Lumbanraja J. 1995. Sorption behavior of phosphorus in acid soil of Ultisols: Effects of phosphorus sources and urea (in Indonesian).J Pen Pengb Wil Lahan Kering 15: 1-17.
Lumbanraja J, T Tadano, M Ninaki, K Oya, T Yoshida, M Utomo and AD Sitorus. 1981. Nutritional limitation factors for rice and corn growth on Podsolic Soils in Lampung Province. In: Y Asada (ed) Cooperation Research between DGHE and JSPS. Ehime University, Japan, pp. 118-124
Lumbanraja, J.,T. Tadano, M. Ninaki, K. Oya, T. Yoshida, M.Utomo, and A.D. Sitorus. 1982. The effect of nitrogen, phosphorus, and potassium fertilizers on
cassava growth on “Bandarjaya Podsolic Soil” and “Gedung Meneng Latosol Soil”. In: Y Asada (ed.)
Cooperation Research between DGHE and JSPS. Ehime University, Japan, pp. 112-122.
Lumbanraja J, S Djuniwati and M Murad. 1994. The influence of particle size and the type of iron concretions and compost on the availability of phosphorus in the clay fraction of an Ultisols and an Alfisols. J Pen Pengb Wil Lahan Kering
14: 12-27.
Lumbanraja J, S Mulyani, M Utomo and Sarno. 2017. Phosphorus Extraction from Soil Constituents Using Bray P-1, Mehlich-1 and Olsen Solutions.
J Trop Soils22: 67-76.
Malik MA, K Marchner and KS Khan. 2012. Addition
of organic and inorganic P sources to soil – effects
on P pools and microorganisms.Soil Biol Biochem
49: 106-113.
Manthambala F, JHA Maida, MW Lowle and VH Kabambe. 2016. Soil management effects on phosphorus sorption and external P requirement in oxisols of Malawi.J Soil Sci Environ Manage
7: 106-114.
Mohammad ZA, S Hoque and KT Osman. 2012. A comparison of the Langmuir, Freundlich and Temkin equations to describe phosphate sorption characteristics of some representative soils in Bangladesh.Inter J Soil Sci 7: 91-99.
Monhanty S, NK Paikarai and AR Rajan. 2006. Availability and uptake of phosphorus from organic manures in groundnut (Arachis hypogea
L.) sequence using radio tracer technique.
Geoderma 133: 225-230.
Morel C, N Ziadi and A Messiga. 2014. Modeling of phosp horus d yna mics in co ntra sti ng agroe cos yst ems us ing l ong te rm fie ld experiments.Can J Soil Sci94: 377-387.
Nugroho SG, Dermiyati, J Lumbanraja, S Triyono, H Ismono, YT Sari and E Ayuandari. 2012. Optimum ratio of fresh manure and grain size of phosphate rock mixture in a formulated compost for organomineral NP fertilizer.J Trop Soils17: 121-128.
Nugroho SG, Dermiyati, J Lumbanraja, S Triyono, H Ismono, MK Ningsih and FY Saputri. 2013. Inoculation effect of N-fixer and P-solubilizer in to a mixture of fresh manure and phosphate rock formulated as organonitrofos fertilizer on bacterial and fungal populations.J Trop Soils18: 75-80. Parfitt RL. 1978. Anion adsorption by soils and soil
materials.Adv Agron30: 1-50.
Prado RDM. 2010. Phosphorus effect in the nutrition and growth of developing mango plants.J Plant Nutr33: 2014-2049.
Reddy DD, SA Rao and M Sing. 2005. Changes in P fraction and sorption in an Alfisol following crop residues application. J Plant Nutr Soil Sci 168: 241-247.
Sari TP. 2015. Pengaruh Besi dan Bahan Organik Terhadap Jerapan Maksimum dan Energi Ikatan Fosfor pada Tanah Ultisol Natar. Skripsi. Jurusan Agroteknologi, Fakultas Pertanian, Universitas La mpung. B a nda r Lampung. 53 hal . ( in Indonesian).
Siddique MT and JS Robinson. 2003. Phosphorus sorption and availability in soils amended with animal manures and sewage sludge. J Environ Qual 32: 1114-1121.
Si ngh G, KW Go yne and J M Kab ric k. 201 5. Determinants of total and available phosphorus in forested Alfisols and Ultisols of the Ozark Highlands, USA.Geoderma Regional5: 117-126. Sing M, KS Reddy, VP Sing and TR Rupa. 2007. Phosphorus availability to rice (Oriza sativa L.)
–wheat (Triticum estivum L.) in a vertisol after eight years of organic fertilizer additions.Biorsour Technol 98: 1474-1481.
Soplanit M and R Soplanit. 2012. Pengaruh bokashi ela sagu pada berbagai tingkat kematangan dan pupuk SP-36 terhadap serapan P dan pertumbuhan jagung (Zea maysL.) pada Tanah Ultisol.J Ilmu Budidaya Tanaman1: 60-68.
Sparks DL. 1989.Kinetics of Soil Chemical Processes. Academic Press. INC. 210 p.
Susilo FX. 2013. Aplikasi Statistika untuk Analisis Data Riset Proteksi Tanaman. Anugrah Utama Raharja. Bandar Lampung. 168 hal. (in Indonesian). Syahputra E, Fauzi and Razali. 2015. Karakteristik sifat kimia sub grup Tanah Ultisol di beberapa wilayah Sumatera Utara.J Agroekoteknologi4: 1796-1803. Temegne CN, JM Taboula, P Nbendah, E Youmbi, VD Taffouo and GN Ntsefong. 2015. Effect of phosphate deficiency on growth and phosphorus content of three Voandzou (Vigna subterranean
(L.)Verdc.) varieties.J Agric Vet Sci 8: 52-59. T hom W O and M U tomo. 199 1. Ma n a j em en
Laboratorium dan Metode Analisis Tanah dan Tanaman. Penerbit Universitas Lampung. Bandar Lampung. 85 hal. (in Indonesian).
Utami SNH and S Handayani. 2003. Chemical properties in organic and conventional farming system.J Ilmu Pertanian 10: 63-69.
Utomo M, Sudarsono, B Rusman, T Sabrina, J Lumbanraja and Wawan. 2016. Ilmu Tanah: Da sa r -d a sa r d a n p en g elo la a n. P ene rb it Prenadamedia Group. 434 hlm.
van der Zee SEATM and WH van Riemsdijk. 1986. Sorption kinetics and transport of phosphate in sandy soil. Geoderma 38: 293-309.
van der Zee SEATM and WH van Riemsdijk. 1988. Model for long-term phosphate reaction kinetics in soil. J Environ Qual 17: 35-41.
45
J Trop Soils, Vol. 23, No. 1, 2018: 35-45Williams A, G Borjesson and K Hedlund. 2013. The effects of 55 years of different inorganic fertilizer regimes on soil properties and microbial community composition. Soil Biol Biochem 67: 42-46. Yang Y, L Kong and Z Zheng. 2014. Characteristics of
phosphorus adsorption and desorption /of soils from wetlands recovered from farmlands in Caizi Lake.Chinese J Appl Ecol25: 1063-1068.