INVESTIGATION ON PHYSICAL AND ELECTRICAL
PROPERTIES OF THE SiO2-ZnO NANOCOMPOSITE AT
DIFFERENT COMPOSITION MIXINGS
Moh. Sinol*, E. Rani
Department of Physics, Universitas Islam Negeri Maulana Malik Ibrahim Malang, Jl. Gajayana 50 Malang 65144
Received: 22th August 2017; Revised: 10th September 2017; Accepted: 20th October 2017
ABSTRACT
Physical and electrical properties of The SiO2-ZnO mixing at different compositions were investigated. The experiment used simple mixing method at the sintering temperature 600oC. It was used the composition mixing ratio of SiO2:ZnO ie. 0:10; 7:3; 5:5; 3:7; and 10:0 (%Wt). Based on X-Ray Diffraction (XRD) results, it obtained that a new phase in each sample was not formed even though having different diffraction peak. The mixing ratio of SiO2: ZnO nanocomposite (7:3 %wt) had the biggest grain size (77,92 nm), the highest dielectric constant (3.00E+05) and the smallest conductivity
(0,726549 (Ωm)-1). On the other side, the mixing ratio of SiO
2: ZnO nanocomposite (5:5 %wt) had the smallest grain size (35.42nm), dielectric constant (3.00E+2) and the highest conductivity (25.36729 (Ωm)-1). It can be concluded that the difference of composition ratio offered the change on both physical and electrical properties of SiO2-ZnO nanocomposite.
Keywords: The SiO2-ZnO Nanocomposite; Dielectric Constant; Conductivity.
Introduction
The development of semiconductor ceramic material technology recently has grown rapidly. It is indicated by the discovery of devices using semiconductor materials. In addition to its relatively easy manufacturing process, the semiconductor ceramic has some superior properties including corrosion resistance, high heat capacity, and high melting point. It also can act as an insulator, conductor, even superconductor. The thin layer technology has undergone many developments both in terms of manufacturing and materials used. In the thin film technology, polycrystalline metal-oxide materials have been widely applied in which defect properties of a material has been utilized.
One of metal oxide materials is zinc oxide (ZnO). ZnO has unique dual properties both as semiconductor and also piezoelectric. A crystalline ZnO has a hexagonal wurtzite
structure with lattice parameters a = 0.3296
and c = 0.520 65 nm. ZnO also has a direct
wide band-gap (3.37 eV) with the high exciton
binding energy (60 Me)1. Due to its
properties, ZnO proposes as a potential
candidate for various applications such as a
chemical sensor, photoluminescence, solar cell, photocatalyst, light emitting device2–6.
Recently, ZnO based nanocomposite
materials have dragged a special attention to exploring its interaction characteristics with ultraviolet (UV), visible emissions, white
light7, for example, SiO
2-ZnO
nanocomposite. SiO2-ZnO nanocomposite
was grown by using different techniques such as sputtering7, sol-gel2, spray-drying process8,
sonochemical methods9, photovoltaic10.
the other methods mentioned above, simple mixing.
Methods
The experiment was begun by preparing pure SiO2 and ZnO powder. these materials
were weighed using a digital balance Pioneer, Ohaus Corporation with 5 the mixing ratio of SiO2: ZnO ie. 0:10, 3:7, 5:5, 7:3 and 10:0 (%
wt). Furthermore, these SiO2: ZnO mixings
mixed with alcohol 96% using a magnetic stirrer with a constant speed of 300 rpm at temperature 80oC. After samples were
uniformly mixed, it was dried at room temperature until the perfect dried mixing powder reached. Next, it was heated to a calcination temperature of 600 ° C for 1 hour. The samples then analyzed by means of X-Ray Diffraction (XRD) test.
To investigate electrical properties of the samples, it was made pellets with diameter 1.025 cm under pressure 8 ton by means of machine press type Carver. The pellets were then heated to a temperature of sintering 1100
oC for 1 hour using a Furnace type Brother
XD-1700M. Both the surface of the Pellet was coated with Silver Electrode and tested using LCR Meter Fluke Type PM 6306.
Result and Discussion
X-Ray Diffraction
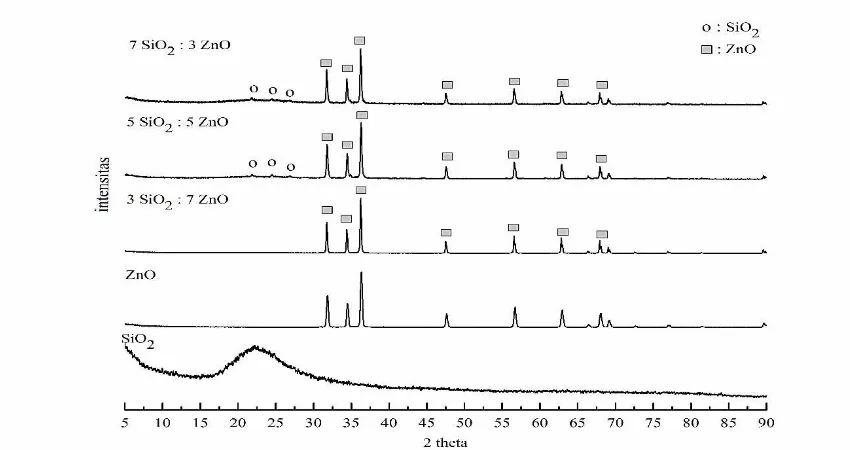
The XRD test used CuKα as sourced rays with a wavelength of 1.54098 Å. It obtained its test results for each sample as in by the figure 1.
Based on Fig. 1, SiO2 has an amorphous
structure and ZnO has a crystal structure. It can be noticed that the mixing process formed nanocomposite with the absence of new phase. The peak points of SiO2 seems to
appear on the mixing of 7SiO2:5ZnO and
5SiO2:5ZnO. The emergence of peaks at these
mixtures allegedly caused by the big amount of SiO2 added. Low-temperature calcination
considered as one of the factors the small peak of SiO2 or no peak in the sample in which interaction between SiO2 and ZnO was weak.
Search Match analysis presented that after the match between the standard data with the XRD graph of SiO2, cristobalite and quartz
appeared. Furthermore, the XRD patterns indicate the ZnO's highest peak at an angle θ 2:31.80, 34.45, 36.28, 47.56 and 56.61 which can be categorized in wurtzite crystal structure (hexagonal phase). On the composition maxing ratio of 7SiO2:3ZnO and 5SiO2:5ZnO
is clear that the peaks appear about 21 ° and 24 °. Moreover, the composition mixing ratio
Figure 1. XRD graph of the SiO2: ZnO nanocomposite at a calcination temperature 600oC with
of 5SiO2:5ZnO on 2 θ is about 21 °, 24°, and
26 °.
Using Fig. 1, the grain size of samples can be calculated using The Scherrer Formula by measuring the width by half the height of the highest XRD band. The Scherrer equation is written as follows
D = 𝑘 𝜆
𝛽 cos 𝜃 , (1)
where D is the grain size, k is the shape factor of crystallite, 𝜆 is the XRD wavelength, 𝛽 the line broadening at half the maximum intensity (FWHM), and cos 𝜃 is the Bragg angle. The grain sizes of the SiO2: ZnO nanocomposite
can be calculated using Eq. 1 and are written in Table 1
Table 1. The grain size of samples Sample Dmean (nm) 0 SiO2 : 10 ZnO 6,79
3 SiO2 : 7 ZnO 65,04
5 SiO2 : 5 ZnO 35,42
7 SiO2 : 3 ZnO 77,92
It is clear that the composition mixing of 7SiO2 : 3 ZnO has the biggest grain size. On
the contrary, The 5 SiO2: 5 ZnO has the
smallest grain size.
RCL meter analysis
Measurement of electric parameters yielded the resistance value (R), Dissipation
(D), Capacitance (C) and the impedance (Z) under the influence of frequency 1000Hz-1MHz and voltage 1 Volt.
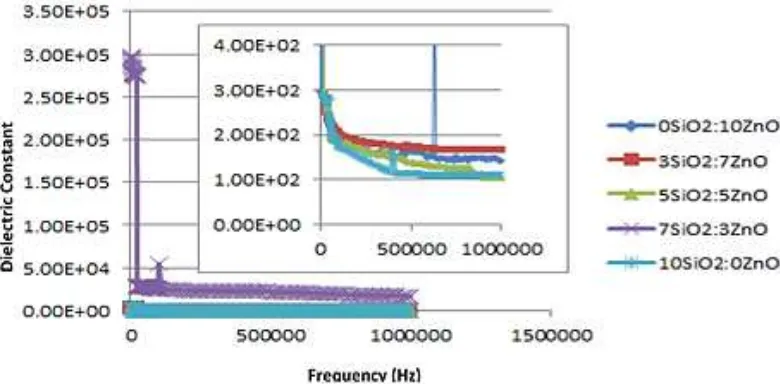
The relative permittivity or dielectric constant is the electrostatic flux density in a material when an electric potential is applied. Dielectric constant also indicates the ability of a material to dampen the intensity of electric field which passes through the material. This quantity is commonly expressed by εr.
Permittivity is strongly influenced by the amount of charge stored in a dielectric material. If a capacitor is filled with a dielectric material, then its properties can be analyzed using relative permittivity. The dielectric constant of the SiO2-ZnO
nanocomposite can be calculated using the following equation:
𝜀r = C d
ε˳ A (2)
where C is capacitance (F), d is the thickness of the sample (m), A is area (8,26 x 10⁻⁷ m2), ε˳ is permittivity in a vacuum (8,85x10⁻¹²
F/m). Real permittivity can be calculated using
𝜀𝑟′= 𝜀𝑟
2
ε˳ A , (3)
and Imaginary permitivity:
𝜀𝑟′′= 𝜀𝑟′ . D (4)
with D is dissipation factor which also indicates the power lost in a capacitor.
In Fig. 2, permittivity has a downward trend along with the increasing frequency. The increasing frequency directly effects on the electrical field oscillations in which oscillates faster. It makes some charges which are involved in redistribution process cannot keep the alteration of electric field direction up. It also can cause the polarization reduction. The highest permittivity is the 7SiO2: 7ZnO nanocomposite (3.00E+05) and
the smallest is the 5SiO2:5ZnO
nanocomposite (3.00E+02).
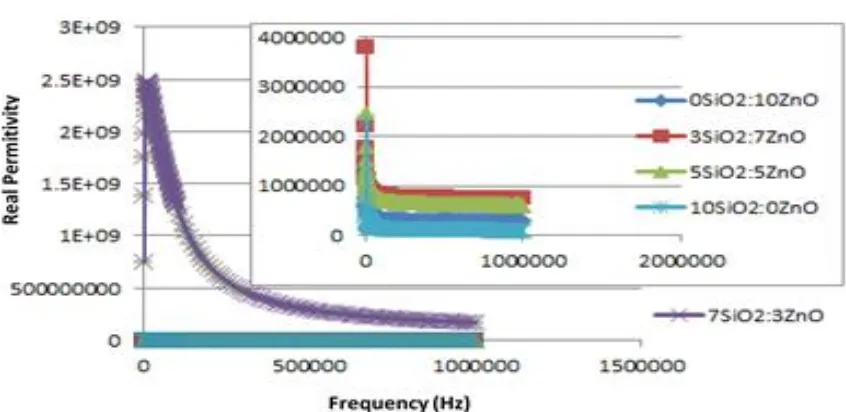
Dielectric constant has the real and the imaginary part. The real permittivity indicates the ability of materials to store the charge or electrical energy. When the real part is
positive, the phase shift is positive and the material has an intrinsically capacitative optical response. On the contrary, the real part is negative, the phase shift between electric and magnetic fields is negative and the material has an inductive optical response. The phase shift of samples under the various frequencies influence is given in Fig. 3
In Fig. 3, it figures out the positive phase shift of the samples. It can be said that all samples have an intrinsically capacitative optical response. The higher frequency indicates the smaller capacitive response. It is clear that the 3SiO2: 7ZnO nanocomposite has
the highest real permittivity 2.5E+09 and the smallest is the 5SiO2: 5ZnO (2.4 x 10⁶).
Figure 3. The influence of frequency toward real permittivity of the samples
Real Permitivity
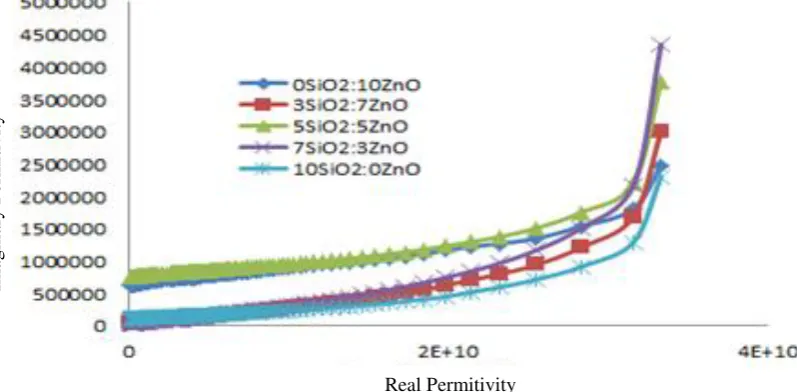
Furthermore, the imaginary part represents the energy losses as a consequence of polarization mechanism and responsible for the effective resistance. The imaginary permittivity of the samples which vary in different frequencies described in Fig. 4.
The imaginary permittivity in Fig. 4 also has a downward trend along with the increasing frequency. The highest permittivity is the 7SiO2:3ZnO nanocomposite (3.3E+10)
and the smallest is the 3SiO2:7ZnO
nanocomposite.
The real permittivity which is plotted against the imaginary permittivity produces a semi-circle radius which is well-known as a cole-cole plot. Theoretically, a cole-cole plot indicates the relaxation times of a dielectric material. If a cole-cole plot has a perfect semi-circle shape, it is found that a dielectric material has a short relaxation time. This mechanism indicates a single polarization occurred in a dielectric. The plot between the
real permittivity and imaginary permittivity is figured as in Fig. 5
Based on Fig. 5, the 7SiO2:3ZnO
nanocomposite mixing has much better the semi-circle shape than others. This indicates that the sample requires a longer relaxation time in which describing dipoles reorientation into the initial state. For other samples, the 5SiO2:5ZnO and 3SiO2:7ZnO has also good
semi-circle shapes, but the 3SiO2:7ZnO
provides the shortest relaxation time by comparing its imaginary permittivity.
Electrical conductivity is an intrinsic property of the material to conduct electrical current flow. Using the electrical conductivity value, it can be determined a material categorized as an insulator, conductor or semiconductor. The electrical conductivity is calculated using the equation as follows:
σ =𝜌1 = 𝑙
𝑅𝐴 (5)
where σ is the electrical conductivity (Ωm)-1,
ρ is the electrical resistivity (Ωm), 𝑙 is the
The composition ratio of SiO2 : ZnO nanocomposite
El
Figure 5. The relation between real permittivity and imaginary permittivity of samples
distiant between the two measurement points, R is resistance (Ω), A is the capasitor area (m2).
Using Eq. (5), the electrical conductivity of samples can be determined. It is figured out in the Figure 6:
It appears in Fig. 6 that the 5SiO2: 5ZnO
has the highest the electrical conductivity (25.36729 (Ωm)-1) and the lowest one is the
7SiO2: 3ZnO which is the amount of 0.726549 (Ωm)-1. Comparing to Table 1, it can
be noticed that there is a relation between the grain size and the electrical conductivity. If the mixing sample has a smaller grain size, it possesses the higher electrical conductivity but the smaller dielectric constant. This the composition mixing alter the physical properties and electrical properties of the SiO2: ZnO nanocomposite material. There is
new phase formed in each sample. It obtained the 7SiO2: 3ZnO amount of has the highest
grain size (77.92 nm), the highest dielectric constant, the highest imaginary permittivity and the longer relaxation time. But it has the smallest conductivity (0.726549 (Ωm)-1).
Moreover, the 5SiO2: 5ZnO has the smallest
grain size (35,42 nm) and the highest conductivity (25.36729 (Ωm)– 1). The 3SiO
2:
7ZnO has the lowest dielectric constant and the lowest imaginary permittivity.
References
1. Z. L. Wang. Zinc oxide nanostructures: growth, properties, and applications. J. Phys. Condens. Matter. Jun. 2004;16(25) :R829–R858,.
2. A. M. Ali, F. A. Harraz, A. A. Ismail, S. A. AlSayari, H. Algarni, and A. G. Al-Sehemi. Synthesis of amorphous ZnO– SiO2 nanocomposite with enhanced
chemical sensing properties. Thin Solid Films. Apr. 2016; 605:277–282.
3. F. A. Harraz, A. A. Ismail, A. A. Ibrahim, S. A. Al-Sayari, and M. S. Al-Assiri, Highly sensitive ethanol chemical sensor based on nanostructured SnO2 doped ZnO
modified glassy carbon electrode. Chem. Phys. Lett., Oct. 2015;6399Supplement C):238–242.
4. J. Huang, Z. Yin, and Q. Zheng. Applications of ZnO in organic and hybrid solar cells. Energy Environ. Sci. Sep. 2011. 4(10):3861–3877.
5. K. M. Lee, C. W. Lai, K. S. Ngai, and J. C. Juan. Recent developments of zinc oxide based photocatalyst in water treatment technology: A review, Water Res. Jan. 2016; 88(Supplement C):428– 448.
6. S. J. Pearton and F. Ren. Advances in ZnO-based materials for light emitting diodes. Curr. Opin. Chem. Eng. Feb. 2014 3(Supplement C):51–55,
7. Y.-Y. Peng, T.-E. Hsieh, and C.-H. Hsu, White-light emitting ZnO–SiO 2 nanocomposite thin films prepared by the target-attached sputtering method. Nanotechnology. 2006.17(1);174,
8. N. Hagura, T. Takeuchi, S. Takayama, F. Iskandar, and K. Okuyama. Enhanced photoluminescence of ZnO–SiO2
nanocomposite particles and the analyses of structure and composition. J. Lumin. Jan. 2011;131(1):138–146.
9. W. Widiyastuti, S. Machmudah, T. Nurtono, S. Winardi, and K. Okuyama. Synthesis of ZnO-SiO2 nanocomposite
particles and their characterization by sonochemical method. AIP Conf. Proc., May 2017;1840(1):080008.