SLOW MOVING ITEMS INVENTORY POLICY UNDER POISSON DISTRIBUTION
DEMAND DESIGN IN YOGYAKARTA CENTRAL WAREHOUSE OF PT. KERETA
API INDONESIA FOR MINIMIZING TOTAL RELEVANT COST INVENTORY USING
CONTINUOUS REVIEW (s,Q) METHOD
Bernanda Tricahyo1, Ari Yanuar Ridwan2, Meldi Rendra3
1,2,3
Bachelor Program of Industrial Engineering, Industrial Engineering Faculty, Telkom University 1[email protected]
, 2[email protected], 3[email protected]
Abstract
PT. Kereta Api Indonesia (Persero), hereafter PT KAI (Persero) is the biggest railway industry in Indonesia, in terms of inventory, the company must be dealing slow moving item. As of 2015 the slow moving value worth IDR 70 billion and practically reached 0.8 million items. The suggested model continuous review (s,Q) under poisson distribution data over lead time was performed in one of PT KAI’s central warehouses by using two- stage spare parts classification, Yogyakarta Central Warehouse (GPYK) that determines the optimal order size and reorder point to reduce annual total relevant cost (TRC) inventory along with CSL or cycle service level and fill rate. The percentage of reduced annual six SKUs TRC is up to 52% from existing TRC or gained to be exact IDR 4.1 million of savings, resulting the average percentage of CSL and fill rate as much as 98%.
Keywords: Slow Moving Item, VED Classification, Poisson Distribution, Continuous Review (s,Q), Cycle Service Level, Fill Rate, Total Relevant Cost TRC.
1. Introduction
The existence of inventory in daily activity cannot be avoided whether in personal activity, household, social, or business activity. Inventory can be categorized as working capital in goods form. Its existence can be considered as liability because it is a waste, but also can be asset that has cash value [1].
The term of inventory is usually used in business realm such in manufacturing. Inventory in a business organization can be categorized as capital in form of goods, most the inventory in railway industries type are spar e parts, which consumes cost in holding inventory.
PT. Kereta Api Indonesia (Persero), hereafter PT KAI (Persero) or “Company”, is a State-owned Enterprise that provides, organizes, and manages railways transportation services in Indonesia, PT KAI (Persero) operates the rail transportation services including passenger and freight. As the major operator of public railways in Indonesia, PT. KAI (Persero) has the largest infrastructures and facilities compared to other transportation services. To support the operational day-to-day, as of 2012, current PT KAI (Persero) have had facilities such as locomotives as much as 486 units, the units carriages 1716, hopper for goods transportation 6249 units, Electric Rail Train (KRL) 754 units, and a Diesel Railcar 166 units, while infrastructures such as rail road owned by PT KAI (Persero) were currently 2710 miles along Java Island and 1151.5 miles along the island of Sumatra. The condition of railway infrastructures and facilities requires treatrment in order to support the operation of the railway, so the reability of facilities and infrastructures can sustain the company in serving customers/users.
Comparison On Hand Inventory
Comparison of Overstock and Out
of Stock Supplies of All SKUs
600
Figure 1 Slow Moving Value Yogyakarta Central Warehouse of PT KAI 2010 and 2015 (Source: PT KAI financial report)
The figure 1 above describes there was a slightly increase of slow moving items value, the worst case of keeping slow moving items for long period of time is categorizing them into scrap (dead inventory) which will be tendered with selling price no more than 10% of purchasing price. The data below presents the comparison of slow moving items value exists in GPYK (Yogyakarta Central Warehouse) of PT Kereta Api Indonesia and others warehouses.
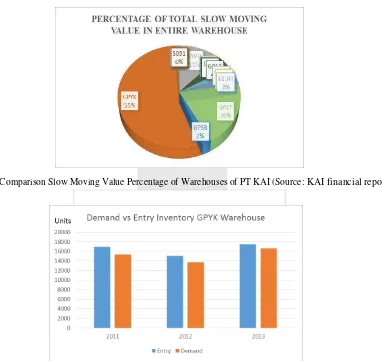
Figure 2 Comparison Slow Moving Value Percentage of Warehouses of PT KAI (Source: KAI financial report)
Figure 3 Demand vs Entry inventory of GPYK Warehouse (Source: Warehousing and Inclaring Manager of PT KAI)
Drugs and Medical Equipment Data Demand, Sales, and
Price
ABC-VED Classification
1. Electricity 1. Labor 2. Labor
2. Administration 1. Lost Sales 3. Facility
3. Facility 4. Maintenance
Shortage
Holding Cost Order Cost Cost Lead Time
Determination of
I Priority Order Quantity, II Priority Reorder Point,
Safety Stock
Total Inventory Cost
Periodic Review
Inventory Policy Joint Replenishment (R,s,S) Model
.
2. Inventory Policy for Yogyakarta warehouse of PT KAI
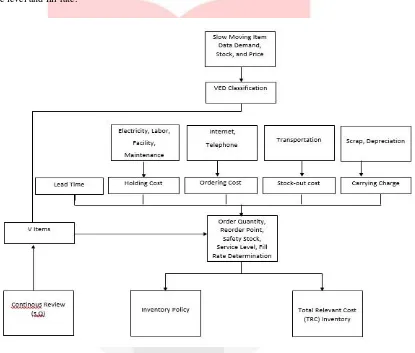
Data needed in this research are demand of slow moving item, demand, stock, and price. Those data are then to be used as input for policy calculation. First, slow moving item data are classified into VED classification then V classification will be used to calculate total relevant cost inventory by using continuous review (s,Q) model. Expected output from calculation is inventory policy which is appropriate quantity, reorder point, total relevant cost inventory, cycle service level and fill rate.
Figure 4 Conceptual Model of Research
2.1 VED Item Classification
The importance of managing vital inventory is really needed, classifying slow moving item data into VED can is done by the company.The result number of SKUs of each category as follows:
Table 1 Two-stage Item Classification
2.2 Continous Review (s,Q) Model
Parameter definition:
𝐿
H: Inventory holding costs per unit time for single spare parts. r: Internal interest rate.
V: Unit value.
D: Expected annual demand of spare parts. L: Lead time
s: Reorder point
µL: Average demand in lead time. A: Ordering costs for placing an order. SS: Safety stock.
ES: Expected number of stock-outs in a cycle. P: Probability.
Q: Order size. Q*: Optimal order size.
σ: Standard deviation of annual demand distribution function. P1: Service level which is the probability of not having a stock-out.
P2: Service level which is the fraction of demand to be satisfied routinely from shelf. TRC: Expected annual total relevant cost.
1. Average Demand in Leadtime
determining how much of a year the LT represents
� ��𝐿 =
365 . 𝐿
So to get the average demand over the lead time, by summing up the average demand of each day of the LT. Since all the days are assumed to be the same and just multiply the daily average by the number of days.
2. Mathematical Model
Probability of an outcome of x when expected demand in lead time is variance.
1. Probability of an outcome of x when expected demand in lead time is variance:
𝜇 𝑥 −��𝐿
�(�|��𝐿) =
�! . � , �€ {0,1,2,3,4, . . }
2. Indifference between reorder point (s) and (s+1) when Q>1:
For such a case the indifference useful for selecting appropriate reorder point. The case of Q ≥ 1 and a
�1 cost structure, indifferent between s and s+1 as reorder points when
�(� + 1|��𝐿)
Carrying charge is a component in the formula for determining the order quantity. According to Johnsson (2005) the formula can be used to calculate the carrying charge.
�𝑎��������ℎ𝑎��� = ∑�����𝑐������𝑎𝑙 + ����∑����𝑎��𝑎������ 𝑐���𝑎�� + ∑��������𝑐���𝑎�����
𝑉𝑎����
2. Critical Ratio
SKU Existing
3421663.82 1362647.45 2059016.37 60%
KIT6TH_PACC201_
190XCC201_1
666817.60 484002.11 182815.48 27%
KIT6TH_PACC201_
190XCC202_1
1426725.48 804502.72 622222.76 44%
KIT6TH_PACC203_
190XCC203_1
667137.07 614563.34 52573.73 8%
BATTERY_LOKOMOTIF_
DIESEL_ELECTRIC
1168283.99 531625.95 636658.04 54%
GOVERNOR_ELECTRIC_
CC201_GE7FDL8MFI
1051856.88 531625.95 520230.93 49%
Total 12,278.39 4,328,967.52 4,073,517.31 52%
�� = ���𝑉�
1
3. Safety Stock
Safety stock equals to remaining stock for outcomes multiplied by corresponding demand probability. Therefore, safety stock is
𝑠
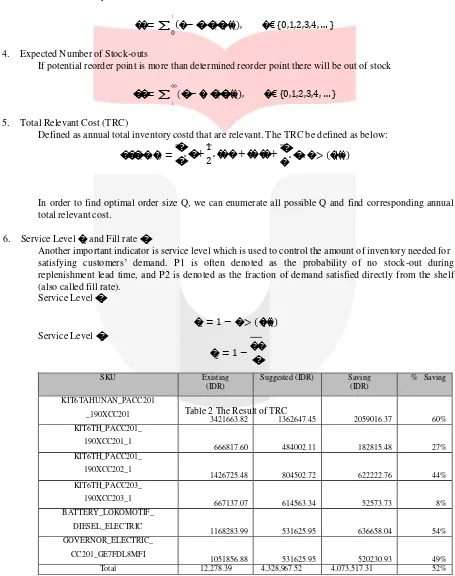
�� = ∑ (�−�) �(�| ��𝐿), �€ {0,1,2,3,4, … } 0
4. Expected Number of Stock-outs
If potential reorder point is more than determined reorder point there will be out of stock
∞
�� = ∑ (�−�) �(�| ��𝐿), �€ {0,1,2,3,4, … } 𝑠
5. Total Relevant Cost (TRC)
Defined as annual total inventory costd that are relevant. The TRC be defined as below:
��� (�, �) = �. � +
� 1 2 . ��. � + ��. �� +
�
�. �1 . � > (�|��𝐿)
In order to find optimal order size Q, we can enumerate all possible Q and find corresponding annual total relevant cost.
6. Service Level �1 and Fill rate �2
Another important indicator is service level which is used to control the amount of inventory needed for satisfying customers’ demand. P1 is often denoted as the probability of no stock-out during replenishment lead time, and P2 is denoted as the fraction of demand satisfied directly from the shelf (also called fill rate).
3. Discussion
Data needed in this research are demand of slow moving and the price, VED classification data, lead time, holding cost, and order cost. Those data are then to be used as input for policy calculation. First, data of slow moving are classified into VED classification of V item will be executed with (s,Q) policy.
4. Conclusion
By using continuous review (s,Q),the improvement for 6 SKUs of V items is 52 % or IDR 4,073,517.31.
References
1. Molenaers, A., et al., Criticality classification of spare parts: A case study. International Journal of Production Economics, 2012. 140(2): p. 570-578.
2. Liuming, D., 慢速流动备件库存模型研究Research on inventory model of slowmoving spare parts. 博士学位
论文Doctoral thesis, 华中科技大学HuaZhong University of Science and Technology, 2006: p. 4-6 3. Dekker, R., M.J. Kleijn, and P.J. de Rooij, A spare parts stocking policy based on equipment criticality.
International Journal of Production Economics, 1998. 56–57(0): p. 69-77.
4. Silver, E.A., D.F. Pyke, and R. Peterson, Inventory management and production planning and scheduling. 3 ed. Vol. 3. 1998, New York: John Wiley & Sons.
5. Pinçe, Ç. and R. Dekker, An inventory model for slow moving items subject to obsolescence. European Journal of Operational Research, 2011. 213(1): p. 83-95.
6. Johnston, F.R., J.E. Boylan, and E.A. Shale, An examination of the size of orders from customers, their