System Dynamic Models As A Basis Strategy Development
of Tin Ore Production Optimization Case Study: Indonesia Tin Mining Company
Sujoko
Jann Hidajat Tjakraatmadja School of Business and Management
Bandung Institute of Technology
Abstract: This study is a case study on a tin mining company in Indonesia. The core business of this company is Tin Business. Amount of tin ore production is key success factor for this business. Tin ore production system is a fairly complex system, always changing along with the changing times and the environment change either internal or external environment. This system characterized by dynamically. Thus tin ore production system is dynamic system. Referring to that in this study used system dynamic model as a tool to evaluate and develop strategy to improve optimization of tin ore production. Tin ore production systems consist of two types, there are legal mining and illegal mining. Tin ore production systems are affected by some reinforcing systems and some balancing systems. Legal mining production System characterized by limits to growth, while the illegal mining production system characterized by tragedy of common. The main factors affecting the company performance are the tin price and tin resources. Both of these factors are difficult to control by the company. Thus, strategy development for optimizing tin ore production can be performed on other variables that can be controlled by the company. Company performance in the future depend on level of company ability in optimize production. In this study will be built a model using system dynamic method. The target is to finding important factors in the tin ore production system and how relation between the factors, then it’s can be find of strategy formulation to production optimization. With this effort are to sustainability and growth of the company can be assured.
Keywords: strategy development, tin ore production optimization, system dynamic model
Abstrak: Penelitian ini mengambil studi kasus pada sebuah perusahaan penambangan timah di Indonesia,
dimana bsnis pertimahan merupakan bisnis utama dari perusahaan tersebut. Jumlah produksi bijih timah merupakan faktor kunci keberhasilan dari bisnis ini. Sistem produksi bijih timah merupakan suatu sistem yang cukup komplek yang selalu berubah seiring dengan perubahan waktu danterjadinya perubahan lingkungan baik internal maupun eksternal. Dengan demikian sistem produksi bijih timah merupakan sistem yang dinamik. Sehubungan dengan hal tersebut maka dalam penelitian ini menggunakan ”System Dynamic Models” sebagai alat untuk mengevaluasi dan melakukan pengembangan strategi dalam rangka optimalisasi produksi bijih timah. Sistem produksi bijih timah yang ada saat ini terdiri dari dua jenis yaitu penambangan legal dan penambangan illegal. Sistem produksi bijih timah dipengaruhi oleh beberapa sitem pengembangan (
reinforc-ing system) dan sistem penyeimbang (balancing system). Pada sistem penambangan legal dicirikan oleh
adanya limit to growth, sedangkan pada penambangan illegal dicirikan oleh adanya tragedy of common. Faktor utama yang mempengaruhi kinerja perusahaan adalah harga timah dan jumlah cadangan timah yang dimilikinya. Kedua faktor tersebut merupakan factor yang sulit dikendalikan oleh perusahaan, sehingga dalam pengembangan strategi untuk optimalisasi produksi dapat dilakukan dengan pada faktor-faktor atau variabel
Alamat Korespondensi:
lain yang bisa dikendalikan oleh perusahaan. Kinerja perusahaan di masa depan sangat tergantung pada kemampuan perusahaan dalam melakukan optimalisasi produksinya. Dalam studi ini dibangun sebuah model dengan menggunakan metoda sistem dinamik, dengan tujuan untuk mengetahui faktor-faktor penting yang ada di dalam sitem produksi bijih timah dan untuk mengetahui bagaimana hubungan antar faktor tersebut, sehingga bisa didapatkan formulasi strategi produksi yang optimum. Dengan usaha ini diharapkan kelangsungan hidup dan pertumbuhan perusahaan dapat tercapai.
Kata Kunci: pengembangan strategi, optimalisasi produksi bijih timah, system dynamic model
Tin mining activities in Indonesia has been started since the 18th century (1709) by way of traditional
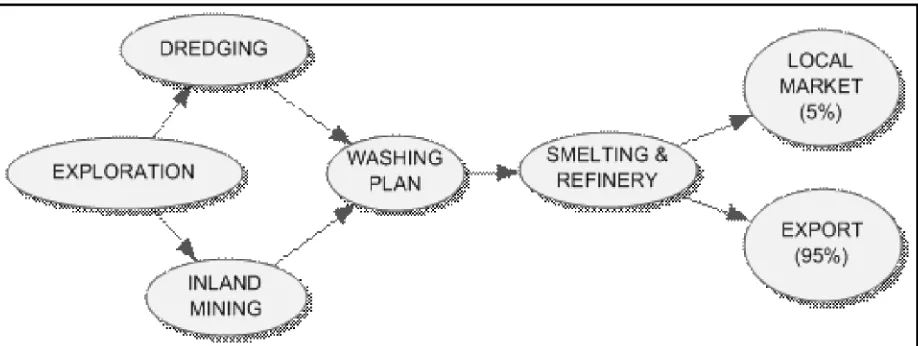
mining as hoe mine (Sujitno: 2007). This study was conducted at one of the companies engaged in the tin business in Indonesia. Tin ore production comes from two sources, from its own mines and from the partners (third party) mines. The company specializes in inte-grated tin business activity starting from exploration, mining, processing, refining, smelting and marketing of product. Here is the flow diagram of tin business process.
companies did not succeed to minimize the illegal mining activities.
Business issues in the last five years (2008 -2012) among others : the trend of decreasing of the tin ore production, degradation of tin resources, high dependence on supplies of tin ore from partners (third party) mines; and illegal mining activities.
Degradation trend of tin resources caused by discovery of new resources is lower than the total tin ore production. Beside caused by itself mining activity, degradation the amount of tin resources is also triggered by illegal mining activities. Performance of tin ore production will face serious problems if the
Figure 1. Flow of Tin Business Process
Figure 2. Off shore Illegal Mining
Dynamic system of tin ore production is strongly influenced by changes in both of the external and internal environment, that is increasingly complex. It is a challenge for The Company, how companies can adapt to such changes to ensure corporation sustainability and growth. This study is an effort to help the company overcome it.
METHODOLOGIES
Method that become reference in corporate strategy development is System Dynamics, which can be defined as a method that uses the characteristics of the feedback information in a system and use of the model to enhance organizational design or strategy development. Some fundamental elementary bodies in system dynamic are feedback loops, level and rate (Forester, 2001, 5–7).The performance of a system can be represented in the model stock flow diagrams (SFD). The performance of a system is performance feedback or closed loop relationship, which has two generic form of relations feedback loop, namely: reinforcing and balancing” (Atmoko, 2011:37). Feedback loops is the essence of system, without feedback there is no system. (Forrester, 1961:27–32 in Atmoko, 2011).
Conceptual Framework
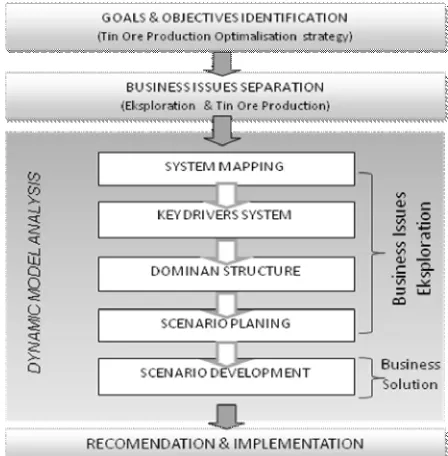
According to Sushil (1993) in Handoko (2009: B83) methodologies step in the system dynamic consist of 6 steps there are identifications and problem definition system conceptualization, model formulation, simulation and model validation, policy analysis and development, policy implementation. Conceptual framework that used in this study can be seen in the following chart figure 4.
Data Collection Method
The data used for analysis in this study consist of primary data and secondary data. The primary in the form of direct observation data in the field and interviews data (formal and informal), while secondary data in the form of articles, news and company data reports over the last five years (2008-2012) both published and unpublished.
System Dynamic Models of Tin Ore Production
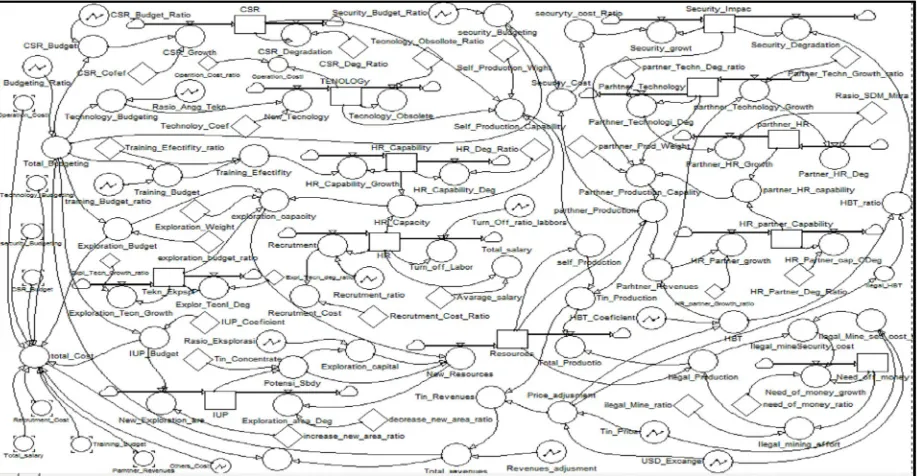
The dynamics of tin ore production system can be seen from the internal side (legal mining activities) and from the external side (illegal mining activities). From the internal side is essentially a dynamics of internal company system in creating income (revenue), it is directly related to the amount of tin ore production. Meanwhile, from the external context is the presence of interference from outsiders. The disorders are the illegal mining activities in the region of The Company mining concession (IUP), therefore resulted in a decrease in the amount of tin resources. Causal relationships in tin ore production system can be described in a causal loop diagram (CLD) map as follows.
Source of tin ore production consist of two types. Production from the company’s mine and production from partners mine. Factors influence the ability of tin ore production from the itself mines, among others: the level of technology, the ability of HR, community support and the availability of tin resources, in the meantime the tin ore production from the partners mine are strongly influenced by capability of technology, the ability of human resources, the ability of the security and Tin resources.
In general, the tin ore production system influenced by the dynamics of growth and balancing system. As for, which it’s included in the growth system are human resources sub system, technology, CSR, exploration and security. While it’s included in the balance system are the limited amount of tin resources, the risk of loss of ore from third parties mine and the limited area of exploration.
It outlines the characteristic of legal mining activity is a-limit to growth, while in the illegal mining activities characterized by the tragedy of common. Thus, generally tin ore production decreased caused by the presence of counter-productive system of growth system and endless tin resources due to increased competition in the production activity between The Company and illegal mining.
To get maximal simulation result then has been conducted validation test to model referred. Validation test is conducted by compare to value of simulation result from some variables that have secondary data with data actual, or called AME (Average Means Error), theoretically model by value AME up to 10% then model are acceptable, (Barlas, 1996 in Atmoko 2011). Here are the results of the model validation test.
Table 1. Data of Validation Test (AME) System Dynamic Model Tin Ore Production
Figure 9. Revenue
Intervention Test is conducted to know key drivers from dynamics of tin ore production system. Intervention Test is conducted by enhance 10% from value in each causative elementary body this system becomes dynamic. Elementary Variable taken as reference at simulation this is the variable of revenues and profit. In each simulation conducted difference calculation between value of simulation result and the initial value at revenues variable and profit variable. The result of calculation are referred [as] multiplied by predetermined weighting, where revenues difference is given weight 35%, whereas for profit difference given weight 65%. Influence value to profit variable given higher weight is compared to influence value at revenues variable, this is done in order to reduce distortion cost in raising revenue. Following is formula that used to calculate influence value in each variable:
NP = 0.35*(Rm-Ra) + 0.65*(Pm-Pa) NP : Influence value
Pm : Value profit after intervention Rm : Value revenue after intervention Pa : Value profit before intervention Ra : Value revenue before intervention
Based on the results of intervention test shows that the factors that most affect to the company performance are the price of the metal and the exchange rate of the Rupiah against the U.S Dollar, but both of these factors are beyond the control of the Corporation. The next important factor is the ability of it’s own production, the production capacity of partners, and disruption of illegal mines. The presence of uncontrolled illegal mines are very influence a reduced rate of tin resources (quantity been systematically mapped and performed quantification has 119 elements and 131 the complexity of the interconnections. Based on the model can identified 29 factors causatives tin business becomes dynamic.
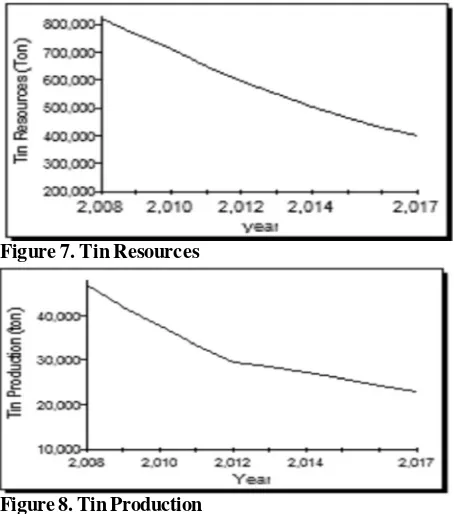
Following picture are the company performance, it’s resulted from simulation with based model.
Figure 7. Tin Resources
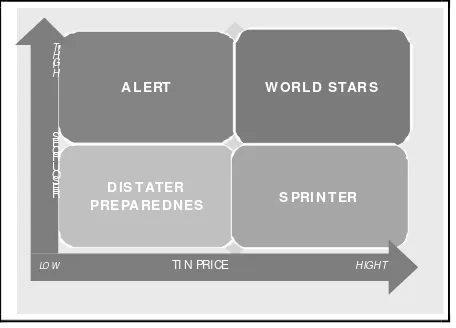
Scenario Planning is designed to take two aspects of the key drivers that have been identified. The first aspect is an aspect that has difficulty to be controlled by the company so that uncertainty level is high, while the second aspect is that is easily controlled by the company. As for that entered in first group is variable of tin price and tin resources. Whereas that entered in second group is other variables those included in supporting production system for example: technology, security, self production, partner production, exploration and human resources.
The first group price of tin and tin resources, forming four possible scenarios caused by the two poles of the paradox of both. The second group is used as a strategic synthesis of the key drivers to face every possible scenario or strategy development.
Interventions can be made to the existing loops in the system dynamics of tin ore production, both on loops system that shows the growth (reinforcing loops) and loops system that shows the balance (balancing loops).
Intervention efforts that can be conducted by improve influence value at variables that have positive influence to revenues and profit, and degrade influence value at variables that have influence negative to revenues and company profit.
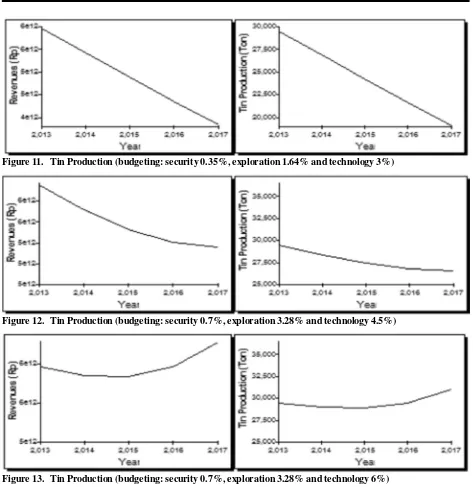
Following are examples the results of a simulation using dynamic system models with different policies on the percentage of budgets security, exploration budgets and the budget of technological updating. While the price and the exchange rate remains assumed equal to price and exchange rate in 2012.
Conclusion and Recommendation
with the changes that occur in the tin business. If the company does not make changes to the pattern of production, the company will continue to decline in production. As a result the company’s financial performance will declineIn order to ensure the sustainability of the com-pany, there are three main sub-systems as the key success of the company to develop tin ore production optimization strategies, there are:
• Optimization of security capabilities, consists of: the minimization of illegal mining activities, the use of technology for improving security, increas-ing the ability of security personnel
• Maximizing of new tin resources. The steps can be done at, among others: the intensification of exploration activities and additional exploration areas
• Maximizing tin ore production from its own mines. This effort can be done by increasing employee production capabilities, the addition and updat-ing of minupdat-ing technology, improved partnerships or CSR program, and a total mining.
Success in managing these three factors could ensure it’s survival, while if a failure in the
A LERT W OR L D STAR S
Figure 11. Tin Production (budgeting: security 0.35%, exploration 1.64% and technology 3%)
Figure 12. Tin Production (budgeting: security 0.7%, exploration 3.28% and technology 4.5%)
Figure 13. Tin Production (budgeting: security 0.7%, exploration 3.28% and technology 6%)
management of the company can experience of most worst condition that is bankruptcy.
This model can help management to take decision quickly that relied on simulation result of company performance in the future. To get simulation that more detail and more accurate, suggested to make dynamics model particularly at human resources, security, illegal mining activities and partnership mining.
BIBLIOGRAPHY
Atmoko, A.W. 2001. Dinamika Knowing Organization Model Organsasi Adaptif untuk Lingkungan Dina-mis. Jakarta: Yayasan RABI.
Sujitno, S. 2007. SejarahPenambangan Timah di Indonesia
abad 18–Abad 20. PT Timah (Persero), Tbk.
Breierova, L., et al. 2001. An Introduction to Sensitivity
Analysis, System Dinamic in education Project,
Sys-tem Dynamic Group, Sloan School of Management, Massachusett Institute of Technology.
Figure 16. Tin Production (budgeting: security 1.05%, exploration 3.28% and technology 6%) Figure 15. Tin Production (budgeting: security 1.05%, exploration 3.28% and technology 4.5%)
Forrester, J.W., et al. 2005, Road Map A Guide to
Learn-ing System Dynamic, System Dynamic in education
Project, System Dynamic Group, Sloan School of Management, Messachusett Institute of Technology. Charles, M.S. 2012, Lemahnya Penegakan Hukum terha-dap Pelaku Pertambangan Ilegal di Bangka Belitung, Akibat Ulah Cukong Bermodal Tebal Yang
Dibekingi oleh Aparat Penegak Hukum, http//
ekonomi.inilah.com/read/detail/182.587/URL TENAGE
Fahiya, A. 2013, Modus Baru dalam Penambangan Timah
Ilegal, http//regional.kompasindo.com/2013/ 01/10.
Handoko, M., dkk. 2009, Perencanaan Model Sistem Ana-lisis Kinerja Keuangan Perusahaan (Pendekatan
system Dinamik), http//jurnal.uii. ac.id/index.php/
snati/artcle/view/ 1080
Jumpo, J. 2010. Para Cukong Tambang Ilegal Harus
Ditangkap, http/www.Tekmir a. esdm.go.id/
currentissues/?p=2872
Radar, N. 2012. Oknum PNS Bekingi Tambang Ilegal TI
Rajuk, http// www. Radarnusantara.com/ 2013/ 02/