98
ANALYSIS RESOURCE AWARE FRAMEWORK BY COMBINING SUNSPOT AND IMOTE2 PLATFORM WIRELESS SENSOR NETWORKS USING DISTANCE VECTOR ALGORITHM
Muhammad Ilyas Syarif1, Andi Wawan Indrawan1, Jumadi M. Parenreng2, Supeno Djanali3, and Ary Masharuddin Shiddiqi3
1
Electrical Engineering, Politeknik Negeri Ujung Pandang, Jl. Perintis Kemerdekaan Km. 10, Makassar, 90245, Indonesia
2
Universitas Negeri Makassar, Jl. Dg. Tata, Makassar, 90224, Indonesia 3
Informatics Engineering, Institut Teknologi Sepuluh November, Jl. Raya ITS - Gedung Teknik Informatika, Surabaya, 60111, Indonesia
E-mail: [email protected]
Abstract
Efficiency energy and stream data mining on Wireless Sensor Networks (WSNs) are a very interesting issue to be discussed. Routing protocols technology and resource-aware can be done to improve energy efficiency. In this paper we try to merge routing protocol technology using routing Distance Vector and Resource-Aware (RA) framework on heterogeneity wireless sensor networks by combining sun-SPOT and Imote2 platform wireless sensor networks. RA perform resource monitoring process of the battery, memory and CPU load more optimally and efficiently. The process uses Light-Weight Clustering (LWC) and Light Weight Frequent Item (LWF). The results obtained that by adapting Resource-Aware in wireless sensor networks, the lifetime of wireless sensor improve up to ± 16.62%.
Keywords: distance vector, resource-aware, light weight clustering, light weight frequent item, sunspot, imote2
Abstrak
Efisiensi energi dan streamdata mining pada Wireless Sensor Networks (WSN) adalah masalah yang sangat menarik untuk dibahas. Teknologi Routing Protocol dan Resource-Aware dapat dilakukan untuk meningkatkan efisiensi energi. Dalam penelitian ini peneliti mencoba untuk menggabungkan teknologi Routing Protocol menggunakan routing Distance Vector dan Resource-Aware (RA) framework pada Wireless Sensor Networks heterogen dengan menggabungkan sun-SPOT dan platform Imote2 Wireless Sensor Networks. RA melakukan proses pemantauan sumber daya dari memori, baterai, dan beban CPU lebih optimal dan efisien. Proses ini menggunakan Light-Weight Clustering (LWC) dan Light Weight Frequent Item (LWF). Hasil yang diperoleh bahwa dengan mengadaptasi Resource-Aware dalam Wireless Sensor Networks, masa pakai wireless sensor meningkatkan sampai ± 16,62%.
Kata Kunci:distance vector, resource-aware, light weight clustering, light weight frequent item, sunspot, imote2
1. Introduction1
Today Wireless Sensor Networks (WSNs) have been inplemented in high speed data streaming online where WSNs system are always required to operate stably. Here, the concept of resource-aware framework on Mining Data Online is a very important part for WSNs. Resource-Aware framework can be applied to
This paper is the extended version from paper titled "Analysis Resource Aware Framework Using Distance Vector Algorithm on Heterogeneity Wireless Sensor Networks" that has been published in Proceeding of ICACSIS 2011.
many data mining techniques that require continuous monitoring, data aggregation and processing internetworks [1].
nodes to the base station is done by using and imote2 wireless sensor networks.
In the next section we shall review about the Distance Vector Routing, energy consumption model, Resource-Aware framework, and platform of sunSPOT and Imote2. In section 3, we will explain the reseach metodology. Their result and analysis are given in Section 4.
In Distance Vector algorithm, each router will periodically inform the topology changes. Distance Vector calculates the best path for each prefix to destination independently; typically try to minimize costs through measures such as number of router hops to the destination [3]. Each intermediate step in the algorithm, the router has the best path to destination prefix and then the router tells the information to all its neighbors, as well as with other routers. The exchange of information enable to find the best route based on the shortest path and low energy consumes, so the router will update its information and tell the router neighbors about the latest track. After going through several iterations, the way of route will be stable with each router which has the best path to the destination. Here, Bellman Ford algorithm is used to find the best path to destination where Bellman-Ford algorithm is a single-source shortest-paths algorithms that can solve a problem to find the shortest which has possibility to calculate negative path [4].
A model of energy consumption is commonly used is known as first radio-order model [5-8]. Each sensor node will consume some energy for ETX to send l-bit message over forward the message (EFX) is:
Parameter Defenition Unit
Eelec
Energy dissipation rate to run radio algorithms that can adjust resource availability on the stream data mining algorithm called Granularity Setting (AGS) which shows in figure 2. AGS consists of three algorithms they are input algorithm granularity (AIG), algorithm output granularity (AOG), and algorithm processing granularity (APG). AIG is the algorithm used to transform a data rate, AOG is an algorithm that is used to alter the size of the output with the aim of maintaining a limited memory space, and APG is a process to change the parameter settings Random Factor (RF) on the CPU.
There are three main components of RA framework [10]: Resource Monitoring is a resource that will monitor the level of battery, remaining memory, and CPU utilization; the data mining algorithm processes the data stream in real time; and algorithm granularity settings used for adjust the parameters of mining algorithm based on the availability of resources. Figure 1 shows the resource aware framework [9].
with the availability of resources. The algorithm complexity is expressed by the index O (nm), where n is the data set size, and m is the maximum number of subsequent data points.
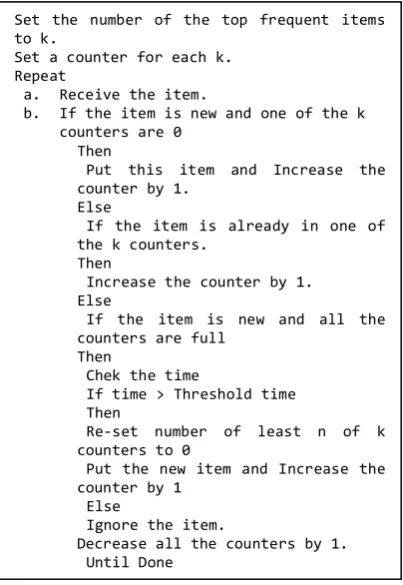
Light-Weight Frequent Item (LWF) or called Resource-Aware Frequent Item (RA-Frequent Item) has been simulated by Parenreng [11] using java programming which use Gaber theory [12] as shown in figure 4.
Resource Monitoring
Granularity Setting Algorithm
Mining Algorithm
Figure 1. Resource aware framewok.
Figure 2. Algorithm granularity setting. The responsibility of the resource monitor is to monitor remaining battery, memory and CPU utilization periodically, and also to publish resource reports, which outline status of various resource availabilities. There are two ways of updating the resource report, namely: periodic and aperiodic updating schemes. The periodic scheme is the traditional way of updating. It is also the initial scheme used by Gaber and Yu [9] in their research, where the resource monitor notifies the subscribed processing techniques over fixed timeframes. The drawback of this approach is that if the resource levels are stable, many of the updates will be wasted as there is no need to adjust the algorithm settings.
An alternative method is the aperiodic scheme. The aperiodic scheme only notifies subscribed processing techniques when the accumulative change in resource level is greater
than a significant threshold. This threshold is submitted to the resource monitor during the
algorithm’s subscription. For example, an
algorithm can request to be notified only if there is more than 10% or 5% change in resource level.
Figure 3. Light weight clustering algorithm. This approach can greatly reduce processing. Using either approach, there is only one resource event object that follows the singleton pattern. This is to minimize unnecessary usage of the limited memory of the wireless sensor device.
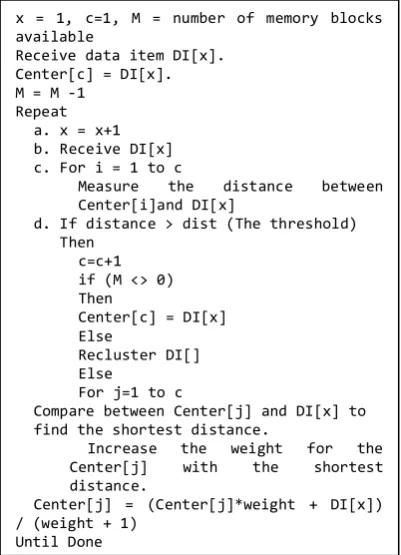
Both resource-aware clustering and resource-aware frequent items using resource monitors to examine battery charge, free memory and CPU utilization. For the memory, the research uses the available API provided by Sun SPOT and Imote2, to obtain actual memory availability. For the battery and CPU utilization used two simulations to facilitate the manipulation of resource availabilities. This will make it easier to examine the experiment with resource adaptation and accuracy. The battery simulation employs the credit point system used by Younis and Fahmy [12]. By using their approach, each activity of the sensor node is assigned an amount of points, and the maximum battery capacity is defined. During the data stream classification process, the battery level is decreased gradually due to the sensor activities, while for the CPU simulation, used randomly generated service time CPU utilizations. x = 1, c=1, M = number of memory blocks available
Receive data item DI[x]. Center[c] = DI[x]. M = M -1
Repeat a. x = x+1 b. Receive DI[x] c. For i = 1 to c
Measure the distance between
Center[i]and DI[x]
d. If distance > dist (The threshold) Then
c=c+1 if (M <> 0) Then
Center[c] = DI[x] Else
Recluster DI[] Else
For j=1 to c
Compare between Center[j] and DI[x] to find the shortest distance.
Increase the weight for the
Center[j] with the shortest
distance.
Center[j] = (Center[j]*weight + DI[x]) / (weight + 1)
Until Done If(NoFMem > RTMem)
radius_threshold = radiusLB Else
Reclaim outliers and inactive
microclusters.
Recalculate radius_threshold. If(NoFCPU < RTCPU)
randomization_factor = 100%; Else
Recalculate randomization_factor If(NoFBatt > RTBatt)
sampling_interval= sampling_interval_lower_bound. Else
The CPU utilization is computed as the percentage of the total service time of existing tasks in the queue over maximum load.
Figure 4. Lightweight frequent items algorithm. LWC will establish a set of algorithms that is formed clusters based on proximity data. Euclidean Distance (ED) is used to determine the degree of closeness between each of the incoming data stream. The data will be inserted to an existing cluster when the calculation results of ED less than the range of radius threshold (RT). On the other hand, data will be inserted to the new cluster.
The formula to calculate the degree of closeness is shown below [13]:
In the LWF algorithm, the proximity of the data is calculate by using the Manhattan Distance with
Bellman-Ford algorithm is a single-source shortest-paths an algorithm to find the shortest path problem with edge weights can be negative (Cormen, Leiserson, Rivest, & Stein, 2004). For instance, the source node is S, and Bellman-Ford algorithm will look for the shortest path from S to all other nodes which are connected to the base station.
2. Methodology
Research methodology is done by implement the distance vector routing algorithm on a network WSNs on heterogeneity platform to find the best path for sending data from sensor nodes to a base station which is the process will consider the relationship between the number of bits data transfer and the distance to the amount of energy required.This process will be combined with data mining process using an algorithm LWF and LWC and also involving resource-aware. As a comparison, the researcher also compares a similar analysis without involving resource-aware. In our previous study, the distance factor and the number of bits of data on energy consumption had not computed.
3. Results and Analysis
In this research, we used Iris data to simulate the process of streaming data. Testing simulation using SunSPOT Wireless Microsystems with battery capacity is 750 mAh and the amount of 2.700.000/100 = 27.000 mAs.
Testing LWC and LWF with RA and without RA on sunSPOT. This testing will compare the lifetime of sensor nodes using an algorithm LWF and LWC involving resource-aware and without resource-resource-aware on sunSPOT wireless. The second test of this algorithm, we only take the test on the sunSPOT wireless with the consideration that will be analyzed only in response to the battery, memory and CPU utilization.
Figures 3 and 4 shows the lifetime in sensor 7 with LWC algorithm. Figure 5 shows testing Set the number of the top frequent items
to k.
Set a counter for each k. Repeat
a. Receive the item.
b. If the item is new and one of the k
Increase the counter by 1. Else
If the item is new and all the counters are full
Then
Chek the time
If time > Threshold time Then
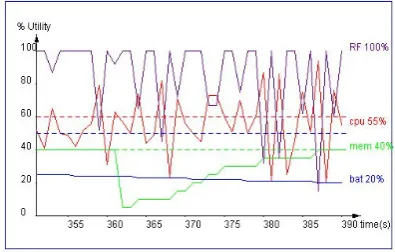
result without RA sensor can only survive for 335 seconds while with RA the sensor can withstand up to 420 seconds as shown in figure 6.
Figure 5. Lifetime on sensor 7 using LWC algorithm without RA.
Figure 6. Lifetime on sensor 7 using LWC algorithm with RA.
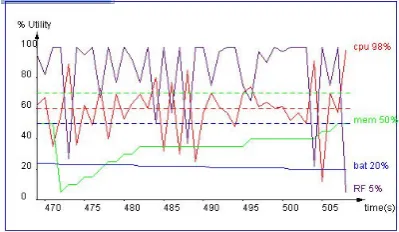
Figure 7. Lifetime on sensor 7 using LWF algorithm without RA.
Figures 7 and 8 shows the lifetime sensor 7 with LWF algorithm without RA and with RA. Figure 7 shows that without RA sensor can only survive for 353 seconds, whereas with RA the sensor can with stand up to 390 seconds as shown in figure 8. Table II shows the lifetime of each sensor node on each test conditions.
From table II shows the average lifetime sensors without RA at LWC algorithm is equal to
340.6 seconds and 408.5 seconds with RA, while the average lifetime sensor without RA on LWF algorithm is equal to 344.7 seconds and 395.9 seconds with RA. Here, this data result can be stated that, by involving resource-aware in LWC algorithm, WSNs network efficiency can be increased by 16.62% and 12.94% in the LWF algorithm. On the other hand, WSNs network efficiency can be increased by 16.62% and 12.94% in the LWF algorithm.
Figure 8. Lifetime on sensor 7 using LWF algorithm with RA. TABLEII
LIFETIME OF SENSORS No.
Of Sensor
LWC-DRA (s)
LWC-RA (S)
LWF-DRA (S)
LWF-RA (S) 10 317 386 338 400
9 334 382 338 386
8 350 406 353 390
7 335 420 353 390
6 347 406 338 403
5 345 403 338 403
4 347 419 352 395
3 333 419 338 404
2 335 404 337 394
1 346 420 352 397
0 348 420 353 397
Testing LWC and LWF with RA and without RA onImote2. This testing will show the lifetime of sensor nodes using an algorithm LWC involving aware and without resource-aware on Imote2 wireless. Figure 9 shows result without RA. Here, sensor stand for 452 seconds while with RA the sensor stand up to 530 seconds as shown in figure 10. In this case, the simulation result of sensor nodes lifetime using LWC algorithm with RA is longer than without RA where the efficiency is 14,71%.
Figure 13 shows the wireless sensor networks environment. Green line is route to transmitt data and the blue line is condition when node sensor transmitt data. Further testing will be made scenario when the condition of the sensor node will soon run out of batteries (off / inactive) then the thing to do is save the data stream that has been processed on the node, so that a node will not lose data that has been processed.
Figure 9. Lifetime platform Imote2 algorithm LWC without RA.
Figure 10. Lifetime platform Imote2 algorithm LWC with RA.
Figure 11. Lifetime platform Imote2 algorithm LWF without RA.
Figure 15 shows Distance Vector Routing using the Bellman Ford algorithm with some variation of the test by disabling one or more nodes. For example, when node 6 inactive then the node 3 to node 6 before using the route to
transmit to the base station will use the route via node 5 as shown in figure 15(a), as well as other non-active node, the algorithm will still find the shortest route to transmit data to a base station as shown in figure 4(b, c, and d).
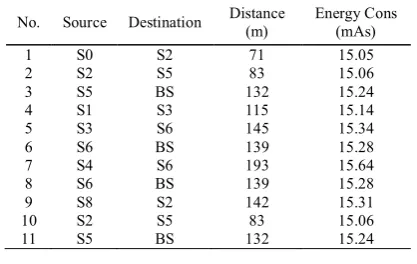
The next part will discuss about the amount of energy each sensor node needs to transmit a number of data bits to the base station which is shown in table III. Table III shows linear relationship between the magnitude of the distance and the amount of energy required, which mean the longer of distance the greater energy will be used.
Figure 12. Lifetime platform Imote2 algorithm LWF with RA.
Figure 13. Wireless sensor networks environment.
(a)
(b)
(c)
(d)
Figure 15. Network conditions when there is a sensor node is not active (a) node 6 inactive, (b) node 5 inactive, (c) 6 and 3
inactive node, and (d) node 6, 5, & 2 inactive.
TABLEIII
ENERGY CONSUMPTION VERSUS DISTANCE No. Source Destination Distance
(m)
Energy Cons (mAs)
1 S0 S2 71 15.05
2 S2 S5 83 15.06
3 S5 BS 132 15.24
4 S1 S3 115 15.14
5 S3 S6 145 15.34
6 S6 BS 139 15.28
7 S4 S6 193 15.64
8 S6 BS 139 15.28
9 S8 S2 142 15.31
10 S2 S5 83 15.06
11 S5 BS 132 15.24
4. Conclusion
In this study, simulation result of WSNs with sunSPOT wireless by combining the Distance Vector Routing and Resource-Aware framework using the LWF algorithm increase the network efficiency by 12.94% compared to 16.62% network efficiency using LWC algorithm. On the other hand, simulation result of WSNs with Imote2 wireless using the LWF algorithm increase the network efficiency by 14.71% compared to 11,24% using the LWC algorithm. According to these simulation results, implement the algorithm granularity settings (AGS) or Resource-aware (RA) will increase the sensor lifetime.
References
[1] S. Datta, K. Bhaduri, C. Giannella, R. Wolff, & H. Kargupta. Distributed Data Mining in Peer-to-Peer Networks, Dept. of Computer Science & Electrical Engineering, University of Maryland Baltimore County Baltimore, MD, USA, 2006.
[2] M.M. Gaber, S. Krishnaswamy, & A. Zaslavsky. A Wireless data stream mining model. Paper presented at Citiseer, Australia, 2004.
[3] J.T. Moy, OSPF: Anatomy of an internet routing protocol. Indianapolis: Library of Congress Cataloging-in-Publication Data, 1998.
[4] T.H. Cormen, C.E. Leiserson, R.L. Rivest, & C. Stein. Introduction to algoritmhs. 2th ed. North America: MIT Press dan Mc Graw Hill, 2004.
[5] Jin Wang, Jeong-Uk Kim, Lei Shu, Yu Niu, & Sungyoung Lee, “A Distance-Based Energy Aware Routing Algorithm for Wireless Sensor Networks,”Sensor, 2010. [6] J. Wang, J. Cho, S. Lee, K.C. Chen, & Y.K.
Lee, “Hop-based Energy aware routing algorithm for wireless sensor networks,”
[7] S. Lindsey & C.S. Raghavendra, “PEGASIS: Power Efficient Gathering in Sensor Infor-mation Systems” In the Proceedings of the IEEE Aerospace Conference, 2002.
[8] Ivan Stojmenovic & Xu Lin, "Power-aware Localized Routing in Wireless Networks,"
IEEE Transactions on Parallel and Distributed Systems, pp.1121-1133, vol. 12, no. 11, 2001.
[9] M.M. Gaber & P.S. Yu, “A framework for resource-aware knowledge discovery in data streams: a holistic approach with its application to clustering,” Paper presented at ACM Symposium on Applied Computing, 2006.
[10] A.M. Shiddiqi, “Performance measurement of resource-aware framework in online data stream mining,” Informatics Department, Faculty of Information Technology, Sepuluh Nopember Institute of Technology, 2009.
[11] J.M. Parenreng, S. Djanali, A.M. Shiddiqi,
“Analisa Kinerja Resource-Aware Framework Pada Algoritma Light-Weight Frequent Item (LWF),” Teknik Informatika, Institut Teknologi Sepuluh Nopember, Surabaya, Indonesia. Seminar Nasional Pascasarjana X – ITS, Surabaya, 2011. [12] M.M. Gaber, S. Krishnaswamy, & A.
Zaslavsky, “Cost-Efficient Mining Techniques for Data Streams,”Australasian information security, Data Mining and Web
Intelligence, and Software
Internationalization, 2004
[13] P.D. Lax, Linear Algebra and its Applications, 2th ed., Simultaneously, New York, 1997.
[14] A. Reinhardt. (2009). Exploiting platform heterogeneity in wireless sensor networks for cooperative data processing. Drahtlose Sensornetze, 8.