August 2012 85
Accredited by DGHE No: 66b/DIKTI/Kep/2011 DOI: 10.5398/medpet.2012.35.2.85
*Corresponding author: E-mail: [email protected]
Estimates of Genetic and Phenotypic Trends of Growth Traits in Bali Cattle
A. Gunawana, *, R. Sarib, & Jakariaa
aDepartment of Animal Production and Technology, Faculty of Animal Science, Bogor Agricultural University Jln. Agatis, Kampus IPB Darmaga, Bogor 16680, Indonesia
bAgricultural Science and Resource Management in the Tropics and Subtropics University of Bonn, Nussallee 1, Bonn 53115- Germany
(Received 25-10-2011; accepted 23-02-2012)
ABSTRAK
Penelitian ini bertujuan untuk menghitung pola genetik dan fenotipik sifat pertumbuhan bobot lahir, bobot sapih, dan bobot umur satu tahun sapi bali. Total sapi yang digunakan untuk menentukan bobot lahir, bobot sapih, dan bobot umur satu tahun masing-masing 235, 215, dan 178 ekor. Nilai pemuliaan, korelasi fenotipik, dan genetik dihitung melalui analisis restricted maximum likelihood dan general linier model (GLM). Selanjutnya untuk mengetahui pola genetik sifat pertumbuhan dihitung melalui analisis regresi rataan nilai pemuliaan terhadap tahun kelahiran. Hasil penelitian ini menunjukkan bahwa korelasi fenotipik dan genetik antara bobot lahir dan bobot sapih masing-masing adalah 0,10; 0,08; dan 0,70 dan 0,90 untuk bobot sapih dan bobot setahun. Pola fenotipik sifat pertumbuhan bobot lahir dan bobot sapih adalah relatif tetap, sedangkan bobot setahun menunjukkan adanya fluktuasi antara tahun 2000-2008. Hal yang sama ditunjukkan pada pola genetik, bobot lahir dan sapih yang menunjukkan adanya kecenderungan tetap antara tahun 2000-2008 kecuali pada bobot sapih tahun 2005, sedangkan pola genetik bobot setahun menunjukkan adanya fluktuasi yang sangat besar. Menurut pendugaan nilai pemuliaan, pejantan No. 0565 merupakan pejantan terbaik dengan nilai pemuliaan BW, WW, dan YW masing-masing +0,07; +2,79; dan +10,25 lebih tinggi daripada rataan populasinya. Pola genetik tersebut menunjukkan kecenderungan positif yang berarti bahwa seleksi terhadap sifat pertumbuhan akan efektif dalam perbaikan mutu genetik. Nilai korelasi genetik antara bobot sapih dan bobot setahun adalah 0,70Nilai korelasi genetik antara bobot sapih dan bobot setahun adalah 0,70 (tinggi) yang mengindikasikan bahwa seleksi terhadap bobot sapih akan meningkatkan bobot setahun pada sapi bali.
Kata kunci: sifat pertumbuhan, pola genetik, bobot lahir, sapi bali
ABSTRACT
The aim of this study was to estimate genetic and phenotypic trends for growth traits including birth (BW), weaning (WW) and yearling weight (YW) in Bali cattle. The number of cattle used toThe number of cattle used to determine growth traits of BW, WW, and YW were 235, 215, and 178 heads, respectively. �stimation. �stimation of breeding value, phenotypic and genetic correlation were calculated by Restricted Maximum Likelihood and General Linier Model (GLM) procedures, respectively. Genetic trends analysis was performed using the regression mean breeding values on birth year. Phenotypic and genetic correlation among BW and WW were 0.10 and 0.08 respectively and 0.90 and 0.70 for WW and YW respectively. The phenotypic trends for traits of birth and weaning weight were constant, whereas The phenotypic trends for traits of birth and weaning weight were constant, whereas yearling weight was fluctuating from 2000 to 2008. Likewise, in the case of genetic trends, the birth and weaning weight were constant from 2000 to 2008 except for WW in 2005, whereas the genetic trends for yearling weight showed a fluctuation of wide range. �ccording to the breeding �alue. According to the breeding valueAccording to the breeding value estimated for all traits, the best was the sire No. 0565, whose breeding value for BW, WW and YW were +0.07, +2.79, and +10.25 kg, respectively higher than the mean value of the population. The genetic trends showed that there ha�e been a significant and positi�e genetic impro�ement in all
growth traits and indicate that selection would be effecti�e. Genetic correlation between WW and YWGenetic correlation between WW and YW was high (0.70) which indicates that the selection on weaning weight might also increase yearling weight in Bali cattle.
86 August 2012
INTRODUCTION
Growth performance of Bali cattle has been a major concern especially in the character of body weight at a certain age, birth weight, weaning and yearling weight (Supriyantono et al., 2011). Those of traits are of primary economical importance in selection programmes for cow calf production system due to these traits are easily measured and have medium to high heritability cow calf production system. The heritability of weaning andThe heritability of weaning and yearling weight were considered as moderate to high (0.33-0.43) which means that the selection program will be more effective and efficient in improving the genetic merits in Bali cattle (Gunawan & Jakaria, 2011). Another factor has to be considered when selecting for growth traits that may be phenotipically and geneticallythat may be phenotipically and genetically correlated (Mohktari & Rashidi, 2010). The genetic correlation between weaning weight and post weaning weight showed a positive value which indicates that the selections on weaning weight might also increase the yearling weight and body weight gain (Supriyantono et al., 2011).
Genetic aspect of growth traits through selection become important role in calf production system. High
growth performance has been the primary selection em
-phasis in beef cattle breeding. In order to achieve opti -mum progress for cow calf production system, selection of animals has to be base on genetic parameter such as estimated breeding value (EBVs) and genetic correlation. Estimation breeding value is important because it will
monitored over time to check the validity of the predic
-tion made and to investigate direc-tion of genetic change (Intaratham et al., 2008).
Genetic trends reflect the amount of genetic improvement in a population over time (Zishiri et al., 2010). Estimates breeding value and genetic trends onEstimates breeding value and genetic trends on growth traits of different tropical cattle breeds have been reported by several studies (Boligon et al., 2011; Araujo et al., 2010; Vergara et al., 2009; Sukmasari et al., 2002). However, the estimation of breeding value and genetic trends of growth traits for indigenous Bali cattle are very rare. The research of Sukmasari et al. (2002) revealed no increase in genetic trend during period of 1983-1986 and 1988-2000.
Evaluation of breeding programs is needed to be
show as a measurement in genetic merit with environ
-mental condition and factor of limitation. In this study, field data during 2000 to 2008 are performed base on applicable breeding program for measuring genetic progress in Breeding Center of Bali cattle. The aim of this study was to estimate genetic parameters and genetic trends of growth traits of Bali cattle in Breeding Centre.
MAT�RIALS AND M�THODS
Source of Data
The breeding program was undertaken at Breeding Center of Bali cattle, located in Jembrana District, Bali Province. Data used in this study were collected dur-ing the period of 2000 to 2008. The traits investigated included: growth traits at birth (BW), weaning (WW) and yearling weight (YW). The records number of BW,The records number of BW, WW, and YW were 235, 215, and 178 heads, respectively. Detail of data structure according to traits studied with various classes and subclasses were described previ-ously in Gunawan & Jakaria (2011). Data on WW and YW at several calf ages were corrected based on 205 and 365-d age respectively. Data on BW of Bali cattle were available. The quotients used in weaning weight and one year weight correction based on 205 and 365-d age (BIF, 2002) were as follows:
WW205: {[(actual weaning weight − birth weight)/actual age] x 205 d} + birth weight
YW365 : {[(actual yearling weight − W205)/(actual age −205)] x 160 d} + W205
Data Analysis
For each traits, restricted maximum likelihood estimates of EBVs were obtained from the multiplemultiple trait derivative-free restricted maximum likelihood
(MTDFREML) program (Boldman et al., 1993) using a
unitrait animal model which included sex (male, fe -male), parity (1, 2, 3, 4, 5), year of birth (2006, 2007, 2008, 2009), and season (dry, rainy), as fixed effect, and sire and dam as random effects. Data of each replicate wereData of each replicate were analyzed using the following model:
Y= Xb + Za + e,
Where:
Y = the vector of BW, WW, and YW,
X = incidence matrices associated with the fixed Z = incidence matrices associated random effects b = the vector of fixed effects
a = the vector of animal direct additive effects, and e = the vector of random errors.
“Y” is traits used in the model and “b” is the solutions for fixed effects for traits associated with the values of the incidence matrix X. The genetic random effects “a” is associated with the incidence matrix Z, and “e” are residual random effects for traits.
Phenotypic and genetic correlations were estimated to know relationship among growth traits.
%"-"
/%"1" /+-+#*!
&* &!"* ")/-& "...+ &/"!2&/%/%"#&3"!
&* &!"* ")/-& "...+ &/"!-*!+)"##" /.
%"*+/4,& *! $"*"/& +--"(/&+*. 2"-" "./&)/"! /+ '*+2 -"(/&+*.%&, )+*$
$-+2/%/-&/.
&* &!"* ")/-& "...+ &/"!2&/%/%"#&3"!
&* &!"* ")/-& "...+ &/"!-*!+)"##" /.
%"*+/4,& *! $"*"/& +--"(/&+*. 2"-" "./&)/"! /+ '*+2 -"(/&+*.%&, )+*$
$-+2/%/-&/.
August 2012 87 Where:
o = random effects
e = fixed effects
x or y = traits a given value refers to (BW, WW, and YW) The phenotypic and genetic trends for growth traits BW, WW, and YW were calculated by regression of average BW, WW, and YW and average predicted breeding values for the traits versus the dam’s birth year according to Filho et al. (2005).
Y = a + bX
Where:
Y = BW, WW, and YW or breeding value a = Intercept
X = Year of birth
b = The regression coefficient for Y on X
R�SULTS AND DISCUSSION
Comparison of Growth Traits
The mean of BW, WW, and YW were 18.0, 86.78, and 144.56 kg respectively (Table 1). The mean of BW in this study was higher than the value obtained by Panjaitan et al. (2003) which showed the mean of BW for Bali cattle in the dry tropics Sumbawa was 14.2 kg. However, the BW value was lower compared with tropi- was lower compared with tropi -cal cattle (Bonczek et al., 1992; Demeke et al., 2004). This may be due to the breed factor and effect of environment (Jurado et al., 1994).
The WW value was lower than the values obtainedThe WW value was lower than the values obtained by Sukmasari et al. (2002) and Praharani (2009), who reported the WW mean in Bali cattle were 92.62 and 90.5 kg, respectively. The WW value was also lower com -pared to other results. Dominguez et al. (2003) obtained WW value of Tropicarne cross breed (63% Senepol, 23% Barzona, 9% Brahman, and 5% Charolais) in Mexico was 220.2 kg. Riley et al. (2007) estimated WW in Angus, Romosinuano, and Brahman crossbreds in USA was 219.9 kg. The WW mean revealed in Zebu, Angus, Holstein, Simmental, and Criollo crossbreds in Colombia was 191 kg (Arboleda et al., 2007). The small body weight at weaning in Bali cattle compare to other tropical cattle may be a characteristic of Bali cattle. However, the mean of WW could be improved in Bali cattle by placing dams and calves in paddocks that have better quality pastures. The higher WW will also allow replacement heifers to breed earlier, thus reducing replacement costs, and perhaps resulting in longer productive lives (Vergara et al., 2009).
The YW mean of Bali cattle in this study was higher than those reported by Sukmasari et al. (2002) and Praharani (2009) who obtained mean YW in Bali cattle were 140.92 and 139.50 kg, respectively. Contrarily, the mean YW here was lower than Tropical cattle crossbreed value reported by Arboleda et al. (2007) who estimated YW in B. taurus-B. indicus crossbred cattle and Blanco Orejinegro cattle were 225 kg and 147 kg, respectively. The higher body weight at YW in Bali cattle in this study compare to previous study may be due to good sup -plementation in dry season. The low YW mean obtained here suggest that supplementation provided to cattle
during the dry season was insufficient to meet their nu
-tritional requirements for growing, thus resulting in low weight gains (Vergara et al., 2009).
Breeding Value
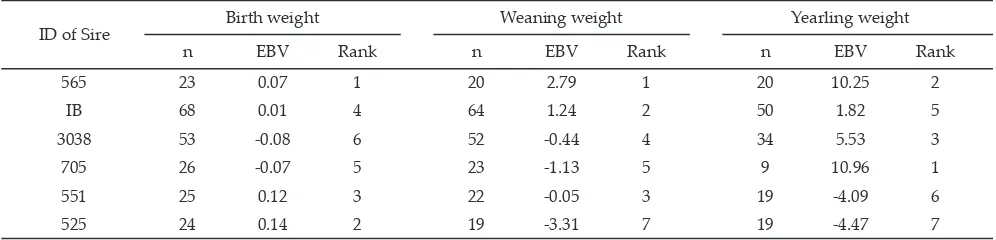
According to the breeding value estimation, No. 0565 was the best sire among others, whose breeding value for BW, WW, and YW were +0.07, +2.79, and +10.25 kg, respectively higher than the mean value of the population (Table 2). It can be stated that the sire whose breeding values estimation on BW are good, has similar breeding values according to WW and YW. However, in the rank line of breeding values estimation on growth Table 1. Data of growth traits including birth weight (BW),
weaning weight (WW), and yearling weight (YW) in Bali cattle (kg)
Traits weightBirth Weaning weight Yearling weight
n (heads) 236.00 215.00 168.00 Mean 18.00 86.78 144.56
Stdev 4.00 1.95 5.03
Minimum 16.82 84.15 133.34 Maximum 18.90 89.55 155.12
ID of Sire Birth weight Weaning weight Yearling weight
n EBV Rank n EBV Rank n EBV Rank
565 23 0.07 1 20 2.79 1 20 10.25 2
IB 68 0.01 4 64 1.24 2 50 1.82 5
3038 53 -0.08 6 52 -0.44 4 34 5.53 3
705 26 -0.07 5 23 -1.13 5 9 10.96 1
551 25 0.12 3 22 -0.05 3 19 -4.09 6
525 24 0.14 2 19 -3.31 7 19 -4.47 7
Table 2. Estimated breeding value and the rank line of the tested sire of Bali cattle
traits can be found a higher deviation, e.g. the sire No. 0525, which is on the 7th place according to the WW and YW, but on the 2nd place when it was estimated according to BW. It can also be observed in case of the sires No. 0705. Differences in rank appear when ani -mals are ordered by breeding value estimation for two or more traits, indicating that selection base on these criteria could achieve different result (Pena et al., 2004). Selection criteria base on growth trait, such as WW and YW, would distinguish sire with higher genetic merit and more uniform progeny. This result were supported by our result that the sire ID 0565 whose breeding val-ues estimation on WW was good, had similar breeding
values according to YW. The sire ID 0525 whose breed
-ing values estimation on WW was negative value, had
similar breeding values according to YW. Genetic vari
-ance of WW and YW of Bali cattle was quite moderate (30%-40%) (Praharani, 2009). The selection program on WW and YW were expected effective to improve genetic quality of growth trait. Selection in Breeding Centre has been done to evaluate sire through the progeny test. Three were five males selected for the end of perfor -mance test in which the phenotype was deviate as Bali cattle with best vital statistic (Supriyantono et al., 2011).
Genetic and Phenotypic Correlations
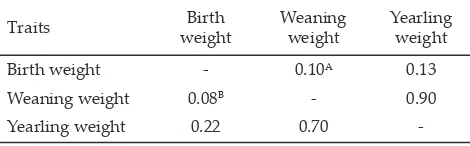
The phenotypic correlations between all traits of growth traits were consistently low to high and positive. They range between 0.10 for BW and WW and 0.90 for WW and YW (Table 3). The low correlations between BW and WW are favourable because selection for traits like pre-weaning weight is not expected to have an ef -fective correlated response in birth weight. This would
be useful in avoiding problems related to calving diffi
-culties. However, the estimate of phenotypic correlation between WW and YW in this study was higher (0.90) indicated a strong positive relationship between the two traits. These results were consistent with that reported by Eler et al. (1995), Sukmasari et al. (2002), and Pico (2004), they were still positive indicating that selection for high WW will result in higher YW. The reason for the diversity of estimates reported could be due to the fact that all estimates depend on the models that were utilized as well as the random factors included in the model development (Zishiri et al., 2009).
The genetic correlations were consistently followed
the same trend with phenotypic correlation. Genetic cor
-relations were good indicating that selection for one trait
will improve others in a desired direction. They ranged between 0.08 for BW and WW and 0.70 for WW and YW. In the present study, BW had low correlations with the remaining variables ranging from 0.08 to 0.22 for genetic correlations and from 0.10 to 0.13 for phenotypic cor -relations. This result correspond well with El-Saied et al. (2006) who reported birth weight had lower genetic and phenotypic correlation. However, the same result which showed higher value genetic correlation between WW and YW followed phenotypic correlation. The estimate of genetic correlation between WW and YW in this study was higher (0.70) and this implies that WW is a good indicator of subsequent development of the calf. The genetic correlation estimates in this study correspond well with Sukmasari et al. (2002) who reported genetic correlation for WW and YW for Bali cattle of 0.72. This estimated was higher compare to Eler et al. (1995) who reported a value 0.16. Nevertheless, compared to other literature estimates the obtained estimates were lower for all the traits studied. Meyer (1994) reported a value of 0.95 and 0.79 for Angus and Zebu cross cattle, while Pico (2004) reported a 0.88 genetic correlation estima -tion. The high and positive genetic correlations between WW and YW traits in this study implies that they are all being controlled by similar genes and thus selection for any one of these traits would lead to positive changes in the other. This results were in agreement with the report of Abdullah & Olutogun (2006) and supports the con -tention that both traits are essentially the same measure of growth and are thus under the influence of similar genes. Thus the two traits can be regarded as the same trait in a selection programme.
Genetic and Phenotypic Trends
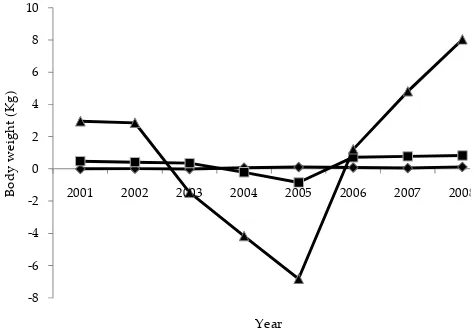
The phenotypic trends generally showed constant increase overtime for all traits during 2000 to 2008 (Figure 1). The phenotypic trends for traits of birth and weaning weight were constant, whereas yearling weight was fluctuating from 2000 to 2008. The smallest amount was decrease for YW was in the year of 2003, after this time a constant increase continued up to year 2008. The phenotypic trend of BW was positive 0.22 kg/yr. Range least square means for BW were range from 16.82 to 18.90 kg. In contrast to BW, the phenotypic trend for WW and YW were found to be -0.01 and -1.21 kg,
respectively. Ranges of least square means for WW (ad
-justed 250 d weight) and YW were from 84.15 to 89.55 kg and 133.34 to 155.12 kg, respectively (Table 4). The phenotypic result in this study correspond well with Intaratham et al. (2008) who reported phenotypic trend in Thai cattle for BW was positive value (0.18 kg/yr) and negative value for WW (-1.36 kg/yr). The phenotypic YW decreased from 2003 and thereafter increased from 2004 to 2008. The reduction in YW for calve born from 2003 was mainly due to a larger proportion of calves selected in previous years in order to increase the population for selected bull and heifers. Phenotypic performance in YW could be improved also through management strategies. Changes in management such as pasture improvement, grazing strategies and culling procedures needed to be APhenotypic correlations above diagonal
BGenetic correlations below diagonal Traits Birth
weight
Weaning weight
Yearling weight Birth weight - 0.10A 0.13
Weaning weight 0.08B - 0.90 Yearling weight 0.22 0.70 -Table 3. Genetic and phenotypic correlation of birth weight,
weaning and yearling weight of Bali cattle
August 2012 89 measured and monitored in order to evaluate the benefit
of change (Intaratham et al., 2008).
Likewise, in the case of genetic trends, the birth and weaning weight were constant from 2000 to 2008 except for WW in 2005, whereas the genetic trends for yearling weight showed a fluctuation of wide range. The smallest amount was decrease for WW was in the year of 2005, after this time a constant increase was continued up to year 2008. There were decreasing genetic trend for YW from 2002 to 2005. Morever, the genetic means of YW was sharply decrease in 2005, but increased after 2006 (Figure 2). However, the promising positive trends for WW and YW were detected after the year of 2005 and the highest mean EBV was found in the last year. This result is in agreement with the previous study by Sukmasari et al. (2002) who reported that the fluctuation of genetic trends values were observed for WW and YW in Bali cattle. The genetic trend of BW, WW, and YW were 0.02; 0.08; and 0.15 kg/yr, respectively (Table 4). Intaratham et al. (2008) using Thai cattle estimated genetic trend for BW and WW were 0.04 and 0.32 kg/yr,
respectively. Differences between estimated genetic val
-ues for these traits in comparison with other studies in general is due to difference in animal breeding standard and follow that different program selection, difference between models and calculation method and also effects of environmental and breed factors (Shaat et al., 2004; Jurado et al., 1994). However, the genetic trends estima
-tion showed that there was a significant and positive ge -netic improvement in all growth traits and indicated that selection would be effective. Higher genetic progress for growth traits have been reported for various beef cattle breeds in tropical countries (Sarmiento & Garcia, 2007; Mourao et al., 2007; Demeke et al., 2004). Consequently, beef cattle breeders with lighter calves at birth tend to put a lot of selection emphasis on WW and YW than would breeders of beef cattle breeds with heavier calves at birth (Orenge et al., 2009). Irregular fluctuations were observed in yearly mean predicted breeding values for YW in 2003 to 2005. The decrease of predicted breeding value mean of YW from 2003 to 2005 was apparently due to selection sire with low breeding value. It seems that this low selection response implying that introduction of outside sire was bases on phenotypic characteristics. These annual fluctuations for these traits also may be due to sudden changes in climate condition, manage
-ment changes, nutrition, and hygienic levels or interac
-tion between genetic and environment (Yaeghoobi et
al., 2011). Furthermore, to perform breeding programs, prior to any action optimal environment condition must provide for appearance herds genetic potential (Shaat et al., 2004).
CONCLUSION
The genetic correlation between weaning (WW) and yearling weight (YW) was high (0.70). Breeding bulls selected at earlier age can be effective in improving weights at later ages. There has been a significant and
positive genetic improvement in all growth traits espe
-cially for WW.
R�F�R�NC�S
Abdullah, A. R. & O. Olutogun. 2006. Estimates of genetic and phenotypic parameters for preweaning growth traits of N’Dama (Bos Taurus) calves in the humid tropics of Ni-geria. Livest. Res. Rur. Develop.Livest. Res. Rur. Develop. http://www.cipav.org.co/ lrrd/lrrd18/8/ab du18120.htm [1 December 2006].
Araujo, R. O., P. R. N. Roroto, T. Weber, D. M. �verling, J. S. Lopes, & M. A. Donelles. 2010. Genetic parameters and
Figure 1. Phenotypic trend of birth weight (-♦-), weaning (-■-),
and yearling weight (-▲-) of Bali cattle Figure 2. Genetic trend of birth weight (-♦-), weaning (-■-), and yearling weight (-▲-) of Bali cattle
Vol. 35 No. 2 ESTIMATES OF GENETIC AND PHENOTYPIC
Regression equation R2
Phenotypic trend BW= 17,1+0,22 76.0 WW= 86,8-0,01x 84.8 YW= 140,0-1.21x 80.0 Genetic trend EBV BW= -0,28+0.02x 50.7 EBV WW= -0,08+0,08x 15.2 EBV YW= 0,74+0.15x 18.9 Table 4. Phenotypic and genetic of growth traits
phenotypic and genetic trends for weight at weaning and visual scores during this phase estimated for Angus-Nel-lore crossbred young bulls. R. Bras. Zootec. 39: 2398-2408. http://dx.doi.org/10.1590/S1516-35982010001100012 . Arboleda, �. M., O. D. Vergara, & L. F. Restrepo. 2007. Growth
traits in crossbred beef cattle in northern Colombia. Liv-est. Res. Rural. Dev. 9: 68 http://cipav.org. co/lrrd/lrrd19/5/ arbo19068.htm
BIF (Beef Improvement Federation). 2002. Guidelines for Uni-form Beef Improvement Programs. 8th ed. Kansas StateKansas State
Univ., Kansas.
Boldman, K. G., L. A. Kriese, L. D. Van Vleck, & S. D. Kach-man. 1993. A Manual for Use MTDFREML. USDA-ARS,USDA-ARS, Clay Center, Nebraska.
Boligon, A. A., F. Baldi, M. �. Z. Mercadenta., R. B. Lobo, R. J. Pereira, & L. G. Albuquerque. 2011. Breeding value accu-2011. Breeding value accu-racy estimates for growth traits using random regression and multi traits models in Nelore cattle. Genet. Mol. Res. 10: 1227-1236. http://dx.doi.org/10.4238/vol10-2gmr1087. Bonczek, R. R., D. O. Richardson, �. D. Moore, R. H. Miller, J.
R. Owen, H. H. Dowlen, & B. R. Bell. 1992. Correlated re-sponse in growth and body measurements accompanying selection for milk yield in Jerseys. J. Dairy Sci. 75: 307–316. http://dx.doi.org/10.3168/jds.S0022-0302(92)77766-2 Demeke, S., F. W. C. Neser, & S. C. Schoeman. 2004. Estimates
of genetic parameters for boran, friesian, and crosses of friesian and jersey with the boran cattle in the tropical highlands of Ethiopia: Milk production traits and cow weight. J. Anim. Breed. Genet. 121: 163–175. http://dx.doi. http://dx.doi. org/10.1111/j.1439-0388.2004.00446.x
Domínguez, J., R. Núñez, R. Ramírez, & A. Ruíz. 2003. Envi-ronmental effects and repeatability for growth traits in Tropicarne cattle. Tec. Pecu.Mex. 41: 1–18.
�ler, J. P., L. D. Van Vleck, J. B. S. Ferraz, & R. B. Lobo. 1995. Estimation of variance due to direct and maternal effects for growth traits of Nelore cattle. J. Anim. Sci. 73: 3253-3258.
�l-Saied, U. M., L. F. de La Fuente, R. Rodriguez, & F. San Primitivo. 2006. Genetic parameter estimates for birth and weaning weight, pre-weaning daily weight gain and three type traits for Charolais beef cattle in Spanish. Sapnish. J. Agric. Res. 4:146-155.
Filho, R.A.T., R.A Torres, P.S. Lopes, C.S. Pereira, R.F. �u-clydes, C.V. Araujo & M.A Silva. 2005. Genetic trends in the performance and reproductive traits of pigs.Genet. Mol. Biol. 28:97-102. http://dx.doi.org/10.1590/S1415-47572005000100017
Gunawan, A. & Jakaria. 2011. Genetic and non genetics ef-fect on birth, waeaning and yearling weight of Bali cat-tle. Med. Pet.34: 93-98. http://dx.doi.org/10.5398/med-pet.2011.34.2.93
Intaratham, W., S. Koonawootrittriron, P. Sopannarath, H. U.
Graser, & S. Tumwasorn. 2008. Genetic parameters and annual trends for birth and weaning weights of a north-eastern Thai indegenous cattle line. Asian-Aust. J. Anim. Sci. 21:478-483.
Jurado, J. J., A. Alonso, & R. Alenda. 1994. Selection response1994. Selection response for growth in Spanish Merino flock. J. Anim. Sci. 72:1433-J. Anim. Sci. 72:1433-1440.
Mourao, G. B., J. B. S. Ferraz, J. P. �ler, J. C. C. Balieiro, R. S.
Bueno, E. C. Mattos, & L. G. G. Figueiredo. 2007. Genetic2007. Genetic parameters for growth traits of a Brazilian Bos taurus x Bos indicus beef composite. Genet. Mol. Res. 6: 1190–1200.
Meyer, K. 1994. Estimates of direct and maternal correla-tions among growth traits in Australian beef cattle. Li-Australian beef cattle. Li- Li-vest. Prod. Sci. 38:91-105. http://dx.doi.org/10.1016/0301-6226(94)90053-1
Mokhtari, M. S. & A. Rashidi. 2010. Genetic trends estimation2010. Genetic trends estimation for body weights of Kermani sheep at different age using multivariate animal models. Small Ruminant. Res. 88:23-26. http://dx.doi.org/10.1016/j.smallrumres.2009.11.003 Orenge, J. S. K., �. D. Ilatsia, I. S. Kosgey, & A. K. Kahi. 2009.
Genetic and phenotypic parameters and annual trends for growth and fertility traits of Charolais and Hereford beef cattle breeds in Kenya. Trop. Anim. Health. Prod. 41:767-Prod. 41:767-774. http://dx.doi.org/10.1007/s11250-008-9250-2
Panjaitan, T., G. Fordyce, & D. Poppi. 2003. Bali cattle perfor-mance in the dry tropics of Sumbawa. JITV. 8: 183-188.JITV. 8: 183-188. Pena, C. D. O., R. Carvalheiro, S. A. Queiroz, & L. A. Fries.
2004. Comparison of selection criteria for pre-weaning growth traits of Nelore cattle. Livest. Prod. Sci. 86: 163-167. http://dx.doi.org/10.1016/S0301-6226(03)00164-7
Pico, B. A., F. W. C. Nesser, & J. B. van Wyk. 2004. Genetic pa-rameters for growth traits in South African Brahman cat-tle. South African J. Anim. Sci. 34 (Suppl. 2):44-46. http:// dx.doi.org/10.4314/sajas.v34i6.3827
Praharani, L. 2009. Estimation of direct and maternal weights in Bali cattle effect for weaning and yearling.Indonesia. J. Agric. 2: 74-81
Riley, D. G., C. C. Chase, S. W. Coleman, & T. A. Olson. 2007. Evaluation of birth and weaning traits of Romosinuano calves as purebreds and crosses with Brahman and Angus. J. Anim. Sci. 85, 289–298. http://dx.doi.org/10.2527/jas.2006-416
Sarmiento, R. M. & J. P. Garcia 2007. Estimation of genetic pa-rameters and variance components for growth traits in Ro-mosinuano cattle in the Colombian humid tropics. Genet. Mol. Res. 6: 482–491.
Shaat, I., S. Galal, & H. Mansour. 2004. Genetic trends for lamb weights in flocks of Egyptian Rahmani and Ossimi sheep. Small Rumin. Res. 51:23-28. http://dx.doi.org/10.1016/ http://dx.doi.org/10.1016/ S0921-4488(03)00185-8
Sukmasari, A. H., R. R. Noor, H. Martojo, & C. Talib. 2002. The estimation of breeding values and genetics trends of body weight in Bali cattle improvement project. Hayati. 9:Hayati. 9: 109-113
Supriyantono, A., L. Hakim, Suyadi, & Ismudiono. 2011.2011. Breeding programme development of Bali cattle at breed-ing centre. Anim. Prod. 13:45-51Anim. Prod. 13:45-51
Susanto, A., S. A. Santosa, & A. T. A. Sudewo. 2010. Inbreed-2010. Inbreed-ing and genetic trend of dairy cattle in Baturraden Dairy Cattle Breeding Centre: A Short Communication. Anim.Anim. Produc. 12 :144-149
Vergara, O. D., M. A. �lzo, M. F. Ceron- Munoz, & �. M. Ar-boleda. 2009. Weaning weight and post weaning gain genetic parameters and genetic trends in Blanco Orejine-gro-Romosinuano-Angus-Zebu multibreed cattle popula-tion in Columbia. Livest. Sci. 124: 156-162. http://dx.doi. org/10.1016/j.livsci.2009.01.008
Yaeghoobi, R., A. Doosti., A. M. Noorian, & A. M. Bahrami. 2011. Genetic parameters and trends of milk and fat yield in Holsteins dairy cattle of West Provinces of Iran. Int. J. Dairy. Sci. 6: 142-149. http://dx.doi.org/10.3923/ ijds.2011.142.149
Zishiri, O. T., S. W. P. Cloete, J. J. Oliever, & K. Dzama. 2010. Genetic trends in South African terminal sire sheep breeds. S. Afr. J. Anim. Sci. 40 (Suppl 1): 458