15
STUDENTS’ ACHIEVEMENT IN PREPOSITION OF PLACE AT THE ELEVENTH GRADE STUDENTS OF SMK YADIKA
LUBUKLINGGAU IN THE ACADEMIC YEAR OF 2013/2014 Ardayati1
Abstract: This research was a quasi experimental research by using non-equivalent control group design. The objective of this research was to find out whether there is a significant influence of using picture toward students’ achievement in preposition of place. This research used the eleventh grade students of SMK YADIKA Lubuklinggau as the research subject. There were two classes which were used in this research; they were class XIA which consisted of 42 students as the experiment class and class XIB which consisted of 42 students as the control class. The experiment class was taught by using picture whereas the control class was not taught by using picture. Both classes were chosen by using sensus sample as the sampling technique. The instrument used in this research was a written test about preposition of place consisting of multiple choice items. From the data analysis, it was found that the value of tcount = 6,72 while ttable or t (0,05) (82) = ±1,99. The result analysis showed that tcount was outside the acceptance area of H0 whether it was tested by using significance level (∝) = 0, 05 or (∝) = 0, 01. Therefore, the gain score in experiment and control class was found out very significant. Besides, the mean score of post-test in experiment class is 11,78 point was higher than the mean score of post-test in control class. The finding proved that students’ achievement in preposition of place of the class which was taught using picture was better than the class which was not taught using picture. Therefore, it can be concluded that picture has a significant influence toward students’ achievement in learning preposition of place. It was found that pictures can be used for teachers of English in teaching preposition of place.
Keywords: Picture, Achievement, Preposition of Place
PENDAHULUAN
In order to be able to make a sensible sentence to indicate the location of a thing in a particular conversation, it is important that students master the preposition of place. Besides, preposition of place material will also relate to other materials in English such as material about how to give direction. So, by mastering the preposition of place material students will be easier to give a direction. All these facts have proved how important the mastery of prepositions of place for students is. Furthermore, students’ success in learning a material will depend on the learning process itself. According to Sanjaya (2006:160), learning process is a communication process which always involves with three main components. They are the messenger component (teacher), the receiver component (student), and content of the message component (subject material). Furthermore, in a learning process can sometimes occur a communication failure; it means that the subject material or the message delivered by the teacher can not be received optimally by students. In other words, not all of the subject materials can be well comprehended by students. Besides, the students as receivers can sometimes misunderstand the content of message delivered by the teacher.Related to preposition of place material, it is very often that students are sometimes difficult to differentiate the use of them because of the unclear explanation from the teacher. In order to avoid it, the teacher should find out an approach or strategy and use it for an effective learning, which is innovative, and potentially able to improve the students’ comprehension in preposition of place.
This study is trying to answer the following questions:
1. How do the teachers use pictures to increase students’ activity in learning preposition of place at the eleventh grade students of SMK YADIKA Lubuklinggau in the academic year of 2013/2014?
2. How is the implementation of teaching preposition of place using pictureat the eleventh grade students of SMK YADIKA Lubuklinggau in the academic year of 2013/2014?
3. What methods are appropriate to be used in teaching preposition of place at the eleventh grade students of SMK YADIKA Lubuklinggau in the academic year of 2013/2014?
4. What are factors that influence students’ achivement in preposition of place at the eleventh grade students of SMK YADIKA Lubuklinggau in the academic year of 2013/2014?
5. Is the use of picture able to increase students’ motivation in learning preposition of place at the eleventh grade students of SMK YADIKA Lubuklinggau in the academic year of 2013/2014?
6. Is there an influence of using picture toward students’ achievement in preposition of place at the eleventh grade students of SMK YADIKA Lubuklinggau in the academic year of 2013/2014?
7. Is the use of picture in teaching prepositions of place able to increase students’ achievement at the eleventh grade students of SMK YADIKA Lubuklinggau in the academic year of 2013/2014?
METHOD
post-test which are multiple choice test. Moreover, There will be about twenty items in this test which consists of four options in each question.
Validity of the instrument was concidered in this research. A test can be said valid if the test measures the object that should be measured, besides it must be suitable with the criteria. To analyze the instrument validity in this research, for a correlation between an item and all items test, the writer uses the excel program by using Point Biserial Correlation Formula (Arikunto, 2006:283). To determine the validity of the test, the formula used is as follow:
q
The reliability of the test can be determined by using “Spearman Brown Formula” (split half technique). The formula to determine the correlation based on Arikunto (2006:170) is as follow:
After getting the index correlation, then to determine reliability of the test the formula that is used based on Arikunto (2006:180) is as follow:
= / /
( / / )
After the score of reliability (r11) was gotten, this score was then
consulted to r product moment table (rtable) with the signification standard
is 5%. If r11 (rcount) > rtable , it means the test was reliable or consistent.The
techniques of collecting data in this research used test. The test waspre-test and post-waspre-test which were given to the sample after the material had been taught. The data collecting technique in this research was a multiple choice test that consists of 20 items with four options for each item.
Match t-test is used to analyze the data statistically. This research used two classes, one class as experiment class and another class is as control class. Therefore, match t-testwas used to analyze the data of the two groups. After the writer have conducted pre-test and post-test in both experiment and control class, the score of the pre-test and post-test in both classes then compared to find the gain score after the treatments in order to find out whether there is a significant influence in students’ achievement in preposition of place after being given a treatment by using picture.
a. Determining the raw score by using the following formula: Zi = xi - x
S
b. Determining the opportunity of each raw score by using the following formula:
F(Zi) = P(Z≤ Zi)
c. Determining the proportion by using the following formula: S(Zi)= The number of z1,z2,z3,....zn which is ≤ Zi
n
d. Calculating the highest price of L, which is called as Lo, then compare
Lo with Ltable. The normal criteria is that if Lo< Ltable so, the group has
the normal distribution.
Before the data was processed, it was needed to be analyzed whether the samples taken are really homogeneous. Two variants of common test were used to determine whether both data are homogeneous. The formula of homogenity test according to Sudjana (2002:250) is as follow:
Fcount = The Highest Variance
The Lowest Variance
The analysis used was t-test. According to Sugiyono (2010:274), the formula is as follow:
)
To test those two hypotheses, the price of tcount will be compared
with the price of ttable by determining df (degree of freedom) first. The
formula to determine df is as follow: df = n1+ n2 – 2
After determining the degree of freedom (df), then the price of ttable
can be determined with the standard of signification 5% and 1%. The testing criteria is as follow:
if –ttable ≤ tcount ≤ +ttable means H0 is accepted
RESULT AND DISCUSSION Result of the Pre-test
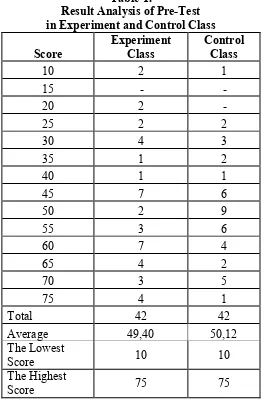
The result of the pre-test in experiment and control class can be described in the following table:
Table 1.
Result Analysis of Pre-Test in Experiment and Control Class Score Experiment Class Control Class
10 2 1
15 - -
20 2 -
25 2 2
30 4 3
35 1 2
40 1 1
45 7 6
50 2 9
55 3 6
60 7 4
65 4 2
70 3 5
75 4 1
Total 42 42
Average 49,40 50,12
The Lowest
Score 10 10
The Highest
Score 75 75
It indicated that the students’ achievement in preposition of place before treatment was low. The hypothesis to be proved is as follow: H0 : There is no different achievement in preposition of place
between
Ha : There is any different achievement in preposition of place between
experiment and control class.
While the test criteria is that if tcount< ttable it means H0was
accepted or there was no different achievement in preposition of place between experiment and control class before the treatment so that the experiment research can be conducted in both classes. From the result of pre-test in experiment and control class, it was known the following data:
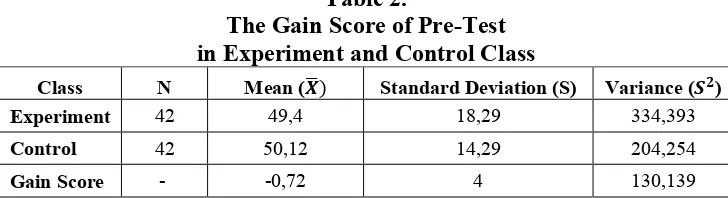
Table 2.
The Gain Score of Pre-Test in Experiment and Control Class
Class N Mean ( ) Standard Deviation (S) Variance ( ) Experiment 42 49,4 18,29 334,393 Control 42 50,12 14,29 204,254 Gain Score - -0,72 4 130,139
From the calculation, it wasfound that tcount = -0,199 while using ∝
= 0,05, it was found that ttable = 1,99. Therefore, tcount< ttable or it means
that H0was accepted. In other words, there was no different achievement
in preposition of place between experiment and control class before the treatment or both classes was in the same condition before the treatment.
Result of the Normality of Pre-test
Testing the value of normality of the pre-test was needed to be done to determine whether the data collected is in normal distribution. The statistical analysis used was Lilliefors’s test. The hypothesis to be proved was:
H0 : The group comes from population which have normal
distribution.
Ha : The group comes from population which do not have
normal distribution.
With the test criteria:
If Lo > Ltable means H0were rejected or the data is not normally
distributed, in other case if Lo < Ltable means H0was accepted or the data
is in a normal distribution.
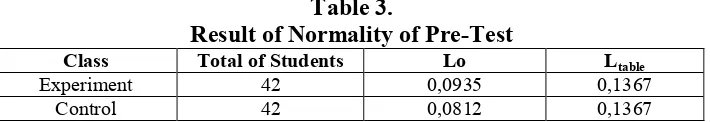
Table 3.
Result of Normality of Pre-Test
Class Total of Students Lo Ltable
Experiment 42 0,0935 0,1367
Control 42 0,0812 0,1367
Based on the table, it can be deduced that in experiment class Lo < Ltable or 0,0935 < 0,1367, it means that H0was accepted. It can be
concluded that the data of pre-test in experiment class is in normal distribution. Meanwhile, in control class Lo < Ltable or 0,0812 < 0,1367, it
means that H0was accepted. In other words, it means that the data of the
pre-test in control class were also in normal distribution.
Result of the Homogenity of Pre-test
To test the homogenity of the variance, the highest variance were divided by the lowest variance. From the calculation, it was found that the variance of the experiment class in pre-test is 334,393 and variance of the control class in pre-test was 204,254.
The hypothesis to be proved is:
H0 : There is no difference variance between experiment class and the
variance in control class (homogenous).
Ha : There is a difference variance between experiment class and the
variance
in control class (not homogenous).
The hypothesis criteria for homogenity test is that if Fcount ≤ Ftable,
it means that H0 is accepted or the sample was homogenous. Meanwhile,
if Fcount ≥ F table it means that H0was rejected or the sample is not
homogenous.
From the calculation result, it was obtained that Fcount = 1,6371.
Meanwhile, by using the significance level (∝)= 0,05 and Ftable = F(dk the
largest variance-1, dk the smallest variance-1), it was found that Ftable =
F(0,05) (41,41) = 1,681. So, it is known that 1,6371 ≤ 1,681 or Fcount< Ftable.
Therefore, H0was accepted or There was no difference variance between
experiment class and the variance in control class or in other words it also means that the sample was homogenous.
Treatment
of a city map completed by a short descriptive text which describes the map. In the last treatment, students have already focused on learning preposition of place.
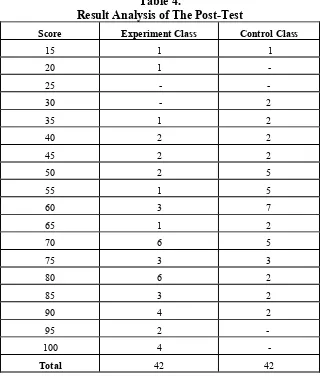
Result of the Post-test
To determine the influence of using picture media in teaching preposition of place, it was used an instrument in the form of post-test which was conducted after giving treatment. The result of the post-test in both experiment and control class were described in the following table:
Table 4.
Result Analysis of The Post-Test
Score Experiment Class Control Class
15 1 1
20 1 -
25 - -
30 - 2
35 1 2
40 2 2
45 2 2
50 2 5
55 1 5
60 3 7
65 1 2
70 6 5
75 3 3
80 6 2
85 3 2
90 4 2
95 2 -
100 4 -
0% 10% 20% 30% 40% 50% 60% 70% 80%
Experiment Class Control Class Students' Achievement in Preposition of Place
Table 5.
Result Analysis of The Post-Test
Score Experiment Class Control Class
Average 70,71 58,93
The Lowest Score 15 15
The Highest
Score 100 90
Score ≥ KKM 28 14
Score ≤ KKM 14 28
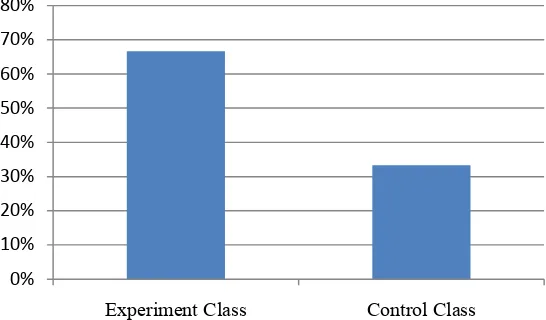
The table 5 showed that there are 66,7% of students in experiment class reached the minimum standard of accomplishment criteria, while in control class there were only 33,3% of students that reached the minimum standard of accomplishment criteria. From the table, it can also be seen that the average score of experiment class is 11,8 point were higher than the average score of the control class. The data can also be seen in the following picture.
Picture 1. Students’ Achievement Based on The MinimumStandard of Accomplishment Criteria
minimum standard of accomplishment criteria can be seen in the following table.
Table 6.
The Score Less Than The Minimum Standard of Accomplishmment Criteria
Class Total Percentage
Experiement 14 33,3%
Control 28 66,7%
From table 10, it can be seen that there were only 33% of students that get score less than the minimum standard of accomplishment criteria. Meanwhile, there were 66,7% of students in control class get score less than the minimum standard of accomplishment criteria. The result of post-test in both experiment and control class which was interpreted in description is able to be seen in the following table.
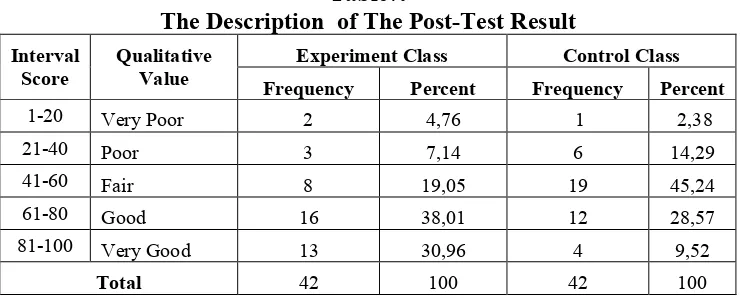
Table7.
The Description of The Post-Test Result Interval
Score Qualitative Value Frequency Experiment Class Percent Frequency Control Class Percent
1-20 Very Poor 2 4,76 1 2,38
21-40 Poor 3 7,14 6 14,29
41-60 Fair 8 19,05 19 45,24
61-80 Good 16 38,01 12 28,57
81-100 Very Good 13 30,96 4 9,52
Total 42 100 42 100
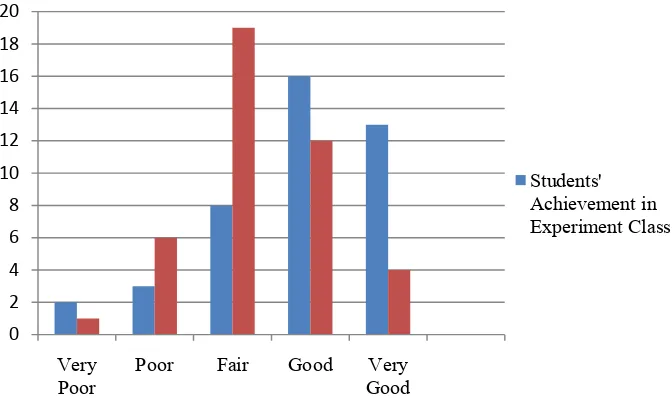
there were only 4 students or (9,52%). The result of post-test in qualitative value on experiment and control class can be seen in the following picture.
Picture 2. The Result of Post-Test on Experiment and Control Class
Furthermore, the gain score of the post-test in experiment class and control class was as described in the following table:
Table 8.
The Gain Score of Post-Test in Experiment and Control Class
Class N Mean ( ) Standard Deviation (S) Variance ( ) Experiment 42 70,71 21,49 334,393 Control 42 58,93 17,09 204,254 Gain Score 11,78 4,4 130,139
From the table 12 above, it was found that the mean score of post-test in experiment class were 11,78 point higher than the mean score of post-test in control class. So, it was proved that students who were taught using picture have a better achievement in preposition of place than students who were not taught using picture. It can be concluded that the use of picture is effective to increase students’ achievement in preposition of place.
0 2 4 6 8 10 12 14 16 18 20
Very
Poor Poor Fair Good GoodVery
Result of the Normality of Post-test
Testing the normality of the post test value was needed to be done to determine whether the data collected is in normal distribution. The statistical analysis used was Lilliefors’s test. The hypothesis to be proved were:
H0 : The group comes from population which have normal
distribution.
Ha : The group comes from population which do not have
normal
distribution.
Moreover, The test criteria for normality tets is that if Lo > Ltable it
means H0were rejected or the data were not normally distributed, in other
case if Lo < Ltable it means H0were accepted or the data is in a normal
distribution. From the result of post-test calculation of Lilliefors on the experiment and control class, it was obtained the following data.
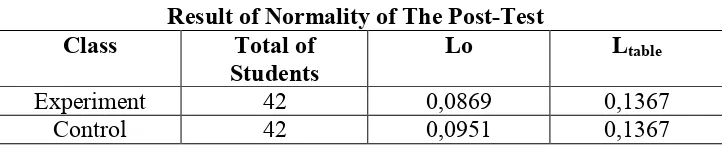
Table 9.
Result of Normality of The Post-Test Class Total of
Students Lo Ltable
Experiment 42 0,0869 0,1367
Control 42 0,0951 0,1367
Based on the table13, it can be deduced that the result of normality of the post-test in experiment class is 0,0869, while the Ltable is
0,1367 or it means that Lo < Ltable or in other words H0was accepted. It
can be concluded that the data of post-test in experiment class was in normal distribution. Meanwhile, in control class: 0,0951 < 0,1367 or Lo < Ltable, it means that H0was also accepted. So, it means that the data of
the post-test in control class was also in normal distribution.
Result of The Homogenity of Post-test
Before the data were analyzed further, the data homogenity was viewed in advance of its homogenity. To test the homogenity of the two groups, the highest variance were divided by the lowest variance. From the calculation, it was found that the variance of the experiment class in post test is 461,672 and variance of the control class in post test is 292,117.
The hypothesis to be proved is:
H0 : There is no difference in variance between the experiment class
and the
Ha : There is a difference in variance between the experiment class and the
variance in control class (not homogenous).
The hypothesis criteria for homogenity test is that if Fcount ≤ Ftable
means that H0were accepted or the sample is homogenous. In contrast, if
Fcount ≥ F table means that H0were rejected or the sample was not
homogenous.
From the calculation result, it was known that Fcount= 1,58. By using the
significance level (∝)= 0,05 , it was found that Ftable = F(dk the largest
variance-1, dk the smallest variance-1) = F(0,05) (41,41) = 1,681.
So, it was found that 1,58 ≤ 1,681 or Fcount ≤ Ftable. Therefore, H0
is accepted or There was no difference variance between the experiment class and the variance in control class or the sample was homogenous.
Result of the Hypothesis Test
The result of the pre-test and post-test analysis of the experiment class and control class show that the data collected has normal distribution and homogenous. Then, the next step was the data was used to test the research hypothesis. To test the hypothesis, the formula used was t-test formula.
The hypothesis to be proved was:
H0 : There is no influence of using picture toward students’
achievement in
preposition of place.
Ha : There is any influence of using picture toward students’ achievement in-
preposition of place.
While the statistical hypothesis to be proved was:
Ho : µ1=µ2
Ha : µ1≠µ2
The testing criteria is as follow:
if –ttable ≤ tcount ≤ +ttable so H0was accepted, it means that picture had no
influence with the students’ achievement in preposition of place. Meanwhile,
if –ttable> tcount> +ttable so H0were rejected, it means that picture has a
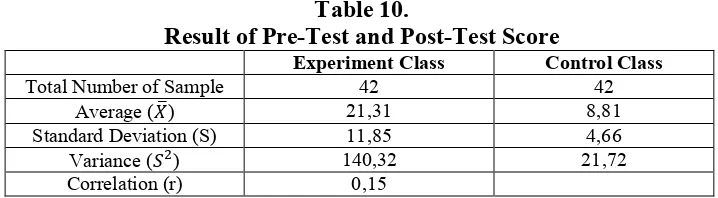
Table 10.
Result of Pre-Test and Post-Test Score
Experiment Class Control Class
Total Number of Sample 42 42
Average ( ) 21,31 8,81
Standard Deviation (S) 11,85 4,66
Variance ( ) 140,32 21,72
Correlation (r) 0,15
From the calculation, it was found that tcount = 6,72. The complete
calculation can be seen in appendix of the hypothesis test or t-test which is enclosed in appendix 26. In testing the two parts with the significance level (∝) = 0,05 and df = 42+42-2=82, then to determine the price of ttable
for df = 82, is done by interpolation, thus it was found that the price of ttable = ±1,99. Meanwhile, in using the significant level (∝) = 0,01 it was
found that the price of ttable = 2,66. The result of hypothesis test can be
described in the following table:
Table 11.
Result of H0 Acceptance
Significant Level ttable tcount
5% t(0,05) (82) = ±1,99 6,72
1% t(0,01) (82) = ±2,66
From the table above, it can be concluded that in significance level (∝) = 0,05, and df = 82, it is known that tcount> +ttable or 6,72 > 1,99 so H0 is
rejected. In contrast, Ha was accepted. Moreover, in significant level (∝ )= 0,01 and df = 82, it was found that 6,72 > 2,66 or tcount> ttable, so H0was
rejected. Meanwhile, Ha were accepted. It means there was influence of using picture toward students’ achievement in preposition of place. For more details, it can be seen in the following picture.
Picture 3. Regional Acceptance of H0 with Significance Level
(∝) = %
+6,72 Large Area 95%
Regional Acceptance of H0
tcount is outside the acceptance area of H0, it means that H0 stating
that “there was no influence of using picture toward students’ achievement in preposition of place” was rejected. On the other hand, Ha stating that “there is influence of using picture toward students’ achievement in preposition of place” was accepted. The result of hypothesis test using significance level (∝) = 1% can be described in the following picture.
Picture 4. Regional Acceptance of H0 with Significance Level
(∝) = %
From the picture, it showed that tcount was outside the reception area of H0, it means H0 is rejected. To conclude, the hypothesis tests using
significance level (∝) = 0,05 and significance level (∝) = 0,01 produce ‘H0was rejected’ with the interpretation criteria of very significant.
Discussion
Based on the result of the data analysis, it can be inferred that picture can be used to increase students’ achievement in preposition of place. If it is viewed from the test result, there is a difference which is significant. Moreover, the research found that the value of tcount is 6,72.
Besides, the group taught by using picture had a mean score of the learning achievement of 70,7, whereas those who were not given treatment had a mean score of the learning achievement of 58,9. It means, between the use of picture and students’ achievement in preposition of place had significant relationship and the relationship can be generalized. Thus, the value of the mean score of the post-test on the group using picture is higher than the mean score of the group which is not taught using picture.
The test score of the experiment class that received treatment using picture found that there were about 67% of the students whose learning achievement reached the minimum standard of accomplishment criteria (70), whereas in the control class which was not received a
+6,72 Large Area 99%
Regional Acceptance of H0
treatment there was only about 33% students whose learning achievement reached the minimum standard of accomplishment criteria. This result found that using picture can increase students’ achievement in preposition of place. In other words, the use of picture in teaching preposition of place was effective to ease students in comprehending a material, especially on preposition of place then finally lead to increase the students’ achievement in that material. This is relevant with the explanation of Priyantoro (2010:43) who states that picture is able to ease students’ comprehension about a certaint material, picture is able to strengthen students’ memory, to increase students’ interest, and to give a correlation between a learning material and the fact. Based on the data analysis, it can be inferred that the use of picture has a significant influence on students’ achievement in preposition of place.
CONCLUSION
REFERENCES
Alimi, Muhammad. 2010. Increasing Students’ Ability In Writing DescriptiveText By Using Picture at The Second Year Students of MTS Qudsiyah Kudus Kotabumi North Lampung Academic Year 2010/2011.Skripsitidakditerbitkan.Kotabumi: FKIP STKIP Muhammadiyah.
Arikunto, Suharsimi. 2006. ProsedurPenelitian:
SuatuPendekatanPraktik. Jakarta: RinekaCipta.
Arsyad, Azhar. 2007. Media Pembelajaran. Jakarta: PT. Raja
GrafindoPersada.
Brown, H. Douglas. 2000. Principles of Language Learning and
Teaching: Fourth Edition. New York: Longman.
Cobuild, Collins. 2000. English Grammar: Helping Learners with Real English. Glasgow: Harper collins.
Cohen, Louis, Lawrence Manion, and Keith Morrison. 2000. Research Methods inEducation. London: RoutledgeFalmer.
Daryanto. 2010. Media Pembelajaran:
PeranannyaSangatPentingDalamMencapaiTujuanPembelajaran. Yogyakarta: Gava Media.
Djamarah, SyaifulBahri. andZain, Aswan. 1996.
StrategiBelajarMengajar. Jakarta: RinekaCipta.
Dominick, Joseph R.1983. The Dynamics of Mass Communication. New
York: Newbery Award Records, Inc..
Harminingsih. 2008. Faktor-Faktor yang MempengaruhiHasilBelajar.
Retrieved August 1st, 2008 from
http://harminingsih.blogspot.com/2008/08/faktor-faktor-yang-mempengaruhi-hasil.html.
Hewings, Ann and Martin. 2005. Grammar and Context: An Advanced ResourceBook. New York: Routledge.
HS, Soegeng. 2005. Effective English. Solo: TigaSerangkai.
Jihad, Asep.danHaris, Abdul. 2008. EvaluasiPembelajaran. Yogyakarta: Multipressindo.
KamusBesarBahasa Indonesia. 2001. Jakarta: BalaiPustaka.
Oxford Learner’s Pocket Dictionary. 2003. New York: Oxford University Press.
Pratt, Lorraine Nichols. 1993. Grammar Step by Step Vol. 1. Jakarta: BinarupaAksara.
Priyantoro, Dian Eka. 2010. Manfaat Media
(2): 44-45. JurnalIlmiah STKIP MuhammadiyahKotabumi-Lampung.
Sadiman, Arief S. et. al. 2010. Media Pendidikan: Pengertian, Pengembangan, danpemanfaatannya. Jakarta: Rajawali Pers.
Sanjaya, Ade. 2011. Pengertian, Definisi Hasil Belajar Siswa. Retrieved
March 22nd, 2011 from
http://aadesanjaya.blogspot.com/2011/03/pengertian-definisi-hasil-belajar.html.
Sanjaya, Wina. 2006. StrategiPembelajaranBerorientasiStandar Proses Pendidikan. Jakarta: Kencana.
Sudjana. 2002. MetodaStatistika. Bandung: Tarsito.
Sugiyono. 2010. MetodePenelitianPendidikan: pendekatanKuantitatif,
Kualitatif, dan R&D. Bandung: ALFABETA.