Handbook of
Electrical Engineering
For Practitioners in the Oil, Gas and
Petrochemical Industry
West Sussex PO19 8SQ, England Telephone (+44) 1243 779777
Email (for orders and customer service enquiries): [email protected]
Visit our Home Page on www.wileyeurope.com or www.wiley.com
All Rights Reserved. No part of this publication may be reproduced, stored in a retrieval system or transmitted in any form or by any means, electronic, mechanical, photocopying, recording, scanning or otherwise, except under the terms of the Copyright, Designs and Patents Act 1988 or under the terms of a licence issued by the Copyright Licensing Agency Ltd, 90 Tottenham Court Road, London W1T 4LP, UK, without the permission in writing of the Publisher. Requests to the Publisher should be addressed to the Permissions Department, John Wiley & Sons Ltd, The Atrium, Southern Gate, Chichester, West Sussex PO19 8SQ, England, or emailed to [email protected], or faxed to (+44) 1243 770620.
This publication is designed to provide accurate and authoritative information in regard to the subject matter covered. It is sold on the understanding that the Publisher is not engaged in rendering professional services. If professional advice or other expert assistance is required, the services of a competent professional should be sought.
Other Wiley Editorial Offices
John Wiley & Sons Inc., 111 River Street, Hoboken, NJ 07030, USA
Jossey-Bass, 989 Market Street, San Francisco, CA 94103-1741, USA
Wiley-VCH Verlag GmbH, Boschstr. 12, D-69469 Weinheim, Germany
John Wiley & Sons Australia Ltd, 33 Park Road, Milton, Queensland 4064, Australia
John Wiley & Sons (Asia) Pte Ltd, 2 Clementi Loop #02-01, Jin Xing Distripark, Singapore 129809
John Wiley & Sons Canada Ltd, 22 Worcester Road, Etobicoke, Ontario, Canada M9W 1L1
Wiley also publishes its books in a variety of electronic formats. Some content that appears in print may not be available in electronic books.
Library of Congress Cataloging-in-Publication Data Sheldrake, Alan L.
Handbook of electrical engineering : for practitioners in the oil, gas, and petrochemical industry / Alan L. Sheldrake.
p. cm.
Includes bibliographical references and index. ISBN 0-471-49631-6 (alk. paper)
1. Electric machinery–Handbooks, manuals, etc. 2. Petroleum engineering–Equipment and supplies–Handbooks, manuals, etc. I. Title.
TK2000.S52 2003 621.31′042–dc21
2002192434
British Library Cataloguing in Publication Data
A catalogue record for this book is available from the British Library
ISBN 0-471-49631-6
Preface
This book can be used as a general handbook for applying electrical engineering to the oil, gas and petrochemical industries. The contents have been developed from a series of lectures on electrical power systems, given to oil company staff and university students, in various countries. The author has condensed many years of his knowledge and practical experience into the book.
The book includes summaries of the necessary theories behind the design of systems together with practical guidance on selecting most types of electrical equipment and systems that are normally encountered with offshore production platforms, drilling rigs, onshore gas plants, pipelines, liquefied natural gas plants, pipeline pumping stations, refineries and chemical plants.
The intention has been to achieve a balance between sufficient mathematical analysis and as much practical material as possible. An emphasis has been put on the ‘users’ point of view because the user needs to know, or be able to find out quickly, the information that is of immediate application in the design of a plant. The subjects described are those most frequently encountered by electrical engineers in the oil industry. References are frequently made to other texts, published papers and international standards for guidance and as sources of further reading material.
Power systems used in these industries have characteristics significantly different from those found in large-scale power generation and long-distance transmission systems operated by public utility industries. One important difference is the common use of self-contained generating facilities, with little or no reliance upon connections to the public utility. This necessitates special consideration being given to installing spare and reserve equipment and to their interconnection configurations. These systems often have very large induction motors that require being started direct-on-line. Their large size would not be permitted if they were to be supplied from a public utility network. Therefore the system design must ensure that they can be started without unduly disturbing other consumers.
Rule-of-thumb examples are given so that engineers can make quick and practical estimates, before embarking upon the more detailed methods and the use of computer programs. Detailed worked examples are also given to demonstrate the subject with practical parameters and data. Some of these examples may at first seem rather lengthy, but the reasoning behind such detail is explained. In most cases they have been based on actual situations. These worked examples can easily be programmed into a personal computer, and the step-by-step results could be used to check the coding of the programs. Once programmed it is an easy exercise to change the input data to suit the particular problem at hand, and thereby obtain a useful result in a very short period of time.
The chapters have been set out in a sequence that generally represents the approach to engi-neering and designing a project. The first step is to estimate a total power consumption or load for a plant. Then it is necessary to decide how this load is to be supplied. For example the supply could be from a utility intake, by captive generators or by a combination of both supplies.
The appendices contain comprehensive listings of abbreviations in common use, international standards that are most relevant, conversion factors for units of measure, detailed worked examples of calculations, the IEEE numbering system for protective and control devices with a commentary pertaining to its use in the oil industry.
All the diagrams and graphs were drawn from a graphics package that was driven by Fortran 77 programs, which were specifically written by the author for this book.
1
Estimation of Plant Electrical Load
One of the earliest tasks for the engineer who is designing a power system is to estimate the normal operating plant load. He is also interested in knowing how much additional margin he should include in the final design. There are no ‘hard and fast’ rules for estimating loads, and various basic questions need to be answered at the beginning of a project, for example,
• Is the plant a new, ‘green field’ plant?
• How long will the plant exist e.g. 10, 20, 30 years? • Is the plant old and being extended?
• Is the power to be generated on site, or drawn from an external utility, or a combination of both? • Does the owner have a particular philosophy regarding the ‘sparing’ of equipment?
• Are there any operational or maintenance difficulties to be considered?
• Is the power factor important with regard to importing power from an external source?
• If a generator suddenly shuts down, will this cause a major interruption to the plant production? • Are there any problems with high fault levels?
1.1 PRELIMINARY SINGLE-LINE DIAGRAMS
In the first few weeks of a new project the engineer will need to roughly draft a key single-line diagram and a set of subsidiary single-line diagrams. The key single-line diagram should show the sources of power e.g. generators, utility intakes, the main switchboard and the interconnections to the subsidiary or secondary switchboards. It should also show important equipment such as power transformers, busbars, busbar section circuit breakers, incoming and interconnecting circuit breakers, large items of equipment such as high voltage induction motors, series reactors for fault current limitation, and connections to old or existing equipment if these are relevant and the main earthing arrangements. The key single-line diagram should show at least, the various voltage levels, system frequency, power or volt-ampere capacity of main items such as generators, motors and transformers, switchboard fault current levels, the vector group for each power transformer and the identification names and unique ‘tag’ numbers of the main equipment.
The set of single-line diagrams forms the basis of all the electrical work carried out in a particular project. They should be regularly reviewed and updated throughout the project and issued
Handbook of Electrical Engineering: For Practitioners in the Oil, Gas and Petrochemical Industry. Alan L. Sheldrake
Table 1.1. Voltages used in different countries for generation,
Notes∗ Commonly used voltages in the oil industry. Notes∗∗Commonly used as single-phase voltages.
in their final form at the completion of the project. They act as a diary and record the development of the work. Single-line diagrams are also called ‘one-line diagrams’.
At this stage the engineer can begin to prepare a load schedule for each subsidiary switchboard and motor control centre, and a master schedule for the main switchboard. The development of the single-line diagrams during the project is discussed in sub-section 1.7.
The master load schedule will give an early estimate of the total power consumption. From this can be decided the number of generators and utility intakes to install. The kW and kVA ratings of each generator or intake will be used to determine the highest voltage to use in the power system. Table 1.1 shows typical voltages used throughout the world for generation, distribution and transmission of power at oil industry plants, see also sub-section 3.7.
1.2 LOAD SCHEDULES
switchboard will have the possibility of two components, one local and one downstream. Hereinafter the term switchboard will also include the term motor control centre, see sub-section 7.1.
Each local load may be classified into several different categories for example, vital, essential and non-essential. Individual oil companies often use their own terminology and terms such as ‘emergency’ and ‘normal’ are frequently encountered. Some processes in an oil installation may handle fluids that are critical to the loss of power e.g. fluids that rapidly solidify and therefore must be kept hot. Other processes such as general cooling water services, air conditioning, sewage pumping may be able to tolerate a loss of supply for several hours without any long-term serious effects.
In general terms there are three ways of considering a load or group of loads and these may be cast in the form of questions. Firstly will the loss of power jeopardise safety of personnel or cause serious damage within the plant? These loads can be called ‘vital’ loads. Secondly will the loss of power cause a degradation or loss of the manufactured product? These loads can be called the ‘essential’ loads. Thirdly does the loss have no effect on safety or production? These can be called the ‘non-essential’ loads.
Vital loads are normally fed from a switchboard that has one or more dedicated generators and one or more incoming feeders from an upstream switchboard. The generators provide power during the emergency when the main source of power fails. Hence these generators are usually called ‘emergency’ generators and are driven by diesel engines. They are designed to automatically start, run-up and be closed onto the switchboard whenever a loss of voltage at the busbars of the switchboard is detected. An undervoltage relay is often used for this purpose. Testing facilities are usually provided so that the generator can be started and run-up to demonstrate that it is ready to respond when required. Automatic and manual synchronising facilities can also be provided so that the generator can be loaded during the tests.
Low voltage diesel generators are typically rated between 100 and 500 kW, and occasionally as large as 1000 kW. High voltage emergency generator ratings are typically between 1000 and 2500 kW. The total amount of vital load is relatively small compared with the normal load and, in many situations, the essential load. Consequently the vital load is fed from uninterruptible power supplies (UPS), as AC or DC depending upon the functions needed. The vital loads are usually fed from a dedicated part of the emergency switchboard. The UPS units themselves are usually provided with dual incoming feeders, as shown in Figure 17.3.
Some of the vital and essential loads are required when the plant is to be started up, and there is no ‘normal’ power available. In this situation the starting up of the plant is called ‘black starting’. The emergency generator must be started from a source of power, which is usually a high capacity storage battery and a DC starter motor, or a fully charged air receiver and a pneumatic starter motor. In many plants, especially offshore platforms, the vital and essential loads operate at low voltage e.g. 380, 400, 415 volts. Large plants such as LNG refrigeration and storage facilities require substantial amounts of essential power during their start-up and shut-down sequences and so high voltage e.g. 4160, 6600 volts is used. The vital loads would still operate at low voltage. Tables 1.2 and 1.3 shows typical types of loads that can be divided into vital and essential loads.
All of the vital, essential and non-essential loads can be divided into typically three duty categories:
• Continuous duty.
• Intermittent duty.
Table 1.2. Vital and essential AC loads Vital AC loads Essential AC loads UPS supplies Diesel fuel transfer pumps Emergency lighting Main generator auxiliaries Emergency generator auxiliaries Main compressor auxiliaries Helicopter pad lighting Main pump auxiliaries Control room supplies Diesel fire pump auxiliaries Vital LV pumps Electric fire pumps
Living quarters Air compressor
General service water pumps Fresh water pumps
Equipment room HVAC supplies Life boat davits
Anti-condensation heaters in panels and switchboards Security lighting supplies Control room supplies UPS supplies
Radio supplies Computer supplies Battery chargers for engine
starting systems Instrumentation supplies
Table 1.3. Vital DC loads Public address system Plant alarm systems System shutdown system Telemetry systems Emergency radio supplies Fire and gas detection system Navigation aids
Hence each switchboard will usually have an amount of all three of these categories. Call these Cfor continuous duty,I for intermittent duty andSfor the standby duty. Let the total amount of each at a particular switchboard j be Cjsum,Ijsum and Sjsum. Each of these totals will consist of
the active power and the corresponding reactive power.
Table 1.4. Diversity factors for load estimation
Type of project DcforCsum DiforIsum DsforSsum
Conceptual design of a new plant
1.0 to 1.1 0.5 to 0.6 0.0 to 0.1 Front-end design of a new
plant (FEED)
1.0 to 1.1 0.5 to 0.6 0.0 to 0.1 Detail design in the first half of
the design period
1.0 to 1.1 0.5 to 0.6 0.0 to 0.1 Detail design in the second half
of the design period
0.9 to 1.0 0.3 to 0.5 0.0 to 0.2 Extensions to existing plants 0.9 to 1.0 0.3 to 0.5 0.0 to 0.2
The above method can be used very effectively for estimating power requirements at the beginning of a new project, when the details of equipment are not known until the manufacturers can offer adequate quotations. Later in a project the details of efficiency, power factor, absorbed power, rated current etc. become well known from the purchase order documentation. A more accurate form of load schedule can then be justified. However, the total power to be supplied will be very similar when both methods are compared.
The total load can be considered in two forms, the total plant running load (TPRL) and the total plant peak load (TPPL), hence,
TPRL=
Wheren is the number of switchboards.
The installed generators or the main feeders to the plant must be sufficient to supply the TPPL on a continuous basis with a high load factor. This may be required when the production at the plant is near or at its maximum level, as is often the case with a seasonal demand.
Where a plant load is predominantly induction motors it is reasonable to assume the overall power factor of a switchboard to be 0.87 lagging for low voltage and 0.89 lagging for high voltage situations. If the overall power factor is important with regard to payment for imported power, and where a penalty may be imposed on a low power factor, then a detailed calculation of active and reactive powers should be made separately, and the total kVA determined from these two totals. Any necessary power factor improvement can then be calculated from this information.
1.2.1 Worked Example
Table 1.5. Subsidiary load schedule for the low voltage process switchboard Description of load No. of
units Production area lighting 2 75 150 0 0
Glycol pumps 4 2 4 0 4
Glycol reboilers 2 75 75 0 75 Glycol transfer pump 1 15 15 0 0 Refrigeration compressor 3 160 320 0 160 Deareator vacuum pumps 2 30 30 0 30 Water injection booster pumps 4 90 270 0 90 Deareator chem. injection pumps 4 2 4 0 4 Sea drain sump pumps 1 10 10 0 0 Water inj. chem. injection pumps 6 2 8 0 4 Reclaim oil pumps 2 37 37 37 0 Treated water pumps 2 132 132 132 0 Oil transfer pumps 4 10 30 10 0 Electric gas heating 2 300 300 0 300 HP gas comp. pre-lube pumps 2 5 5 0 5 2×HP gas comp. auxiliaries 2 — 35 35 100 LP gas comp. pre-lube pumps 2 5 5 0 5 2×LP gas comp. auxiliaries 2 — 35 35 100 4×water inj. pump auxiliaries 4 — 70 70 200 Corrosion inhibitor pumps 1 37 37 0 0 Trace heating 2 40 80 0 0 Sub-totals for the switchboard 1652 319 1077 Normal running load for the switchboard=(1.0×1652)+(0.5×319)+(0.1×1077)=1920 kW
Table 1.6. Subsidiary load schedule for the low voltage utilities switchboard Description of load No. of
units Utilities area lighting 2 75 150 0 0 Potable water pumps 2 5 5 5 0 Living quarters feeder-A(on) 1 500 300 200 0 Living quarters hot water pumps 2 15 15 15 0 Control room supplies 1 15 15 0 0 Computer supplies 2 15 15 0 15 Radio supplies 2 30 30 0 30 Instrument air compressor 2 90 90 0 90 Instrument air driers 2 10 10 0 10 Plant air compressors 2 90 90 0 90
HVAC fans 16 11 88 0 88
This in turn will enable an initial layout of all the facilities and equipment to be proposed. Since this is a new plant and the preliminary data is estimated from process calculations, mechanical calculations and comparisons with similar plants, it is acceptable to use the following diversity factors,Dc=1.0, Di =0.5 andDs =0.1.
Tables 1.5, 1.6, 1.7 and 1.8 show the individual loads that are known at the beginning of the project.
The total power is found to be 12,029 kW. At this stage it is not known whether the plant is capable of future expansion. The oil and gas geological reservoir may not have a long life expectation, and the number of wells that can be accommodated on the platform may be limited. The 4000 kW of power consumed by the drilling operations may only be required for a short period of time e.g. one year, and thereafter the demand may be much lower.
Table 1.7. Subsidiary load schedule for the low voltage emergency switchboard Description of load No. of
units Emergency lighting 1 75 75 0 0 Chlorine generator 1∗ 30 30 0 0
Desalination unit 1∗ 75 75 0 0
Potable water pumps 1 5 5 0 0 Instrument air compressors 1 90 90 0 0 Instrument air driers 1 10 10 0 0 Living quarters feeder-B(off) 1∗ 500 0 0 0
Living quarters emergency feeder 1 100 50 50 0 Living quarters hot water pumps 1 15 15 0 0 Diesel fuel transfer pump 1 5 5 0 0 Emergency diesel eng. sump heater 1 3 3 0 0 Emergency diesel gen. auxiliaries 1 2 0 0 2 Emergency diesel eng. bat. charger 1 1 0 1 0 Emergency diesel eng. room fans 2 11 11 0 0 Control room fans 2 22 22 0 0 Computer UPS supply 1 5 5 0 0 Emergency radio supplies 1 10 0 0 10 Navigation aids UPS supply 1 10 10 0 0 Life boat davit supplies 2 37 0 50 24 Life boat diesel heater supplies 2 4 4 4 0 Fire pump engine battery chargers 2 22 22 22 0 Seawater washdown pump 1∗ 37 0 37 0
Anti-condensation swbd heaters — 25 25 0 0 Anti-condensation motor heaters — 25 10 15 0 Portable lighting supplies 1 1 1 0 0 Sub-totals for the switchboard 468 179 58 Normal running load for the switchboard=(1.0×468)+(0.5×179)+(0.1×58)=563 kW
For black start delete loads marked (∗)
Table 1.8. Master load schedule for the high voltage main switchboard Description of load No. of
units
Main oil expert pumps 3 650 1300 0 650 Gas compressor 4 500 1500 0 500 Seawater lift pumps 4 450 1350 0 450
LV motor loads
Feeder to drilling 1 0 2700 2400 1000 Feeder to LV process MCC 2 0 1652 319 1077 Feeder to LV utilities MCC 1 0 1013 320 633 Feeder to LV emergency MCC 1 0 168 179 58 Sub-totals 9983 3218 4368 Totals for the main generator to supply=(1.0×9983)+(0.5×3218)+(0.1×4368)=12,029 kW
During the detail design phase of the project the load schedules will be modified and additional loads will inevitably be added. At least 10% extra load should be added to the first estimate i.e. 1203 kW. The total when rounded-up to the nearest 100 kW would be 13,300 kW.
Sufficient generators should be installed such that those that are necessary to run should be loaded to about 80 to 85% of their continuous ratings, at the declared ambient temperature. This subject is discussed in more detail in sub-section 1.3. If four generators are installed on the basis that one is a non-running standby unit, then three must share the load. Hence a reasonable power rating for each generator is between 5216 kW and 5542 kW.
1.3 DETERMINATION OF POWER SUPPLY CAPACITY
After the load has been carefully estimated it is necessary to select the ratings and numbers of generators, or main incoming feeders from a power utility company. Occasionally a plant may require a combination of generators and incoming feeders e.g. refinery, which may operate in isolation or in synchronism with the utility company.
Usually a plant has scope for expansion in the future. This scope may be easy to determine or it may have a high degree of uncertainty. The owner may have strong reasons to economise initially and therefore be only willing to install enough capacity to meet the plant requirements in the first few years of operation. If this is the case then it is prudent to ensure that the switchgear in particular has adequate busbar normal current rating and fault current rating for all future expansion. The main circuit breakers should be rated in a similar manner. If the switchgear is rated properly at the beginning of a project, then all future additions should be relatively easy to achieve in a practical and economical manner. Such an approach also leads to a power system that is easy to start up, operate and shut down.
Any allowance required for future load growth should be included in the power consumption calcula-tions. This two-part approach is often referred to as the ‘N−1 philosophy’, whereN is the number of installed generators or feeders. The philosophy is that under normal operating conditions in a fully load plantN−1 generators or feeders should be sufficient to supply the load at a reasonably high load factor.
Let Pl =power consumption required at the site ambient conditions
Pg =rated power of each generator or feeder at the site ambient conditions
Fo =overload power in % when one generator or feeder is suddenly switched out of service Fi =load factor in % of each generator or feeder before one is switched out of service N =number of installed generators or feeders.N is usually between 4 and 6 for an
economical design of a generating plant and 2 or 3 for feeders.
Pl and Pg are usually the known variables, with Fi and Fo being the unknown variables. Several feasible ratings ofPg may be available and the value of N may be open to choice. A good choice ofPg andN will ensure that the normally running load factor is high i.e. between 70% and 85%, whilst the post-disturbance overload on the remaining generators or feeders will not be so high that they trip soon after the disturbance, i.e. less than 125%.
The initial load factor can be found as,
Fi = 100Pl
Pg(N−1) %
The post-disturbance overload can be found as,
Fo = 100Pl
Pg(N−2)%
If it is required thatFi is chosen for the design such thatF =100% and no overload occurs then letF be called Fi100 and so,
Fi100=
(N−2)100
N−1 for no overloading.
Table 1.9 shows the values of Fi against N for the no overloading requirement.
Table 1.9. Selecting N and Fi100 on the
Table 1.10 shows the values of the load factorFi and the overload factor Fo for a range of typical power consumptionsPl. The values of Pg are the site requirements and relate approximately to the ratings of gas-turbine generators that are available and used in the oil industry i.e. 2.5 to 40.0 MW.
The table was compiled by constraining Fi andFo to be within good practical limits,
66.7%Fi 90.0%
and
80Fo125%
Table 1.10. Selecting generator ratings on the basis ofN−1 capacity with tolerance of overloading Power for a site amb. temp
Table 1.10. (continued) for a site amb. temp
of 40◦C (MW)
In practice if Fi is too high the operator of the plant will become nervous and will often switch into service the spare generator. IfFi is too low then there will be too many generators in service and it should be possible to withdraw one. Gas turbines have poor fuel economy when they are lightly loaded.
If Fo is designed to be less than approximately 105% then the generators will be able to absorb the overload until some corrective action by an operator is taken e.g. puts the spare generator into service.
However, it is also possible to introduce a high-speed load shedding scheme into the power system whenFo is found to be above 105%. Such a scheme will compute in an anticipatory manner how much consumption should be deleted in the event of a loss of one generator. The designer will be able to predetermine enough low priority consumers to achieve the necessary corrective action. See Chapter 16.
The application of theN−1 philosophy is less complicated with incoming feeders e.g. under-ground cables, overhead lines. N is usually chosen as 2 because it is not usually economical to use three or more feeders for one switchboard. Both feeders are usually in service and so the ‘spare’ does not usually exist. However, each feeder is rated to carry the full demand of the switchboard. Therefore with both in service each one carries half of the demand, and can rapidly take the full demand if one is switched out of service. This approach also enables a feeder to be taken out service for periodic maintenance, without disturbing the consumers.
1.4 STANDBY CAPACITY OF PLAIN CABLE FEEDERS
AND TRANSFORMER FEEDERS
In sub-section 1.2 the three ways of considering consumers were discussed, and the terms, vital, essential and non-essential were introduced. Because of the sensitive nature of the vital and essential consumers with regard to personnel safety and production continuity, it is established practice to supply their associated switchboards with dual, or occasionally triple, feeders. For non-essential switchboards it may be practical to use only one feeder.
For switchboards other than those for the generator or intake feeders it is established practice to add some margin in power capacity of their feeders so that some future growth can be accommodated. The margin is often chosen to be 25% above the TPPL.
If the feeders are plain cables or overhead lines then it is a simple matter to choose their cross-sectional areas to match the current at the 125% duty.
For transformer feeders there are two choices that are normally available. Most power trans-formers can be fitted with external cooling fans, provided the attachments for these fans are included in the original purchase order. It is common practice to order transformers initially without fans and operate them as ONAN until the demand increases to justify the fan cooling. Thereafter the transformer is operated as ONAF, see sub-section 6.5. Adding fans can increase the capacity of the transformer by 25% to 35%, depending upon the particular design and ambient conditions. The alternative choice is simply to rate the ONAN transformer for the 125% duty, and initially oper-ate it at a lower level. The decision is often a matter of economics and an uncertainty about the future growth.
1.5 RATING OF GENERATORS IN RELATION
TO THEIR PRIME MOVERS
1.5.1 Operation at Low Ambient Temperatures
In some countries the ambient temperature can vary significantly over a 24-hour period, and its average daily value can also vary widely over a 12-month period. The power plant designer should therefore ascertain the minimum and maximum ambient temperatures that apply to the plant. The maximum value will be used frequently in the sizing and specification of equipment. The minimum value will seldom be used, but it is very important when the sizing of generators and their prime movers are being examined.
Prime movers will produce more output power at their shafts when the ambient temperature is low. The combustion air in the prime mover is taken in at the ambient temperature. Gas turbines are more sensitive to the ambient air temperature than are piston engines.
If the ambient temperature is low for long periods of time then the power plant can generate its highest output, which can be beneficial to the plant especially if a seasonal peak demand occurs during this period of low temperature. In some situations a generator may be able to be taken out of service, and hence save on wear and tear, and fuel.
With this in mind the generator rating should exceed that of the prime mover when power is required at the low ambient temperature. A margin of between 5% and 10% should be added to the prime mover output to obtain a suitable rating for the generator. It should be noted that when the output of a prime mover is being considered, it should be the output from the main gearbox if one is used. Gearbox losses can amount to 1% to 2% of rated output power.
1.5.2 Upgrading of Prime Movers
Some prime movers, especially new designs, are conservatively rated by their manufacturer. As the years pass some designs are upgraded to produce more power. As much as 10% to 15% can be increased in this manner. If the power system designer is aware of this potential increase in rating then the generator rating should be chosen initially to allow for this benefit. At the same time the cables and switchgear should be rated accordingly.
Situations occur, especially with offshore platforms, where no physical space is available to install an extra generator and its associated equipment. Sometimes the main switchrooms cannot accept any more switchgear, not even one more generator circuit breaker. Therefore the potential for upgrading a prime mover without having to make major changes to the electrical system is an option that should be considered seriously at the beginning of a project.
1.6 RATING OF MOTORS IN RELATION
TO THEIR DRIVEN MACHINES
Table 1.11. Ratio of motor rating to the driven machine rating Approximate rating of the
motor or machine (kW)
Margin of the motor rating above the machine rating (%) Up to 15 125
16.0 to 55 115 Above 55 110
• The absolute rating of either the motor or the driven machine i.e. small or large machines.
• The function of the driven machine e.g. pump, compressor, fan, crane, conveyor.
• Expected operating level e.g. often near to maximum performance, short-term overload-ing permitted.
• Shape of the operating characteristic of the machine e.g. pressure (head) versus liquid flow rate in a pump.
• Change in energy conversion efficiency of the machine over its working range.
• Machine is driven at nearly constant speed.
• Machine is driven by a variable speed motor.
• Harmonic currents will be present in the motor.
• The nearest standard kW rating available of the motor.
• Ambient temperature.
Some rule-of-thumb methods are often stated in the purchasing specifications of the motor–machine unit, see for example Table 1.11, which applies to low voltage three-phase induction motors.
Where the driven machine is a centrifugal type i.e. pump or compressor, the shaft power may be taken as that which occurs at the ‘end of curve’ operating point. This rule-of-thumb point is defined as being 125% of the power required at the maximum operating efficiency point on the designed curve of pressure (head) versus fluid flow rate, at the rated shaft speed.
These rule-of-thumb methods can be used to check the declared performance and ratings from a machine manufacturer.
1.7 DEVELOPMENT OF SINGLE-LINE DIAGRAMS
Single-line diagrams are the most essential documents that are developed during the detail design phase of a project. They identify almost all the main items of power equipment and their associated ancillaries. Initially they define the starting point of a project. Finally they are a concise record of the design, from which all the design and purchasing work evolved.
1.7.1 The Key Single Line Diagram
Switchboards and motor control centres:
• All switchboards and motor control centre names, bus-section numbers, line voltages, number of phases, number of wires, frequency, busbar continuous current rating.
• Identification of main incoming, bus-section, outgoing and interconnecting circuit breakers, includ-ing spare and unequipped cubicles.
• Some diagrams show the cable tag number of the principal cables.
Generators:
• Names and tag numbers.
• Nominal ratings in MVA or kVA and power factor.
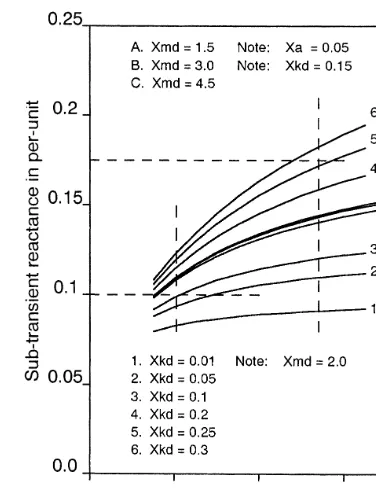
• D-axis synchronous reactance in per-unit.
• D-axis transient reactance in per-unit.
• D-axis sub-transient reactance in per-unit.
• Neutral earthing arrangements, e.g. solid, with a neutral earthing resistance (NER), with a common busbar, switches or circuit breakers for isolation.
• Current and time rating of the NER if used, and the voltage ratio of the earthing transformer if used.
Transformer feeders:
• Names and tag numbers.
• Nominal ratings in MVA or kVA.
• Leakage impedance in per-unit.
• Symbolic winding arrangement of the primary and secondary.
• Line voltage ratio.
High voltage and large low voltage motors:
• Names and tag numbers.
• Nominal ratings in kW.
General notes column or box:
Usually several notes are added to the diagram to explain unusual or particular features, such as interlocking, limitations on impedance values for fault currents or voltdrop.
1.7.2 Individual Switchboards and Motor Control Centres
• Switchboards and motor control centre name and tag number.
• Bus-section numbers or letters.
• Line voltage, number of phases, number of wires, frequency, busbar continuous current rating.
• Busbar nominal fault breaking capacity in kA at 1 or 3 seconds.
• Identification of all circuit breakers, fuse-contactor units, and their nominal current ratings.
• Neutral earthing arrangements, e.g. connections to the incomers.
• Protective devices of all incomers, bus-section circuit breakers, busbars, and outgoing circuits.
• Interlocking systems in schematic form.
• Local and remote indication facilities.
• Details of special devices such as transducers, automatic voltage regulators, synchronising schemes, fault limiting reactors, reduced voltage motor starters, busbar trunking.
• Rating, ratio and accuracy class of current and voltage transformers.
• Identification of spare and unequipped cubicles.
• References to other drawing numbers, e.g. continuation of a switchboard, associated switchgear, drawing in the same series, legend drawing, cables schedule and protective relay schedule.
• Column or box for detailed notes.
• Column or box for legend of symbols.
1.8 COORDINATION WITH OTHER DISCIPLINES
At the earliest practical time in a project the engineers will need to identify areas of engineering and design where interfaces are necessary. An efficient system of communication and exchange of information should be established and implemented at regular intervals. Meetings should be arranged to discuss problem areas and short-falls in information. The following generally summarises what is needed, particularly during the feasibility and conceptual stage of a project.
In order to be able to engineer an economical and efficient power system it is desirable for the electrical engineer to have:
• A basic understanding of the hydrocarbon and chemical processes and their supporting utilities e.g. compression, pumping, control and operation, cooling arrangements.
• A procedure for regular communication with engineers of other disciplines, e.g. instrument, process, mechanical, safety, telecommunications, facilities, operations and maintenance.
• An appreciation of the technical and economical benefits and shortcomings of the various electrical engineering options that may be available for a particular project.
• The technical flexibility to enable the final design to be kept simple, easy to operate and easy to maintain.
1.8.1 Process Engineers
The process engineers should be able to inform the electrical engineers on matters relating to the production processes and supporting utilities e.g.:
• Oil, gas, condensate and product compositions and rates, and their method of delivery to and from a plant.
• Fuel availability, rates and calorific values, pollution components e.g. sulphur, carbon dioxide, alkali contaminants, particle size and filtration.
• Electrical heating and refrigeration loads, trace heating of vessels and piping.
• Make available process flow diagrams, process and instrumentation diagrams, utilities and instru-mentation diagrams.
1.8.2 Mechanical Engineers
The mechanical engineers will normally need to advise on power consumption data for rotating machines, e.g. pumps, compressors, fans, conveyors, and cranes. They will also advise the power output options available for the different types and models of prime movers for generators, e.g. gas turbines, diesel engines, gas engines.
In all cases the electrical engineer needs to know the shaft power at the coupling of the electrical machine. He is then able to calculate or check that the electrical power consumption is appropriate for the rating of the motor, or the power output is adequate for the generator.
The mechanical engineer will also advise on the necessary duplication of machinery, e.g. continuous duty, maximum short-time duty, standby duty and out-of-service spare machines. He will also give some advice on the proposed method of operation and control of rotating machines, and this may influence the choice of cooling media, construction materials, types of bearings, ducting systems, sources of fresh air, hazardous area suitability, etc.
The electrical engineer should keep in close ‘contact’ with the progress of machinery selection during the early stages of a project up to the procurement stage in particular, so that he is sure the electrical machines and their associated equipment are correctly specified. Likewise after the purchase orders are placed he should ensure that he receives all the latest manufacturers’ data relating to the electrical aspects, e.g. data sheets, drawings, changes, hazardous area information. See also Chapter 19 and Appendix E.
1.8.3 Instrument Engineers
The process and instrument engineers will generally develop the operation and control philosophies for individual equipments and overall schemes. The electrical engineer should then interface to enable the following to be understood:
• Interlocking and controls that affect motor control centres and switchboards, generator controls, control panels, local and remote stations, mimic panels, SCADA, computer networking, displays in the CCR and other locations.
• Cabling specifications and requirements, e.g. screening, numbers of cores, materials, earthing, routing, segregation and racking of cables.
• Power supplies for control systems, AC and DC, UPS requirements, battery systems.
1.8.4 Communication and Safety Engineers
The communication and safety engineers will be able to advise on power supply requirements for:
• Radar, radio, telecommunications and public address.
• Aids to navigation, e.g. lamps, beacons, foghorns, sirens; also alarms, lifeboat davits, etc.
• Emergency routing and exit lighting systems.
• Supplies for emergency shut-down systems.
1.8.5 Facilities and Operations Engineers
These engineers do not normally contribute any power consumption data, but their input to the work of the electrical engineer is to advise on subjects such as equipment layout, access to equipment, maintainability, maintenance lay-down space, emergency exit routing, operational philosophies of plant and systems, hazardous area classification.
REFERENCE
2
Gas Turbine Driven Generators
2.1 CLASSIFICATION OF GAS TURBINE ENGINES
For an individual generator that is rated above 1000 kW, and is to be used in the oil industry, it is usual practice to use a gas turbine as the driving machine (also called the prime mover). Below 1000 kW a diesel engine is normally preferred, usually because it is an emergency generator running on diesel oil fuel.
Gas turbines can be classified in several ways, common forms
are:-• Aero-derivative gas turbines.
• Light industrial gas turbines.
• Heavy industrial gas turbines.
2.1.1 Aero-derivative Gas Turbines
Aircraft engines are used as ‘gas generators’, i.e. as a source of hot, high velocity gas. This gas is then directed into a power turbine, which is placed close up to the exhaust of the gas generator. The power turbine drives the generator. The benefits of this arrangement
are:-• Easy maintenance since the gas generator can be removed as a single, simple module. This can be achieved very quickly when compared with other systems.
• High power-to-weight ratio, which is very beneficial in an offshore situation.
• Can be easily designed for single lift modular installations.
• Easy to operate.
• They use the minimum of floor area.
The main disadvantages
are:-• Relatively high costs of maintenance due to short running times between overhauls.
• Fuel economy is usually lower than other types of gas turbines.
• The gas generators are expensive to replace.
Handbook of Electrical Engineering: For Practitioners in the Oil, Gas and Petrochemical Industry. Alan L. Sheldrake
Aero-derivative generators are available in single unit form for power outputs from about 8 MW up to about 25 MW. These outputs fall conveniently into the typical power outputs required in the oil and gas production industry, such as those on offshore platforms.
2.1.2 Light Industrial Gas Turbines
Some manufacturers utilize certain of the advantages of the aero-derivative machines, i.e. high power-to-weight ratio and easy maintenance. The high power-power-to-weight ratios are achieved by running the machines with high combustion and exhaust temperatures and by operating the primary air compressors at reasonably high compression ratios i.e. above 7. A minimum of metal is used and so a more frequent maintenance programme is needed. Easier maintenance is achieved by designing the combustion chambers, the gas generator and compressor turbine section to be easily removable as a single modular type of unit. The ratings of machines in this category are limited to about 10 MW.
2.1.3 Heavy Industrial Gas Turbines
Heavy industrial gas turbines are usually to be found in refineries, chemical plants and power utilities. They are chosen mainly because of their long and reliable running times between major maintenance overhauls. They are also capable of burning most types of liquid and gaseous fuel, even the heavier crude oils. They also tend to tolerate a higher level of impurities in the fuels. Heavy industrial machines are unsuitable for offshore applications
because:-• Their poor power-to-weight ratio means that the structures supporting them would need to be much larger and stronger.
• Maintenance shutdown time is usually much longer and is inconvenient because the machine must be disassembled into many separate components. A modular concept is not possible in the design of these heavy industrial machines.
• The thermodynamic performance is usually poorer than that of the light and medium machines. This is partly due to the need for low compression ratios in the compressor.
They do, however, lend themselves to various methods of heat energy recovery e.g. exhaust heat exchangers, recuperators on the inlet air.
Figures 2.1 and 2.2 show the relative costs and weights for these types of machines.
2.1.4 Single and Two-shaft Gas Turbines
There are basically two gas turbine driving methods, known as ‘single-shaft’ and ‘two (or twin) shaft’ drives. In a single-shaft gas turbine, all the rotating elements share a common shaft. The common elements are the air compressor, the compressor turbine and the power turbine. The power turbine drives the generator.
In some gas turbines, the compressor turbine and the power turbine are an integral component. This tends to be the case with heavy-duty machines.
Figure 2.1 Relative cost of gas turbo-generators versus power rating.
Figure 2.3 Single-shaft gas turbine.
Figure 2.4 Two-shaft gas turbine.
In a two-shaft gas turbine the compressor is driven by a high pressure turbine called the compressor turbine, and the generator is driven separately by a low pressure turbine called the power turbine.
The basic arrangement is shown in Figure 2.4.
removable coupling shaft between the two turbines. Some points to consider with regard to the two types of driver
are:-a) High speed of rotation tends to improve the compressor and turbine efficiency. Hence, with two separate shafts, the best thermodynamic performance from both turbines and the compressor is obtainable.
b) Using aero-derivative machines means that a simple ‘add on’ power turbine can be fitted in the exhaust streams of the aero engine. This enables many manufacturers to design a simple power turbine and to use a particular aero engine.
c) Two-shaft machines are often criticised as electrical generators because of their slower response to power demands in comparison with the single-shaft machines. This can be a problem when a two-shaft machine may have to operate in synchronism with other single-shaft machines or steam turbine generators. Sometimes the slower response may affect the power system performance during the starting period of large motors. A power system computerised stability study should be carried out to investigate these types of problem.
Some of the recent aero engines could be called ‘three-shaft’ arrangements because within the gas generator there are two compressor turbines and two compressors.
2.1.5 Fuel for Gas Turbines
The fuels usually consumed in gas turbines are either in liquid or dry gas forms and, in most cases, are hydrocarbons. In special cases non-hydrocarbon fuels may be used, but the machines may then need to be specially modified to handle the combustion temperatures and the chemical composition of the fuel and its combustion products.
Gas turbine internal components such as blades, vanes, combustors, seals and fuel gas valves are sensitive to corrosive components present in the fuel or its combustion products such as carbon dioxide, sulphur, sodium or alkali contaminants, see also sub-section 2.2.5.
The fuel can generally be divided into several
classifications:-• Low heating value gas.
• Natural gas.
• High heating value gas.
• Distillate oils.
• Crude oil.
• Residual oil.
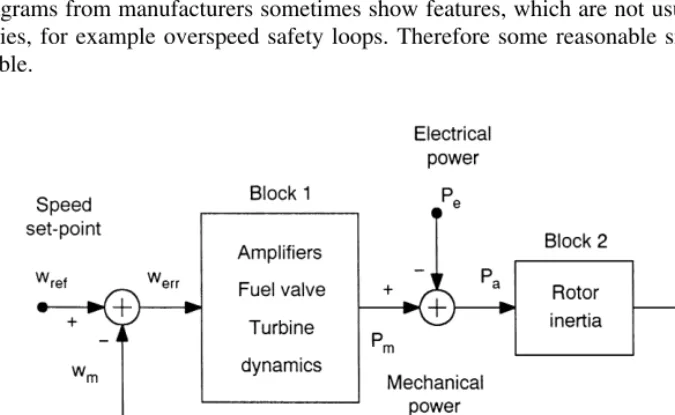
2.2 ENERGY OBTAINED FROM A GAS TURBINE
Figure 2.5 Gas turbine thermodynamic cycle. Simple-cycle gas turbine.
‘simple-cycle’ version of the Joule cycle. The main components of the gas turbine are shown in Figure 2.5.
The thermodynamic relationships used to describe the operation of the gas turbine are the pressure (P) versus volume (V) characteristic in Figure 2.6 and the temperature (T) versus entropy (S) characteristic in Figure 2.7. These figures also show the effect of practical inefficiencies that occur both in the air compressor and the turbine.
Air is drawn into the compressor at atmospheric pressureP1(in practice slightly lower due to
the inlet silencer, filter and ducting) and atmospheric temperature T1, and compressed adiabatically
to a higher pressure P2 to reduce its volume to V2 and raise its temperature to T2. The adiabatic
compression is given by the following equations; see standard textbooks e.g. References 1 to 5. P2V2
T2
= P1V1
T1
=constant (2.1)
P2V2γ =P1V1γ =constant (2.2)
The work done in the compressor per kg of fluid Uc is,
Uc= γ
γ −1(P2V2−P1V1) (2.3) The following standard relationships apply,
P1V1=RT1 (2.4)
P2V2=RT2 (2.5)
Cp−Cv=R (2.6)
Cp
Figure 2.6 Pressure versus volume in the thermodynamic cycle.
Where,Cp is the specific heat of the air at constant pressure, kcal/kg K≃1.005 Cv is the specific heat of the air at constant volume, kcal/kg K≃0.718
R is the particular gas constant for air, kJ/kg K≃0.287 γ is the ratio of specific heats≃1.4
Substitute (2.4, 2.5 and 2.8) into (2.1),
Uc=Cp(T2−T1)kJ/kg (2.9)
The air leaving the compressor at pressureP2 passes into the combustion chamber where its
temperature is raised to T3, at constant pressure.
The hot air–fuel mixture burns and the gaseous products of combustion pass into the turbine where the pressure falls to the atmospheric pressure P4=P1 (in practice slightly higher due to the
resistance or ‘back pressure’ of the exhaust silencer and ducting). The exhaust gas temperature is T4 and is lower than the combustion temperature T3. (The ducting systems should be arranged so
that the exhaust gas is discharged at a point far enough away from the inlet ducting entrance that no interaction occurs i.e. T4 does not influence T1.)
The turbine expansion process can be described by similar equations to (2.1) through (2.7), with T3 replacingT2 andT4 replacingT1. Hence the work done by the turbine (Ut) is,
Ut =Cp(T3−T4)kJ/kg (2.10)
The heat supplied by the fuel isCp (T3−T2).
In a conventional gas turbine the turbine supplies power to drive its compressor and so the power available to drive a generator is the net power available from the turbine. Neglecting ineffi-ciencies in the compressor and the turbine, the work done on the generator at the coupling of the gas turbine isUout,
Uout=Ut −Uc=Cp(T3−T4−T2+T1)kJ/kg (2.11)
The ideal cycle efficiencyηi of the gas turbine is:
ηi =
=1− Rejection temperature difference
From here onwards the following substitutions will be used in order to keep the presentation of the equations in a simpler format.
β= γ −1
Where subscript ‘c’ refers to the compressor and ‘t’ to the turbine, the absence of a subscript means a general case.
Divide (2.2) by (2.13) to obtain an expression for the compressor,
It is of interest to determine the work done on the generator in terms of the ambient temperature T1 and the combustion temperatureT3.
From (2.14),
The ideal cycle efficiencyηi can also be expressed in terms ofT1 and T3.
ηi =1−
Figure 2.8 Per-unit pressure ratio versus power rating.
2.2.1 Effect of an Inefficient Compressor and Turbine
Frictional losses in the compressor raise the output temperature. Similarly the losses in the turbine raise the exhaust temperature. These losses are quantified by modifying the temperaturesT2 and T4
to account for their increases.
The compression ratio (P2/P1) of the compressor is usually given by the manufacturer and
therefore the temperature of the air leaving the compressor is easily found from (2.13). If the efficiency of compression ηc is known e.g. 90% and that of the turbine ηt is known e.g. 85% then a better estimate of the output energy can be calculated. In this situationT2 becomesT2e and T4 becomes T4e, as
follows:-These would be the temperatures measurable in practice. In (2.14) and (2.15) the pressure ratios are theoretically equal, and in practice nearly equal, hence:
T2 T1
= T3
T4
=rpβ (2.19)
Whererp is the pressure ratio P2 P1
or P3 P4
In practice the temperatures T1 and T3 are known from the manufacturer or from measuring
instruments installed on the machine. The pressure ratiorpis also known. The ratio of specific heats is also known or can be taken as 1.4 for air. If the compressor and turbine efficiencies are taken into account then the practical cycle efficiencyηp of the gas turbine can be expressed as:
ηp= T3(1−rp
δ)η
cηt−T1(rpβ−1) T3ηc−T1(rp−1+ηc)
(2.20)
which has a similar form to (2.17) for comparison.
2.2.1.1 Worked example
A light industrial gas turbine operates at an ambient temperature T1 of 25◦C and the combustion
temperature T3 is 950◦C. The pressure ratiorp is 10.
If the overall efficiency is 32% find the efficiency of the compressor assuming the turbine efficiency to be 86%.
From (2.20),
T1=273+25=298◦K T3=273+950=1223◦K
Therefore,
ηp=0.32= 1223(1.0−0.51796)ηc(0.86)−298(1.93063−1.0)
1223ηc−298(1.93063−1.0+ηc)
Transposing forηc results inηc=0.894. Hence the compressor efficiency would be 89.4%.
2.2.2 Maximum Work Done on the Generator
If the temperaturesT2eandT4eare used in (2.11) to compensate for the efficiencies of the compressor and turbine, then it is possible to determine the maximum power output that can be obtained as a function of the pressure ratio rp.
The revised turbine work doneUt e is,
Ut e=Cp(T3−T4)ηt kJ/kg (2.21)
The revised compressor work done Uce is,
Uce=Cp(T2−T1)
1
ηc kJ/kg (2.22)
The revised heat input from the fuel Uf e is,
Uf e=Cp(T3−T2e)kJ/kg (2.23)
Substituting for T2,T2eand T4 gives the resulting output work doneUouteto be,
Uoute=Ut e−Uce=Cp(T3−T3rpδ)ηt−Cp
To find the maximum value ofUoutedifferentiateUoutewith respect toγpand equate the result to zero. The optimum value ofγp to give the maximum value ofUoute is,
Where
d = 1
2δ
which when substituted in (2.26) gives the maximum work done Uoutemax.
2.2.2.1 Worked example
Find rpmaxfor the worked example in sub-section 2.2.1.1.
Given that,
T1 =298K, T3=1223◦C,
r =1.4, ηt =0.86 andηc=0.894 d = γ
2(1−γ ) =
1.4
2(1.0−1.4) = −1.75
rpmax=
298 1223(0.894)(0.86)
−1.75
=0.3169−1.75=7 .4
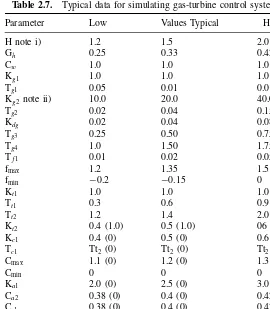
2.2.3 Variation of Specific Heat
As mentioned in sub-section 2.2 the specific heatCp changes with temperature. From Reference 4, Figure 4.4, an approximate cubic equation can be used to describeCp in the range of temperature 300 K to 1300 K when the fuel-to-air ratio by mass is 0.01, and for the air alone for compression, as shown in Table 2.1. The specific heat for the compressor can be denoted asCpc and for the turbine Cpt. The appropriate values ofCpc and Cpt can be found iteratively from the cubic expression and equations (2.24) and (2.25). At each iteration the average ofT1andT2can be used to recalculateCpc,
and T3 and T4 to recalculate Cpt. The initial value of γ can be taken as 1.4 in both cases, andCv
can be assumed constant at 0.24/1.4 = 0.171 kcal/kg K. The pressure ratio is constant. Having found suitable values of Cpc and Cpt it is now possible to revise the equations for thermal efficiency ηpa and output energyUoutea, where the suffix ‘a’ is added to note the inclusion of variations in specific
heatCp.
Table 2.1. Specific heatCpas a cubic function of absolute
temper-ature K in the range 373 K to 1273 KCp=a+bT+cT2+dT3
Fuel-air Cubic equation constants ratio
a×100 b×10−4 c×10−7 d×10−10
The energy equations for the compressor and turbine become,
Ucea =Cpc(T2−T1)
1
ηc
kJ/kg (2.28)
and
Ut ea =Cpt(T3−T4)
1
ηt
kJ/kg (2.29)
Also assume that the specific heat Cpf of the fuel–air mixture is the value corresponding to the average value ofT2 andT3, see Reference 4, sub-section 4.7.1, (2.23).
Hence the fuel energy equation becomes, from (2.23),
Uf ea=Cpf(T3−T2ea)kJ/kg (2.30)
Where
T2ea=
T1(rpβc −1+ηc) ηc
(2.31)
Whererc andrt apply to the compressor and turbine and are found fromCpc,Cpt andCv. The work done on the generator is now,
Uoutea=Cpt T3(1−rpδt)ηt− CpcT1
ηc
(rpβt−1) (2.32)
and
T4ea =T3(ηtrpδc +1−ηt)
From Uf ea andUoutea the thermal efficiencyηpa can be found as,
ηpa = Uoutea
Uf ea (2.33)
2.2.4 Effect of Ducting Pressure Drop and Combustion Chamber Pressure Drop
Practical gas turbines are fitted with inlet and exhaust silencing and ducting systems to enable the incoming air to be taken from a convenient source and the outgoing gas to be discharged to a second convenient location. These systems can be long enough to create significant pressure drops at the inlet and outlet of the gas turbine itself. The inlet system reduces the pressure at the entry to the compressor, by an amount P1. The exhaust system increases the pressure at the exit of the power turbine, by an amount P4.
The effects of P1, P23 and P4 can be found by modifying their corresponding pressure
ratios,rpcfor the compressor and rpt for the turbine, and using the binomial theorem to simplify the results.P23 andP4 apply to the turbine pressure ratio.
After a gas turbine has been operating for a long time the inlet filter pressure drop may become high enough to indicate that the filter needs cleaning. The drop in pressure across silencers will remain almost constant; the effect of ingress of particles or development of soot can be neglected.
The pressure ratio terms in (2.31) and (2.32) are of the general form,
y+y=
Where the second and higher orders ofare neglected. If the initial values are deducted then the expression relating the small changes becomes,
nywn−1w+wny =nxn−1x (2.37) Hence the change iny becomes,
y= nx
n−1 wn x−
ny
ww (2.38) For the compressor it is assumed that the inlet pressure is increased by P1. The pressure
ratio remains unchanged and so the change in output pressure is,
P2 =rpP1
Since the pressure ratio is unchanged the output temperature will be unchanged atT2.
The heat from the fuel is a function ofT2 and therefore it will also be unchanged.
For the turbine there are three pressure drops to consider. One for the compressor discharge P2, one for the practical throttling effect in the combustion chamberP23 and one for the turbine
exhaust pressure due to ducting P4. The two pressure drops at the inlet to the turbine can be
The turbine energy changes from Ut ea toUt ea+Ut ea. Substitute (2.40) into (2.29),
The change in efficiencyηpa in (2.33) is,
ηpa+ηpa=
The change in work done on the generator
Uoutea=Ut ea kJ/kg (2.44)
Note that in the above analysis the signs of the practical changes are,
P1 is negative P23 is negative
and P4 is positive
The pressure dropsP1 andP4 are dependent upon the layout of the gas turbine generator,
the dimensions of the ducting systems and the specification of silencers and filters.P23is fixed by the
design of the combustion system and cannot be changed by external factors such as ducting systems.
2.2.4.1 Typical values of pressure drop losses
A newly installed gas turbine generator can be taken to have the typical losses given in Table 2.2.
2.2.5 Heat Rate and Fuel Consumption
The heat rate is the ratio of heat given up by the fuel, in terms of its lower calorific or heating value (LHV), to the power available at the gas turbine coupling to its generator. It has the SI units of kJ/kWh. The lower heating value of typical fuels is given in Table 2.3.
The heat rate for a particular gas turbine will be given by its manufacturer at ISO conditions, and at various ambient temperatures. The typical variation of heat rate and power output, in relation to their ISO values, are shown in Figure 2.10. For a definition of ISO conditions see sub-section 2.3.2.
Table 2.3. Lower heating values of fuels Fuel Lower heating value (LHV)
MJ/m3for gases
MJ/kg for liquids
Btu/ft3for gases
Btu/lb for liquids
GASES
Natural gas 35.40 to 39.12 950 to 1050 Methane 33.94 911 Ethane 60.77 1,631 Propane 87.67 2,353 Butane 115.54 3,101 Hydrogen 10.17 273 Hydrogen sulphide 23.14 621
LIQUIDS
Diesel oil 45.36 19,500 Kerosene 41.87 18,000 Distillate 44.89 19,300 Crude oil 44.66 19,200
Figure 2.11 Heat rate and efficiency versus power rating.
The reduction in output power is typically 0.5 to 0.8%/◦C. The fuel consumption can be calculated approximately from,
Fuel consumption= Power output×Heat rate
Fuel LHV m
3
/h(or kg/h)
For situations where there is a mixture of gases it is advisable to consult the manufacturer of the gas turbine, since he will have a data bank containing all kinds of fuel compositions and heating values.
The heat rate and overall thermal efficiencies for typical modern gas turbines in the range of ISO power ratings 1 MW to 200 MW are shown in Figure 2.11. The data were derived from Reference 6.
2.3 POWER OUTPUT FROM A GAS TURBINE
In sub-section 2.2 the performance of a gas turbine was determined as the energy obtainable at the output shaft coupling. The energy equations are based on a unit of mass flow, 1.0 kg/s, of the fluid passing through the gas turbine i.e. from the air intake to the exhaust aperture.
The mass flow through the turbine is about 1% higher than that through the compressor because of the presence of the burnt fuel. Hence the mass flow rate (m) to produce the output power is,
m= Output power to the generator
Output energy per unit mass kg/s
= Wout
Uout
kW kg
kj =kg/s
Therefore it is a simple matter to predetermine the required output power and divide this by the specific energy available to the generator. The result is then the mass flow rate.
2.3.1 Mechanical and Electrical Power Losses
The power and specific energy available to drive the generator determined in the previous sub-section are those at the output shaft of the gas turbine. In most situations in the oil industry, where these machines seldom are rated above 40 MW, a speed-reducing gearbox is placed between the turbine and the generator. The generators are usually 4-pole machines that operate at 1500 or 1800 rev/min. The power loss in a typical gearbox is about 1.5% of the rated output power. Let the gearbox efficiency beηgb.
The efficiency (ηgen) of electromechanical conversion in the generator can be defined as,
ηgen=
Power output at the terminals Power input to the shaft coupling pu
Most rotating electrical machines above about 500 kW have efficiencies above 95%, which increases to about 98% for large machines in the hundreds of megawatts range. Their losses are due to windage between the rotor and the stator, friction in the bearings and seals, iron and copper electrical losses.
In some situations, such as ‘packaged’ gas turbine generators, all the necessary auxiliary electrical power consumers are supplied from the terminals of the generator through a transformer and a small motor control centre (or switchboard). These auxiliaries include lubricating oil pumps, fuel pumps, filter drive motors, cooling fans, purging air fans, local lighting, and sump heaters. Some of these operate continuously while others are intermittent. A rule-of-thumb estimate of the consumed power of these auxiliaries is between 1% and 5% of the rated power of the generator.
Care needs to be taken when referring to the efficiency of a gas-turbine generator set. See the worked example in Appendix F. The power system engineer is concerned with the power output from the terminals of the generator that is obtainable from the fuel consumed. Hence he considers the practical efficiencyηpa of the gas turbine, and the conversion efficiency through the gearboxηgb
and generator ηgen. Hence the Overall Thermal Efficiencyηpaowould be:-ηpao=ηpa×ηg×ηgen
2.3.2 Factors to be Considered at the Design Stage of a Power Plant
The electrical engineer should take full account of the site location and environmental conditions that a gas turbine generator will need to endure. These conditions can seriously effect the electrical power output that will be achievable from the machine. The starting point when considering the possible output is the ISO rating. This is the declared rating of the machine for the following
conditions:-• Sea level elevation.
• 15◦C (59◦F) ambient temperature.
• Basic engine, no losses for inlet or exhaust systems, no losses for gearbox and mechanical transmission.
• Clean engine, as delivered from the factory.
power versus ambient temperature characteristic. Therefore care must be exercised to be sure exactly which data are to be given and used.)
The following derating factors should be used in the estimation of the continuous site rating for the complete machine:
• ISO to a higher site ambient temperature, typically 0.5 to 0.8% per◦C.
• Altitude, usually not necessary for most oil industry plants since they are near sea level.
• Dirty engine losses and the ageing of the gas turbine, assume 5%.
• Fuel composition and heating value losses, discuss with the manufacturer.
• Silencer, filter and ducting losses, assume 2 to 5%.
• Gearbox loss, typically 1 to 2%.
• Generator electromechanical inefficiency, typically 2 to 4%.
• Auxiliary loads connected to the generator, typically 1 to 5%.
2.3.2.1 Dirty engine losses
Consideration should be given to the fact that engines become contaminated with the combustion deposits, the lubrication oil becomes less efficient, blades erode and lose their thermodynamic efficiency and air filters become less efficient due to the presence of filtered particles. These effects combine to reduce the output of the machine. A rule-of-thumb figure for derating a gas turbine for dirty engine operation is 5%. This depends upon the type of fuel, the type of engine, the environment and how long the engine operates between clean-up maintenance periods. Individual manufacturers can advise suitable data for their engines operating in particular conditions. Dirty engine conditions should be considered, otherwise embarrassment will follow later once the machine is in regular service.
2.3.2.2 Fuel composition and heating value losses
The chemical composition and quality of the fuel will to some extent influence the power output. However, it is usually the case that more or less fuel has to be supplied by the fuel control valve for a given throughput of combustion air. Hence it is usually possible to obtain the declared normal rating from the machine, but attention has to be given to the supply of the fuel. In extreme cases the profile of the fuel control valve may require modification so that adequate feedback control is maintained over the full range of power output. The appropriate derating factor is usually 100%, i.e. no derating.
2.3.2.3 Silencer, filter and ducting losses
The amount of silencing and filtering of the inlet combustion air depends upon the site environment and the operational considerations.
Site environmental conditions may be particularly bad, e.g. deserts where sand storms are frequent; offshore where rain storms are frequent and long lasting. The more filtering that is required, the more will be the pressure lost across the filters, both during clean and dirty operation. This pressure drop causes a loss of power output from the machine.