DEMoGRAPHIc STATUS AMoNG ADoLEScENT GIRLS IN INDoNESIA
Dwi Susilowati1
AbstrAct
background: Adolescent need special attention due to their physical and psychosocial development. Studies about nutritional status of adolescent girls have been least explored in Indonesia. Objective: to assess overweight adolescence girls related to their socio-demographic condition. Methods: the data was part of the Basic Health Research 2010, which was a cross sectional and non intervention study. It covered 33 provinces, 441 districts/municipalities, and 70,000 households. The sampling was based on economical status and urban/rural ratio. Body Mass Index (BMI) was calculated from weight and height measured from all participants. The author analyzed 21,799 non pregnant girls aged 10–19 years by calculating Crude odds ratio and Adjusted odds ratio between overweight and normal weight and their socio demographic variables. results: 45.3% underweight (BMI < 18.5), 44.0% normal weight (BMI 18.5–22.9), 5.7% overweight-1 (BMI 23.0–24.9), 4.0% overweight-2 (25.0–29.9) and 1.1% obese (BMI ≥ 30). Those who were married were 1.87 fold more likely to be overweight (95% CI: 1.48–2.36), those who lived at urban area were 1.26 fold more likely to be overweight (95% CI: 1.09–1.45). In adjusted models, those aged 10–12 years were 1.48 fold more likely to be overweight (95% CI: 1.25–1.76) and those with the highest quintile was 1.82 fold more likely to be overweight (95% CI: 1.47–2.24). conclusion: The high levels of overweight among adolescent girls were a public health concern. A higher prevalence of overweight was mainly found in married adolescent, those who lived in urban area, the younger ones and those with higher socioeconomic strata. It needs a comprehensive adolescent health programs.
Key words: overweight, girls, adolescent, Body Mass Index, married, rural, urban, socioeconomic status, education
AbstrAk
Remaja memerlukan perhatian khusus terkait perkembangan fisik dan kejiwaannya. Penelitian status gizi remaja putri masih kurang dikerjakan di Indonesia. menilai masalah gizi lebih di antara remaja putri terkait kondisi socio-demografinya. data dari Riset Kesehatan Dasar 2010, berupa studi potong lintang non-intervensi. Meliputi 33 provinsi, 441 kabupaten/ kotamadya, dan 70.000 rumah-tangga. Sampel berdasarkan status ekonomi dan ratio kota/desa. Body Mass Index (BMI) dihitung dari berat dan tinggi. Penulis menganalisa 21.799 remaja putri usia 10–19 tahun yang tidak hamil dengan menghitung odd rasio kasar dan odd rasio yang disesuaikan antara gizi lebih dan gizi normal terhadap variable sosio-demografiknya. 45,3% kurang gizi (BMI < 18,5); 44,0% gizi normal (BMI 18,5–22,9); 5,7% gizi lebih-1 (BMI 23,4–24,9); 4,0% gizi lebih-2 (25,0–29,9) dan 1,1% kegemukan (BMI ≥ 30). Mereka yang menikah kemungkinannya 1,87 kali untuk gizi lebih (95% CI: 1,48–2,36), mereka yang tinggal di perkotaan kemungkinannya 1,26 kali untuk gizi lebih (95% CI: 1,09–1,45). Pada model yang sudah disesuaikan, yang berusia 10–12 tahun kemungkinannya 1,48 kali untuk gizi lebih (95% CI: 1,25–1,76) dan mereka dengan tingkat sosio ekonomi yang lebih tinggi kemungkinan untuk gizi lebih adalah besar terutama pada kuintil teratas kemungkinannya 1,82 kali untuk gizi lebih (95% CI: 1,47–2,24). Kesimpulan: Tingkat gizi lebih yang tinggi di antara remaja putri merupakan masalah kesehatan masyarakat. Prevalensi gizi lebih yang tinggi dijumpai pada remaja yang menikah, mereka yang tinggal diperkotaan, remaja usia muda dan mereka yang berasal dari socio-ekonomi tinggi. Untuk memperoleh status gizi yang lebih baik pada remaja putri diperlukan inisiatif kesehatan remaja yang komprehensif.
kata kunci: gizi lebih, remaja , putri, Body Mass Index, menikah, desa, kota, status socio-ekonomi, pendidikan.
Peneliti Pusat Humaniora, Kebijakan Kesehatan dan Pemberdayaan Masyarakat; Badan Penelitian dan Pengembangan Kesehatan - Kementerian Kesehatan, Jl. Indrapura 17 Surabaya 60176
INTRoDUcTIoN
The global epidemic of overweight and obesity is rapidly becoming a major public health problem in many parts of the world (York DA, 2004). Accordingly, to control the adult obesity epidemic, it is important to study the growth characteristics of adolescents who are at risk for adult obesity.
The increasing prevalence of overweight and obesity has been linked with various diet-related chronic diseases among others diabetes mellitus, cardiovascular disease, stroke, hypertension and certain cancers, although in relation for predicting adverse cardiovascular outcomes, it is suggested to combine BMI and waist circumference (Hurt RT, 2010).
Obesity generally refers to excessive adipose
tissue relative to lean mass; the exact definition of
excessive has not been standardized. BMI as a clinical measure of obesity to be used in many settings, and has been advocated for use in from children to adults. (Barlow SE, 2002 and Lobstein T, 2004). The formula for BMI was derived, in part, to adjust body weight for height, with the goal of minimizing the effect of stature on body weight (Dietz WH, 1998).
In some Asian populations the prevalence of obesity is lower than that in Europe, the health risks associated with obesity occur at a lower BMI in Asian populations. Some ethnic such as Polynesians tend to be muscular and have a higher BMI than Europeans, but they had a lower body fat levels for the same BMI.
Those findings suggest that the current WHO criteria to define overweight and obesity using BMI may not
be appropriate for some populations in the Western
Pacific Region (WHO, 2000a) including Indonesia.
Different Socio Economic Status (SES) groups are at different risks, and the relationship between obesity and SES varies across countries (Wang, 2001). In developing countries high-SES groups are more likely to be obese than their low-SES counterparts, whereas low-SES groups are at increased risk in industrialized countries (Wang, 2002). There were complex patterns in the association between SES and overweight among children and adolescents (Wang, 2006 and Gortmaker SL, 1993). Therefore it is important to update the Indonesian prevalence estimates of overweight in girl adolescents, and relate it with some socio demographics variables,
using the last national data of height and weight measurements.
METHoDS
The data used for this paper was part of the data collected for the Basic Health Research (Riset Kesehatan Dasar/Riskesdas) 2010 (NIHRD, 2010). Riskesdas 2010 was a community based health research that was used to evaluate Millennium Development Goals (MDGs) coverage related to health indicators and its related factors in national and provincial level in Indonesia. Data was gathered from May to August 2010. This paper analyzed the anthropometric status of non pregnant adolescent girls aged 10 to 19 years related to some determinants.
Design. The design of Riskesdas 2010 was cross sectional and non intervention study.
Location, population and sampling. The sample population represented all Indonesian households within 33 provinces. Each province was represented by a number of Block Census and represented number of households. Households were chosen based on 2010 Population Census List. The selected households were chosen by the Central Bureau of Statistic using two stages sampling, which was based on economical status and urban/rural ratio; 1st stage: random choosing the Block Census, 2nd stage: random choosing 25 households for every Block Census. All family members of the households participate in the study.
There were 2800 Block Census within 33 provinces; and the study covered 441 districts/municipalities out of 497 districts/municipalities in Indonesia. There were 70,000 randomly selected households. This study covers 99.9% of the selected Block Census, 99.1% of the selected households, and 99.4% of the related
family members. The number of sample was sufficient
to represent national and provincial level.
Data collecting and data entry. The data collecting and data entry were done by trained health
staffs with a qualification of at least academic level;
individual questioners. Age, gender, and race/ethnicity were recorded for all participants.
Data cleaning. The first data cleaning were done based on each province for certain variables, than the second data cleaning were done for all variables as a whole. To get an accurate and good quality of data, missing values, no responses and outliers were handled accordingly. Weighing of the data before the analysis was done.
Anthropometry. All respondents were measured for their weight and height (length for those aged less than 2 years). The height were measured using a “Multi-functional” height measurement that was specially design for the survey with a maximum height of two meters and precision of 0.1 cm. To measure the height of respondents aged two years and more, they were asked to remove their foot wear and to stand with heels together and their heads position so that the line of vision was perpendicular to the body. A wooden sliding block was brought down to the topmost on the head for the reading. Weight was measured using digital weighing scale “AND” that were calibrated every day with a precision of 0.1 kg, and minimal clothing was used for the weighing.
Body Mass Index and categorization. BMI was computed using the standard formula: BMI (kg/m2) = Weight (kg) /Height2 (m2) (WHO, 2011). Cases were overweight and obese adolescent girls with BMI category of ≥ 25.00 and control were those with BMI of 18.50–22.99. The BMI categorization referred to
Asia Pacific population (WHO, 1995, WHO, 2000a
and WHO, 2004). The ratio of cases and control in this study was 1:9. Marital status was categorized of those who were never married and those who were married or divorced. The study areas were rural and urban
based on official information. Age groups were: 10–12
years, 13–15 years and 16–19 years. Economical
status was a sum up of households’ food expenditures and non food expenditures. The total expenditure than were divided by the number of household members and categorized into 5 quintiles.
Statistical analysis. It was done using SPSS for Windows version 14. A number of risk factors were examined as to whether or not they were potential
confounders or effect modifiers. Unconditional logistic
regression analysis was used in order to determine the confounding effects and to determine the risk factors for overweight. A risk factor was considered to be a potential confounder if the univariate test had a P value < 0.25 which would be considered as a candidate for the multivariate model along with some known socio-demographic characteristics for overweight. Confounders were estimated by maximum like hood.
Ninety five percent confidence intervals were based on the standard error of coefficient estimates. Odds ratios
(OR) were estimated by the methods of maximum like hood.
Limitation. There was limitation of the operational management, among others because of unfriendly weather; there were no ships available for the two selected Block Census.
Ethical clearance. The ethical clearance was achieved from Health Ethical Committee of NIHRD. Written informed consent was obtained from study participants.
RESULTS
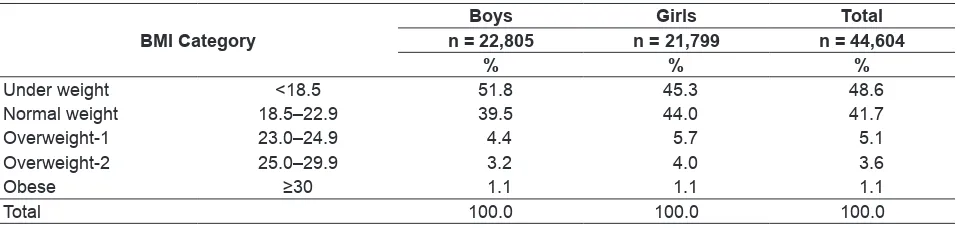
Out of 44,604 adolescent aged 10 to 19 years, there were 21,799 girls. About a half of the adolescents were underweight and predominantly boys. There were more overweight girls (BMI ≥ 23.0) as compared to overweight boys, 10.8% and 8.7% respectively.
Table 1. Body Mass Index category of adolescent boys and girls in Indonesia
BMI category
Boys Girls Total
n = 22,805 n = 21,799 n = 44,604
% % %
Under weight <18.5 51.8 45.3 48.6
Normal weight 18.5–22.9 39.5 44.0 41.7
Overweight-1 23.0–24.9 4.4 5.7 5.1
Overweight-2 25.0–29.9 3.2 4.0 3.6
Obese ≥30 1.1 1.1 1.1
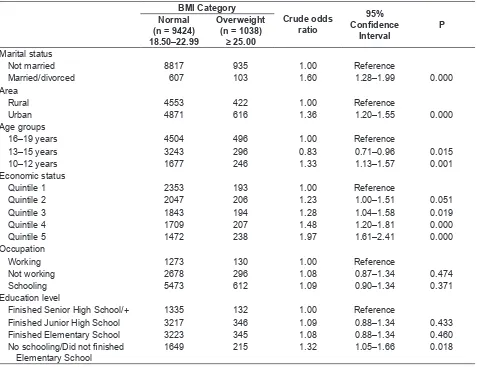
Adolescent girls that were married were 1.60 fold more likely to be overweight. Those who are living in urban were 1.36 fold more likely to be overweight. Those who were at the age of 10–12 years were 1.33 more likely to be overweight, while those who were at the age of 13–15 years were 0.83 fold less likely to be overweight. Those who were in higher economic status were 1.23 to 1.97 fold more likely to be overweight as compared to the lowest quintile. Whether they went to school, working or not working seems not related to their anthropometric status. Those who had no
schooling or did not finish Elementary School were
1.32 fold more likely to be overweight.
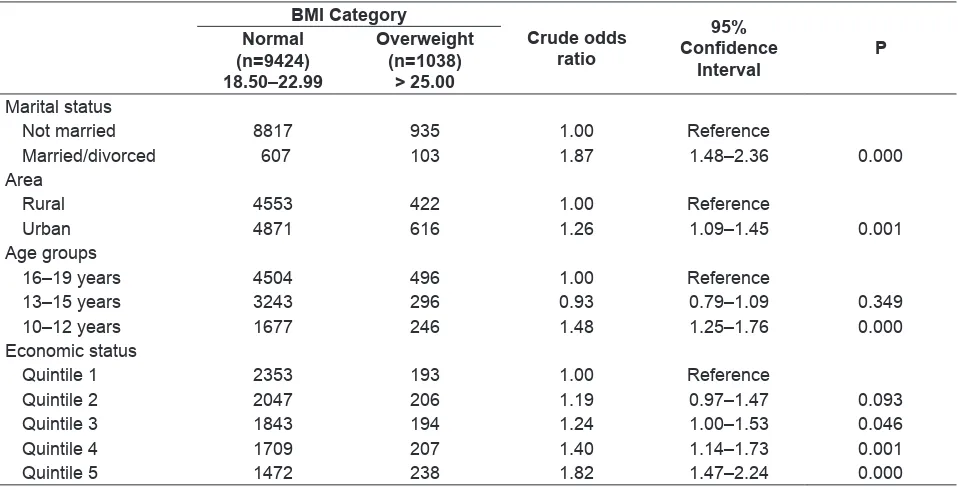
After controlling all related demographic characteristics that were associated with overweight, than those who were married were 1.87 fold more
likely to be overweight, those who stay at urban area were 1.26 fold more likely to be overweight. Young adolescent aged 10–12 years were 1.48 fold more likely to be overweight and those with higher socioeconomic were 1.24 to 1.82 fold more likely to be overweight.
DIScUSSIoN
Asian people with a high risk of type 2 diabetes and cardiovascular disease is substantial at BMI’s lower than the existing WHO cut-off point for overweight, which is 25.00 kg/m2. Thus, the cut-off point for observed risk for this study was considered 22.99 kg/m2 based on different Asian populations instead of 25.00 (WHO, 2004).
Table 2. Crude Odds ratios and 95% confidence intervals for the significant predictors of adolescents girls being overweight and obese (BMI > 25.00 kg/m2) versus normal weight (BMI 18.50–22.99 kg/m2)
BMI category
crude odds ratio
95%
Confidence
Interval
P Normal
(n = 9424) 18.50–22.99
overweight (n = 1038)
≥ 25.00
Marital status
Not married 8817 935 1.00 Reference
Married/divorced 607 103 1.60 1.28–1.99 0.000
Area
Rural 4553 422 1.00 Reference
Urban 4871 616 1.36 1.20–1.55 0.000
Age groups
16–19 years 4504 496 1.00 Reference
13–15 years 3243 296 0.83 0.71–0.96 0.015
10–12 years 1677 246 1.33 1.13–1.57 0.001
Economic status
Quintile 1 2353 193 1.00 Reference
Quintile 2 2047 206 1.23 1.00–1.51 0.051
Quintile 3 1843 194 1.28 1.04–1.58 0.019
Quintile 4 1709 207 1.48 1.20–1.81 0.000
Quintile 5 1472 238 1.97 1.61–2.41 0.000
Occupation
Working 1273 130 1.00 Reference
Not working 2678 296 1.08 0.87–1.34 0.474
Schooling 5473 612 1.09 0.90–1.34 0.371
Education level
Finished Senior High School/+ 1335 132 1.00 Reference
Finished Junior High School 3217 346 1.09 0.88–1.34 0.433
Finished Elementary School 3223 345 1.08 0.88–1.34 0.460
No schooling/Did not finished
Elementary School
There were 9.7% overweight (BMI 23.0–29.9) and 1.1% obese (BMI >30.0) adolescent girls in Indonesia. Those who were overweight were under risk to become obese, and since Indonesia has a big population of about 240 million than those percentages related to a huge number of adolescent that needs serious attention. There was an increasing trend of overweight in other countries that need attention as well (Hedley, 2004). A higher result of overweight was found among adolescent females aged 11–18 years in the United Arab Emirates (UAE). The proportion of subjects at risk for overweight ranged between 7–19% and the prevalence of overweight ranged between 6–15% (Al-Hourani HM, 2003). The high percentage of overweight among UAE adolescence girls, possibly because being overweight is considered accepted culturally among them and they had a better socioeconomic status as reported elsewhere. This study shows that the more better their socioeconomic than the more likely they became overweight, similar
result also reported at Karnataka, India (Griffiths P,
2005).
This study could contribute to nationally representative cross-sectional data, to manage and prevent overweight among adolescent, especially among adolescents girls. The data could be used for
Table 3. Adjusted Odds ratios and 95% confidence intervals for the significant predictors of adolescents girls being overweight and obese (BMI >25.00 kg/m2) versus normal weight (BMI 18.50–22.99 kg/m2)
BMI category
crude odds ratio
95%
Confidence
Interval
P Normal
(n=9424) 18.50–22.99
overweight (n=1038)
> 25.00 Marital status
Not married 8817 935 1.00 Reference
Married/divorced 607 103 1.87 1.48–2.36 0.000
Area
Rural 4553 422 1.00 Reference
Urban 4871 616 1.26 1.09–1.45 0.001
Age groups
16–19 years 4504 496 1.00 Reference
13–15 years 3243 296 0.93 0.79–1.09 0.349
10–12 years 1677 246 1.48 1.25–1.76 0.000
Economic status
Quintile 1 2353 193 1.00 Reference
Quintile 2 2047 206 1.19 0.97–1.47 0.093
Quintile 3 1843 194 1.24 1.00–1.53 0.046
Quintile 4 1709 207 1.40 1.14–1.73 0.001
Quintile 5 1472 238 1.82 1.47–2.24 0.000
monitoring the magnitude of the current and future overweight problems, and evaluating the effectiveness of intervention strategies done in Indonesia which among others referred to WHO (WHO, 2000b). The information could also contribute for doing international comparisons of adolescent overweight rates. This kind of study could also contribute to the Global Database on Body Mass Index, which is an interactive surveillance tool for monitoring nutrition transition in the world including Indonesia.
Limitations of the study. BMI generally correlates highly with adiposity, although it can sometimes misclassify total body fat content, e.g. athletes who are muscular have a high BMI, due to muscle weighing more than fat, and they will be considered as overweight while they were not so. Some determinants categorization were not well
defined such as rural-urban; some rural areas were
member. Occupation in this study was not clearly
defined; there was possibility of a combined condition
such as working plus going to school. Education level categorization did not consider the age of the respondents, this could cause bias.
Strength of the study. Weight and height measurements were easy to do by the adolescent themselves. BMI calculation is also easy to do and
its categorization was well defined.
coNcLUSSIoNS
The high levels of overweight among adolescent girls remain a major public health concern. A higher prevalence of overweight was mainly found in married adolescent, those who lived in urban area, the younger ones and those with higher socioeconomic strata. To achieve better nutritional status for adolescent girls there is a need to have a comprehensive adolescent health programs.
Acknowledgements
The author wishes to thank NIHRD that let the author to be part of this study and for the permission for using part of the data collected. The author also thanks all subjects who were willingly participated in this study and thank you to Prof. Bastaman that guided the analysis for this paper. The opinions or assertions contained herein are the private ones of
the author and are not considered as reflecting the
views of NIHRD.
REFERENcES
Al-Hourani HM, Henry CJ, Lightowler HJ. Prevalence of overweight among adolescent females in the United Arab Emirates. Am J Hum Biol. 2003 Nov-Dec;15(6): 758–64.
Barlow SE, Dietz WH. Management of child and adolescent obesity: summary and recommendations based on reports from pediatricians, pediatric nurse practitioners, and registered dietitians. Pediatrics. 2002; 110: 236–238. [PubMed]
Dietz WH, Robinson TN. Use of the body mass index (BMI) as a measure of overweight in children and adolescents. J Pediatr. 1998; 132: 191–193. [PubMed]
Gortmaker SL, Must A, Perrin JM, Sobol AM, Dietz WH. Social and economic consequences of overweight in adolescence and young adulthood. N Engl J Med. 1993; 329: 1008–1012. [PubMed]
Griffiths P and Bentley M, Women of higher socio-economic
status are more likely to be overweight in Karnataka,
India. Short Communication at European Journal of Clinical Nutrition. 2005; 59: 1217–1220.
Hedley AA, Ogden CL, Johnson CL, Carroll MD, Curtin LR, Flegal KM, Prevalence of overweight and obesity among US children, adolescents, and adults, 1999-2002. JAMA. 2004 Jun 16; 291(23): 2847–50. Hurt RT, Kulisek C, Buchanan LA, McClave SA, The
obesity epidemic: challenges, health initiatives, and implications for gastroenterologists. Gastroenterol Hepatol (N Y). 2010 Dec; 6(12): 780–92.
Lobstein T, Baur L, Uauy R. Obesity in children and young people: a crisis in public health. Obes Rev. 2004; 5(Suppl 1): 4–104. [PubMed]
National Institute of Health Research and Development (NIHRD), 2010, Riset Kesehatan Dasar (Riskesdas), Basic Health Research, 2010.
Wang Y and Zhang Q, Are American children and adolescents of low socioeconomic status at increased risk of obesity? Changes in the association between overweight and family income between 1971 and 2002, American Journal of Clinical Nutrition, Vol. 84, No. 4, 707–716, October 2006.
Wang Y, Cross-national comparison of childhood obesity: the epidemic and the relationship between obesity and socioeconomic status, Int. J. Epidemiol. (2001) 30 (5): 1129–1136.
Wang Y, Monteiro C, Popkin BM. Trends of obesity and underweight in older children and adolescents in the United States, Brazil, China, and Russia. Am J Clin Nutr 2002; 75: 971–7.
World Health Organization (WHO). Obesity and overweight, Fact sheet N°311, Updated February 2011, http:// www.who.int/mediacentre/factsheets/fs311/en/. World Health Organization (WHO). Physical status: the use
and interpretation of anthropometry. Report of a WHO Expert Committee. WHO Technical Report Series 854. Geneva: World Health Organization, 1995.
World Health Organization (WHO). WHO expert consultation. Appropriate body-mass index for Asian populations and its implications for policy and intervention strategies. The Lancet, 2004; 157–163.
World Health Organization (WHO)a, Western Pacific Region. The Asia Pacific perspective: Redefining obesity and
its treatment, IASO International Association for the Study of Obesity, 2000.
World Health Organization (WHO)b. Obesity: preventing and managing the global epidemic. Report of a WHO Consultation. WHO Technical Report Series 894. Geneva: World Health Organization, 2000.