- 1 - StatiStical yearbook | 2016|
ྱལ༌ོངས༌ྩིས༌དྱད༌བོད༌འིན།
Statistical Yearbook
of Bhutan 2016
September 2016
National Statistics Bureau
- 2
ORGANOGAM OF THE ROYAL GOVERNMENT OF BHUTAN
POST CONSTITUTIONAL ENACTMENT 2009
HIS MAJESTY, THE KING
- i - StatiStical yearbook | 2016| TABLE OF CONTENTS
TABLE OF CONTENTS
Preface ... i
Notes for users ... ii
Units of Measurement ... iii
Key Facts about Bhutan ... v
Bhutan ... vi
CHAPTER 1: POPULATION ... 1
TABLE 1.1: Projected Population by Sex, Bhutan (2010-2030) ... 3
1.2: Projected Population by Age Group and Sex, Bhutan (2015 & 2016 ... 4
1.3: Crude Birth Rate by Area and Dzongkhag, 2005 ... 5
1.4: General Fertility Rate, General Marital Fertility Rate and Total Fertility Rate by Area and Dzongkhag, 2005 ... 6
1.5: Age Speciic Fertility Rate by Age Group and Dzongkhag, 2005 ... 7
1.6: Crude Death Rate by Area and Dzongkhag, 2005 ... 8
1.7: Natural Population Growth Rate by Area and Dzongkhag, 2005 ... 9
1.8: infant Mortality Rate, Child Mortality Rate and Under 5 Mortality Rate by Dzongkhag, 2005 ... 10
CHAPTER 2: HEALTH ... 11
TABLE 2.1: Summary of Health Facilities and Personnel, Bhutan (2011-2015) ... 12
2.2: Type of Health Facilities by Dzongkhag, Bhutan, 2015 ... 13
2.3: Health Personnel by Category, Bhutan (2011-2015) ... 14
2.4: Top Ten Morbidity, Bhutan, 2015 ... 14
2.5: Top Ten inpatient Hospital Mortality, Bhutan, 2015 ... 15
2.6: Total Morbidity by Sex, Bhutan, 2015 ... 17
2.7: inpatient Cases in all Hospitals, Bhutan, 2015 ... 24
2.8: Outpatient Cases in all Hospitals, Bhutan, 2015 ... 32
2.9: Number of Patient Admissions & Average Length of Stay in Dzongkhag Hospitals, Bhutan (2011-2015 ... 40
2.10: immunization Status by Dzongkhag, Bhutan, 2015 ... 42
2.11: Nutritional and vitamin A Status of Children Atending Clinics, Bhutan (2011-2015 ... 43
ii -StatiStical yearbook | 2016|
2.13: Details of Maternal & Child Health Care Activities by Dzongkhag, Bhutan
(2011-2015) ... 44
2.14: Family Planning Methods by Type, Bhutan (2011-2015) ... 45
2.15: Number of Users of Family Planning Methods by Type, by Dzongkhag, Bhutan, 2015 ... 47
2.16: Number of Malaria Cases by Type and Deaths, Bhutan (20112015)... 48
2.17: Number of Tuberculosis Cases by Type and Deaths, Bhutan (2011-2015) ... 48
2.18: Types of Water and Sanitation Facility by Dzongkhag, Bhutan, 2015 ... 49
CHAPTER 3: EDUCATION ... 50
TABLE 3.1: Key Education indicators by Year, (2011-2015) ... 51
3.2: Number of Schools, institutes & Centres, Bhutan ... 52
3.3: Number of Students, Learners, Trainees and Novitiates, Bhutan, 2015 ... 53
3.4: Summary of Teachers, Lecturers, instructors, Trainers and Caregivers, Bhutan, 2015 ... 55
3.5: Number of Schools by Type and Dzongkhag, Bhutan, 2015 ... 56
3.6: Enrolment in institutions and at Tertiary level, Bhutan (2011-2015 ... 58
3.7: Number of Students by Grade, Bhutan (2011-2015) ... 59
3.8: Comparative Enrolment by Grade and Schools, (2014-2015) ... 60
CHAPTER 4: LABOUR AND EMPLOYMENT ... 63
TABLE 4.1: Type of Employment in Civil Service by Position Category, Bhutan (2011-2015) ... 64
4.2: Employment in Civil Servants by Working Agency, Bhutan, 2015 ... 66
4.3: Employment in Civil Servants by Type, Position Category & Sex, Bhutan, 2015 ... 70
4.4: Percentage Distribution of Employed Persons by Major Economic Activity and Sex,Bhutan, 2015 ... 72
4.5: Percentage Distribution of Employed Persons by Major Economic Activity and Sex, Bhutan, 2015 ... 72
4.6: Percentage Distribution of Employed Persons by Nature of Employment and Sex, Bhutan, 2015 ... 73
4.7: Percentage Distribution of Labour Force Participation, Employment Status by Age Group and Sex, Bhutan, 2015 ... 74
4.8: Number of Persons Employed by Age Group and Type, Bhutan, 2015 ... 75
4.9: Total Employed Persons by Age Group and Completed Level of Education, Bhutan, 2015 ... 76
4.10: Total Employed Persons by Level of Education and Dzongkhag, Bhutan, 2015 ... 78
- iii - StatiStical yearbook | 2016|
4.12: Employed Persons by Dzongkhag, Sex and Area of Residence, Bhutan, 2015 ... 81
4.13: Employed Persons who Worked During he Past One Week Prior to the Survey Period by Major Economic Activity and Hours of Work, Bhutan, 2015 ... 82
4.14: Employed Persons who Worked During he Past One Week Prior to the Survey Period by Nature of Employment and Hours of Work, Bhutan, 2015 ... 83
4.15: Employed Persons by Major Economic Activity and Level of Education, Bhutan, 2015 ... 84
4.16: Unemployed Persons by Age Group, Sex and Area of Residence, Bhutan, 2015 ... 86
CHAPTER 5: LAND USE AND AGRICULTURE ... 87
TABLE 5.1: Number of Agriculture Research and Extension Facilities, Bhutan (2011-2015) ... 88
5.2: Area Proportion by Altitude Zones as Percentage of Total Dzongkhag Area, Bhutan, 2010 ... 89
5.3: Area Proportion by Altitude Zones as Percentage of Total Country Area, Bhutan, 2010 ... 90
5.4: Distribution of Plant Protection Chemicals by Dzongkhag, Bhutan, (2010/11 – 2013/14) ... 91
5.5: Agriculture Land Holdings & Land Types by Dzongkhag, Bhutan, 2010 ... 92
5.6: Cultivated Area, Production and Yield of Major Crops by Dzongkhag, Bhutan, 2013 ... 93
5.7: Number of Livestock by Type and Dzongkhag, Bhutan (2013-2015) ... 94
5.8: Diary and Livestock Production by Type and Dzongkhag, Bhutan (2013-2015) ... 96
5.9: Fruit Production and Yield, Bhutan (2009-2013 ... 98
5.10: vegetables, Oilseeds, Spices and Pulses Production, Bhutan (2009-2013) ... 100
5.11: volume and value of Exports by Major Commodities, Bhutan (2011-2014 ... 101
5.12: volume and value of imports by Major Commodities, Bhutan (2011-2014) ... 102
5.13: Annual Average Price of Agricultural Commodities by Type, Bhutan (2011-2014) ... 103
5.14: imports and Sales of Food items by Food Corporation of Bhutan (2011-2015) ... 104
5.15: Quantity of Agricultural Produce Handled by Food Corporation of Bhutan (2011-2015) ... 105
CHAPTER 6: ENVIROMENT STATISTICS ... 107
TABLE 6.1: Area of Land-Use and vegetation by Types, Bhutan, 2010 ... 108
6.2: Area Proportion as Percentage of Total Dzongkhag Area by Type of Land Cover Bhutan, 2010 ... 109
iV -StatiStical yearbook | 2016|
6.4: Forest Area under Tree Cover by Dzongkhags, Bhutan, 2010 ... 111
6.5: Monthly Maximum and Minimum Average Temperature by Dzongkhag, Bhutan, 2015 ... 112
6.6: Total Monthly Rainfall at Existing Stations in Each Dzongkhag, Bhutan, 2015 ... 115
6.7: Details of Protected Areas in Bhutan, by Year of Establishment and Area, Bhutan, 2015 ... 118
6.8: Disposal of Logwood, Natural Resources Development Corporation Limited, Bhutan, (2011-2015) ... 119
6.9: Quantity of Timber Supplied and Royalties Realized by Dzongkhag, Bhutan (2014-2015) ... 120
6.10: Supply of Timber at Commercial, Concessional and Free by Royalties, Bhutan (2012-2015) ... 122
6.11: Distribution of Geographical Area by Agro-Ecological Zones, Bhutan, 2010 ... 123
6.12: Mineral Production by Type, Bhutan (2011-2015) ... 124
6.13: Mineral Production by Type and Use, Bhutan (2011-2015)... 125
6.14: Length of Roads by Type, Bhutan (2010-2015) ... 126
6.15: Length of Roads by Type and Dzongkhag, Bhutan, June 2015 ... 127
6.16: Number of Registered vehicles by Type and Region (2011-2015) ... 128
6.17: Total Electricity Generation and Supply, Bhutan (2011-2015) ... 130
6.18: Consumption of Electricity by Type of Consumer, 2015 ... 131
6.19: Percentage of Major Atraction to Bhutan, 2015 ... 131
6.20: import of Petroleum Products by volume and value (2011-2015) ... 132
6.21: Total Ghg Emissions in Bhutan, 2000 ... 133
6.22: PM 10 Concentration (Microgram/m3) for himphu Dzongkhag (2011-2015) ... 134
CHAPTER 7: INDUSTRIES ... 135
TABLE 7.1: Number of industrial Establishments by Sector, Bhutan (2011-2015) ... 136
7.2: Number of Licencesed Firms in Manufacturing and Mining industries by Sub Sector and Ownership, Bhutan (2012-2015) ... 137
7.3: Number of industries by Ownership, Size and Type, Bhutan (2011-2015) ... 138
7.4: Number of Contract Firms by Size, by Dzongkhag, Bhutan, 2015 ... 139
7.5: Number of industrial Firms, by Type, by Dzongkhag, Bhutan, 2015 ... 140
7.6: Number of industrial Firms in Small and Cotage by Dzongkhag, Bhutan, 2015 ... 141
7.7: Number of industrial Firms in Medium and Large by Dzongkhag, Bhutan, 2015 ... 142
- V - StatiStical yearbook | 2016|
7.9: Establishment by Type of Ownership and Category, Bhutan, 2016 ... 144
7.10: Establishments by Trade Region and Type of Ownership, Bhutan, 2016 ... 144
7.11: Establishments by Major Economic Activity and Category, Bhutan, 2016 ... 145
7.12: Establishments by Major Economic Activity by Dzongkhag, Bhutan, 2016 ... 145
7.13: Establishments by Type of Legal Organization and Category, Bhutan, 2016 ... 146
7.14: Establishments by Major Economic Activity and Type of Legal Organization, 2016 ... 148
7.15: Establishments by Nationality of Owners by Dzongkhag, Bhutan, 2016 ... 149
7.16: Establishments by Gender of Establishment Owners by Dzongkhag, 2016 ... 150
7.17: Number of Employees by Trade Region, Nationality, Gender and Nature of Employment, Bhutan, 2016 ... 151
7.18: Number of Employed Persons by Major Economic Activity, Nationality, Gender and Nature of Employment, Bhutan, 2016 ... 152
7.19: Number of Employees by Trade Region, Nationality and Gender, 2016 ... 152
7.20: Establishments by Dzongkhag and Reasons for Expansion, Bhutan, 2016 ... 154
CHAPTER 8: TANSPORT AND COMMUNICATION ... 155
TABLE 8.1: Number and Length of Motorable Bridges by Type, Bhutan, June 2016 ... 157
8.2: Number of Pedestrian Bridges Constructed Since 5h Five Year Plan by Dzongkhag, June 2016 ... 158
8.3: Number of Driving Licenses issued by Region, Bhutan (2011-2015) ... 159
8.4: Number of Passengers Carried & Revenue Earned by Druk Air Flights by Area of Operation (2011-2015) ... 160
8.5: Number of Flights Made by Druk Air by international and Domestic by Area of Operation (2011-2015) ... 162
8.6: Number of Passengers Carried & Revenue Earned by Tashi Air Flights by Area of Operation (2013-2015) ... 163
8.7: Number of Flights Made by Tashi Air by international and by Area of Operation (2013-2015)... 164
8.8: Number of Telephone Connection Capacity by Dzongkhag (2011-2015) ... 165
8.9: Number of Telephone Trunk Circuits, Bhutan, June 2016 ... 166
8.10: Number of Trunk Lines, Connection Capacities, Sets in Use & Mobile Subscribers (2011-2015) ... 168
8.11: Number of Telephone Trunk Calls and Revenue Earnings, Bhutan 2011-2015)... 169
8.12: Number of B-Mobile Trunk Calls and Revenue Earnings, Bhutan, (2012-2015) ... 169
8.13: Number of Tashicell Trunk Calls and Revenue Earnings, Bhutan (2011-2015) ... 170
8.14: Number of Postal infrastructures (2011-2015) ... 170
Vi -StatiStical yearbook | 2016|
8.16: Financial Services, Number and value of Money Order by Type,
Bhutan (2011-2015) ... 172
8.17: volume of Mail, by Type of Article, DHL (2011-2015) ... 173
CHAPTER 9: ENERGY ... 175
TABLE 9.1: Hydro Generating Stations and heir Capacities, Bhutan (2013-2015)... 176
9.2: Details of Diesel Generator Sets, Bhutan, 2015 ... 180
9.3: Major Transmission Lines, 2015 ... 182
9.4: Monthly Revenue from Sale of Energy from Chhukha Power Plant (2012-2015) ... 184
9.5: Monthly Revenue from Sale of Energy from Tala Power Plant (2012-2015) ... 185
9.6: Monthly Revenue from Sale of Energy from Kurichu Power Plant (2012-2015) ... 186
9.7: Monthly Revenue from Sale of Energy from Dagachhu Power Plant From 2015 ... 187
9.8: Details of Domestic Electrical Energy Consumption (2011-2015) ... 187
CHAPTER 10: TOURISM ... 188
TABLE 10.1: Annual international Tourist Arrivals by Country and Region, Bhutan (2011-2015) ... 189
10.2: Tourist Arrivals by Country of Residence and Revenue Receipts, Bhutan, (2011-2015) ... 194
10.3: Number of Tourist Arrivals by Season and Month, Bhutan (2010-2015). ... 194
10.4: Percentage of Tourist Arrivals by Purpose of visit, Bhutan, 2015 ... 195
10.5: Total Number of Tourist Arrivals by Dzongkhag, 2015 ... 195
10.6: Top Ten Tour Operators by Number of Tourists, Bhutan, 2015... 196
10.7: Top Ten Accommodations Providers by Bed Nights, 2015 ... 196
10.8: Total Number of Accommodation Providers by Bed Nights by Dzongkhag, 2015 ... 197
10.9: Percent of Top Ten Markets by Gender, Bhutan, 2015 ... 197
CHAPTER 11: FOREIGN TADE AND BALANCE OF PAYMENTS ... 198
TABLE 11.1: Balance of Trade, Bhutan, (2011-2015) ... 199
11.2: Top Ten Commodities of Exports, Bhutan, 2015 ... 199
11.3: Top Ten Commodities of imports, Bhutan, 2015 ... 200
11.4: Direction of Trade by import Ranking Order, Top Ten Country, 2015 ... 201
11.5: Direction of Trade by Export Ranking Order, Top Ten Country, 2015 ... 202
- Vii - StatiStical yearbook | 2016|
11.7: Gross international Reserves (End Period), Bhutan, 2010/11 to 2014/15 ... 204 11.8: Monthly Average Exchange Rates, Ngultrum per US $, (2011-2015) ... 205
CHAPTER 12: MONEY, BANKING AND FINANCE ... 206
TABLE
12.1: Monetary Survey: Royal Monetary Authority, Bhutan National Bank, Bank of Bhutan,
Bhutan Development Bank, Druk PNB Bank and T Bank
(2011-2015) ... 207
12.2: Monetary and Financial Statistics of Royal insurance Corporation of Bhutan
(2011-2015) ... 208
12.3: Monetary and Financial Statistics of Bhutan National Bank Limited,
(2011-2015) ... 209
12.4: Monetary and Financial Statistics of Bhutan Development Bank Limited,
December (2011-2015). ... 210
12.5: Monetary and Financial Statistics of Royal Monetary Authority of Bhutan,
(2011-2015) ... 211 12.6: Monetary and Financial Statistics, Bank of Bhutan Limited,
(2011-2015) ... 212 12.7: Monetary and Financial Statistics of T-Bank Ltd, December (2011- 2015) ... 213
12.8: Monetary and Financial Statistics of Druk PNB Bank Ltd., December
(2011-2015)…. ... 214 12.9: Monetary and Financial Statistics of Bhutan insurance Limited,
December (2011-2015) ... 215 12.10: investments of Financial institutions by industry, Amounts Outstanding,
(2011-2015) ... 216 12.11: interest Rates of Deposits in Financial institutions, 2011 to 2015 ... 219
12.12: interest Rates and Repayment Period by Sector and Type of Loan, Financial
institutions, Bhutan (2013-2014). ... 220 12.13: Royal Securities Exchange of Bhutan Ltd. Number of Share Holders, at the
End of December, (2011-2015). ... 222
12.14: Royal Securities Exchange of Bhutan Ltd. Market information at
the End of December, 2015 ... 223
12.15: Royal Securities Exchange of Bhutan Ltd. Total Traded volume at the
End of December, 2011 to 2015 ... 224 12.16: Royal Securities Exchange of Bhutan Ltd. Traded values, 2011 to 2015 ... 225 12.17: Dividend Declared by Company (2008-2013) ... 227
12.18: Bonus/Rights/Employee Stock Options (ESoP)/Of Market Transaction,
Viii -StatiStical yearbook | 2016|
CHAPTER 13: PUBLIC FINANCE ... 229
TABLE 13.1: Actual Annual Current Expenditure of the Government by Agency for the FY 2010/11 to 2014/15 ... 230
13.2: Actual Annual Capital Expenditure of the Government by Agency for the FY 2010/11 to 2014/15 ... 232
13.3: he Sector-wise Government Expenditures for the FY 2011/12 to 2014/15 ... 234
13.4: Summary of National Revenue of the Government by Source for the FY 2010/11 To 2014/15 ... 235
13.5: Fiscal Framework of Government, Bhutan, 2009/10 to 2013/14 ... 236
13.6: Revenue Collection by Sector, FY 2009/10 to 2013/14 ... 237
13.7: Government Debt Stock & Debt Service, 2009/10 to 2013/2014 ... 238
CHAPTER 14: PLAN OUTLAYS ... 239
TABLE 14.1: Tenth Plan Budgetary Outlay and Allocation, Bhutan (2008-2013) ... 240
14.2: Eleventh Plan Budgetary Outlay and Allocation, Bhutan (2013-2018) ... 242
14.3: Dzongkhag wise Ninth Five Year Plan Outlay, Bhutan (2002-2007)... 244
14.4: Dzongkhag wise Tenth Five Year Plan Outlay, Bhutan (2008-2013)... 245
14.5: Dzongkhag wise Eleventh Five Year Plan Outlay, Bhutan (2013-2018) ... 246
14.6: indicative Capital Allocation to Gewogs, Eleventh Five Year Plan (2013-2018) ... 247
CHAPTER 15: NATIONAL ACCOUNTS ... 254
TABLE 15.1: GDP by Economic Activity at Current Prices (2011-2015)... 255
15.2: Percentage Share of GDP by Economic Activity at Current Prices (2011-2015) ... 256
15.3: Sectoral Growth Rates of GDP in Constant Prices (2011-2015) ... 257
15.4: Gross Domestic Product by Major Sectors in Current Prices (2011-2015) ... 257
15.5: Percentage Share of GDP by Major Sector in Current Prices (2011-2015) ... 258
15.6: Year on Year GDP Growth (2011-2015) ... 258
15.7: GDP Share of Expenditure at Current Prices (2011-2015) ... 259
15.8: GDP by Expenditure at Current Prices (2011-2015) ... 260
CHAPTER 16: PRICES ... 261
TABLE 16.1: Year on Year inlation... 262
16.2: Year-on-Year Percent Change by Group Level ... 262
16.3: Month-on-Month index and Percent Change in the CPi by Overall index ... 264
16.4: Month-on-Month index & Percent Change by Domestic ... 265
- iX - StatiStical yearbook | 2016|
16.6: Month-on-Month index and Percent Change by Group Level ... 268
16.7: Monthly Producer Price index (PPi) by industry (September 2011=100) ... 270
16.8: Monthly Percentage Change in Producer Price index (PPi) by industry ... 272
16.9: Annual Percentage Change in Producer Price index (PPi) by industry ... 272
16.10: Monthly Producer Price index (PPi) by Product ... 274
16.11: Monthly Percentage Change in Producer Price index (PPi) by Product ... 276
16.12: Annual Percentage Change in Producer Price index (PPi) by Product ... 278
CHAPTER 17: CRIME ... 281
TABLE 17.1: Number of Crime incidents and Type of Ofences by Dzongkhag ... 282
17.2: Monthly Motor Accident by Dzongkhag ... 286
17.3: Motor vehicle Accident by Dzongkhag ... 287
17.4: Causes of Motor vehicle Accidents by Dzongkhags ... 288
17.5: Number of Houses Destroyed by Fire by Dzongkhag ... 292
17.6: Fines imposed for violation of Traic Rules by Division ... 293
List of Dzongkhags, Gewogs and Chiwogs, Bhutan, 2015 ... 294
- i - StatiStical yearbook | 2016| PREFACE
his Statistical Yearbook of Bhutan (SYB) 2016 publication is the 34th edition. it is a comprehensive
and systematic compendium of basic statistical information on the country’s socio-economic conditions.
he SYB is expected to serve as the principal source of information for planners, policy makers, researchers and academicians both within and outside Bhutan. he compilation is based on information gathered through periodic statistical censuses and surveys, as well as from administrative data maintained by various ministries, agencies, corporations and private organizations. his publication is also available through electronic services at www.nsb.gov.bt
Every efort has been made to ensure that this publication meets acceptable statistical standards. Data validation, compilation and updating protocols have been strictly observed with all the data disseminating/providing agencies. New data series on topics of interest are included as and when available. Brief explanatory notes on coverage and data sources, wherever possible, have also been provided for the beneit of the users.
herefore, the NSB would like to acknowledge the contribution of diferent ministries, agencies, corporations and private organizations that provided data and information for SYB 2016. in order to improve the quality of the forthcoming issues, we solicit comments and suggestions from the users of this yearbook.
Director General
ii -StatiStical yearbook | 2016|
1. Unless otherwise indicated, the present issue of the Yearbook contains statistics available as of December, 2015.
2. For some tables, there are footnotes indicating information speciic to each igure in the table.
3. he following notations are used in the tables:
… not available/not applicable
() negative igures
CY calendar year (from January to December)
FY iscal year (from July to June, example: 2014/15)
4. Detail igures in the tables may not add up to the totals because of rounding.
5. When contents of this book are to be quoted or copied in other publication/report, please
give due credit by referring the title of this yearbook (Example) Source: Statistical Yearbook of Bhutan 2016, National Statistics Bureau.
6. For additional information on data or for any other queries, please refer to the original source or National Statistics Bureau.
- iii - StatiStical yearbook | 2016| Numbering and Scientiic notations
Hundred = 102
housand = 103
Million = 106
Billion = 109
Trillion = 1012
A. Length Measurement
Metric Equivalents
II. Conversion from British to Metric Units (lengths)
1 inch = 2.539998 cm 1 m = 39.3370113 inches 1 foot = 0.3047997 m 1 m = 3.280843 feet
1 yard = 0.9143992 m 1 m = 1.093614 yard
1 mile = 1.609343 km 1 k = 0.6213717 miles
1 nautical mile = 1.853182 km
B. Area Measurements I. British Units
144 square inches = 1 square foot
mm = millimeter
iV -StatiStical yearbook | 2016|
II. Metric Units
100 square mm = 1 square cm
III. Conversion from British to Metric Units (Area) 1 square yard = 0.836 square m
C. Weight Measurements
I. British Units
16 dram = 1 ounce
III. Conversion from British to Metric Units
1 grain = 0.0648 g
1 ounce = 31.103 g
1 g = 15.432 grains
1 pound = 0.373 kg
1 tone = 1.016 metric tones
D. Conversion of Air Temperatures
i. Degree Celsius to degree Fahrenheit.
(9 x T)/5 + 32, where “T” is temperature in degree Celsius. ii. Fahrenheit to degree Celsius.
- V - StatiStical yearbook | 2016|
Land Area (Sq. km) 38,394
Forest Cover (percent) 70.5%
Projected Population (in nos.), 2016 768,577 Natural Population Growth Rate (percent), PHCB 2005 1.3
Average Household Size, (BMiS, 2010) 4.6
National Language Dzongkha
National Currency Ngultrum (Nu.)
Number of Hospitals, 2015 31
Number of Doctors, 2015 251
Number of Civil Servants, (as of 31st December 2015) 26,611 Number of Schools, institutes and Centers, 2015 2,065
Number of Teachers, Lecturers, instructors & Trainers, 2015 10,532 Number of Students (including institutes & NFE), 2015 215,170
Labour Force Participation Rate, (LFS 2015) 63.1
Unemployment Rate, (LFS 2015) 2.5
Telephone Sets in Use, 2015 21,460
B-Mobile Subscriber (Nos.), 2015 486,228 Tashicell Subscriber (Nos.), 2015 189,805 Postal infrastructure (Nos.), 2015 116
Total Road Length (Km.), June 2016 11,177
Number of Registered vehicles, 2015 75,190
Electricity Generation (MU), 2015 7,747.17 Electricity Exports (MU), 2015 5,721.12
Tourist Arrivals (dollar paying tourist), 2015 54,651 Revenue Earned from Tourism (million US $), 2015 71.05
Total industrial Establishments, 2015 54,904 Balance of Trade (million Nu.), 2015 (32,808.00)
Exchange Rate (Calendar Year), Nu. Per US $, 2015 64.14 Gross international Money Reserves (million US $), 2014/15 958.45
Total Eleventh Plan Budgetary Outlay (million Nu.) 2013-2018 213,291.46 GDP at Current Price (million Nu.), 2014/15 132,021.30 Annual Average inlation Rate (percent), 2015 4.58 Purchasing Power of Nu. 2015 (Base Year =2012) 82.58
Vi -StatiStical yearbook | 2016|
Location and Extent
Bhutan is a small and landlocked country, situated between China (Tibet) and india. it has an area of 38,394 square kilometers. it has east-west dimension (longest) stretching around 300 kilometers and 170 kilometers at its maximum north-south dimension. Bhutan is located in the eastern Himalayas and is mostly mountainous and heavily forested. it shares 470 kilometers long border with Tibet (China’s Xizang Autonomous Region) in the north and northwest, 605 kilometers with the indian state of Sikkim in the west, West Bengal in the southwest, Assam in the south and southeast, and Arunachal Pradesh in the east.
About 70 percent of the Kingdom is covered with forests; 7 percent with year-round snow and glaciers; nearly 3 percent is cultivated or agriculture areas; and 4 percent as meadows and pastures, while rest of the land is either barren, rocky or scrubland.
Relief and Surface Features
Bhutan is one of the most rugged mountain terrains in the world. it has elevations ranging from 160 meters to more than 7,000 meters above sea level. Bhutan’s highest peak Jhomo Lhari, overlooking the Chumbi valley in the west, is 7,314 meters above sea level.
in the north, the snowcapped Great Himalayan Range reaches heights of over 7,500 meters above sea level and extends along the Bhutan-China border. he northern region consists of an arc of glaciated mountain peaks with an arctic climate at the highest elevations. Alpine valleys in this region provide pasturage for livestock tended by a sparse population practicing transhumance. he inner Himalayas are southward spurs of the Great Himalayan Range. he Black Mountains, in central Bhutan, form a watershed between two major river systems, the Mo Chhu and the Drangme Chhu. Peaks in the Black Mountains range between 1,500 meters and 2,700 meters above sea level, and the fast-lowing rivers have carved out spectacular gorges in the lower mountain areas. he woodlands of the central region provide most of Bhutan’s valuable forest production. Eastern Bhutan is divided by yet another southward spur. Western Bhutan has fertile, cultivated valleys and terraced river basins.
in the south, the Southern Hills, or Siwalik Hills, the foothills of the Himalayas, are covered with dense deciduous forest, alluvial lowland river valleys, and mountains that reach to around 1,500 meters above sea level. he foothills descend into the subtropical plain.
- Vii - StatiStical yearbook | 2016|
Climate and Vegetation
he country is divided into three distinct climatic zones: alpine, temperate and subtropical zone. Bhutan’s climate is as varied as its altitudes and, like most of Asia, it is afected by the monsoons. he climate is humid and subtropical in the southern plains and foothills, temperate in the inner Himalayan valleys of the central regions, and cold in the north, with year-round snow on the main Himalayan range.
Temperatures vary according to elevation. Most of the central portion of the country experiences a cool, temperate climate year round. in the south, a hot, humid climate helps maintain a fairly even temperature range of between 15° C and 30° C year-round, although temperatures sometimes reach beyond 35° C in the valleys during the summer.
Annual precipitation ranges widely in various parts of the country. in the severe climate of the north, there is only about forty millimeters of annual precipitation--primarily snow. in the temperate central regions, a yearly average of around 1,000 millimeters is more common, and 7,800 millimeters per year has been registered at some locations in the humid, subtropical south, ensuring the thick tropical forest. himphu experiences dry winter months (December through February) and almost no precipitation until March, when rainfall averages 20 millimeters a month and increases steadily thereater to a high of 220 millimeters in August for a total annual rainfall of nearly 650 millimeters. Bhutan’s generally dry spring starts in early March and lasts until mid-April. Summer weather commences in mid-April with occasional showers and continues through the early monsoon rains of late June. he summer monsoon lasts from late June through late September with heavy rains from the southwest. he monsoon weather, blocked from its northward progress by the Himalayas, brings heavy rains, high humidity, lash loods and landslides, and numerous misty, overcast days. Autumn, from late September or early October to late November, follows the rainy season. it is characterized by bright, sunny days and some early snowfalls at higher elevations. From late November until March, winter sets in, with frost throughout much of the country and snowfall common above elevations of 3,000 meters. he winter northeast monsoon brings gale-force winds down through high mountain passes.
Viii -StatiStical yearbook | 2016|
Drainage Patern
Fed by fresh snow each winter and slow melting in the summer, the glaciers bring millions of liters of fresh water to Bhutan and downriver areas each year. Bhutan has four major river systems: the Drangme Chhu; the Puna Tsang Chhu; the Wang Chhu; and the Amo Chhu. Each lows switly out of the Himalayas, southerly through the Duars to join the Brahmaputra River in india. he largest river system, the Drangme Chhu, lows southwesterly from india’s state of Arunachal Pradesh and has three major tributaries: the Drangme Chhu, Mangde Chhu, and Chamkhar Chhu. hese rivers form the Drangme Chhu basin. in the Duars, where eight tributaries join, the Drangme Chhu is called the Manas Chhu. he 320-kilometer-long Puna Tsang Chhu rises in northwestern Bhutan as the Mo Chhu and Pho Chhu, which are fed by the snows and glaciers from the Great Himalayan Range. hey low southerly to Punakha, where they join to form the Puna Tsang Chhu, which lows southerly into india’s state of West Bengal. he Wang Chhu, which is 370 kilometers lows southeasterly through west-central Bhutan, drains the Ha, Paro, and himphu valleys, and continues through the foothills, before it inally drains into West Bengal. he smallest river system, the Torsa Chhu, known as the Amo Chhu in its northern reaches, lows switly through western Bhutan before broadening near Phuntsholing and then lowing into india. Glaciers in northern Bhutan, which cover about 10 percent of the total surface area, are an important renewable source of water for Bhutan’s rivers.
Government
On 17th December 1907, the civil and monastic representatives unanimously crowned Ugyen
Wangchuck as the irst hereditary monarch of Bhutan. it was the strength and the farsightedness of Ugyen Wangchuck that for the irst time Bhutan was united under a central authority providing the country with stability and opportunity for development. in 1926 his son Jigme Wangchuck succeeded Ugyen Wangchuck. he third Druk Gyalpo, Jigme Dorji Wangchuck began a campaign of modernization and expansion of Bhutan’s government and society based on the accomplishments of his two predecessors in uniting the country under a strong central authority. Hence, the National Assembly consisting of representatives of the people, the Monastic order and civil administration was established in 1953.
he fourth Druk Gyalpo, Jigme Singye Wangchuk became the King in 1972. here had been steady decentralization of decision-making and institute building since then. His Majesty’s philosophy of
Gross National Happiness guided Bhutan into the 21st century. he most momentous change in
the structure of the government came in 1998 ater the devolution of the executive power by His Majesty the King to the Council of Ministers. he Fourth Druk Gyalpo initiated the drating of Bhutan’s irst Constitution in 2001 and was eventually enacted in 2008. he King abdicated the throne in favour of the crown prince in 2006.
- iX - StatiStical yearbook | 2016|
Administrative System
he administrative system in the country consists of Central Government and Local Government. he Central Government comprises of Ministries, Departments and Autonomous bodies. he Local Government comprises of Dzongkhag Tshogdu, Gewog Tshogde and the Dzongkhag hromde Tshongde.
in order to plan and review the development activities most eiciently in the Dzongkhag, the Dzongkhag Tshogdu was established in 1981. he Dzongkhag Tshogdu compromises of elected representatives of the people with its chairman elected among the Gups. Similarly, the Gewog Tshogde was established in 1991 to further decentralize the decision making process. he Gewog Tshogde comprises of Gup, Mangmi and Tshogpas. he main role of the Gewog Tshogde is to plan, prioritize and implement the developmental activities in their respective Gewogs.
he National Assembly
he National Assembly (Gyelyong Tshogdu) consists of 47 members who are elected representatives from the 47 Constituencies. he main functions of the National Assembly are to enact, amend or repeal laws and approve the national budget. he National Assembly also reviews and approves the Five Year Plans which are formulated by the government in consultation with the people of every Dzongkhag. it also deliberates on issues that afect the security and well-being of the country and promotes the welfare and happiness of the people. he National Assembly meets twice a year. However, if an important and emergency mater demands, special sessions of the National Assembly may be convened by the speaker. he duration of the National Assembly session is governed by the nature and scope of the points for discussion received from the people. A session normally lasts about three weeks. he speaker is the presiding oicer of the House and is assisted by a Deputy Speaker. he day to day administration of the National Assembly rests with the secretariat which is headed by a secretary.
he National Council
he National Council was established in 2008 under Article 11 of the Constitution of Bhutan. here are 25 members of which 20 are elected by the people from 20 Dzongkhags and the remaining 5 are nominated by His Majesty, the Druk Gyalpo. heir tenure is for ive years which commences from the date of the irst siting. he main functions of the National Council are to:
i. Ensure that the government safeguards the interest of the nation and fulills the aspirations of the people through public review of polices and issues, bills and other legislation, and scrutiny of state functions.
X -StatiStical yearbook | 2016|
he National Council meets twice a year. However, special sessions may also be convened depending upon the needs. he chairperson, who is elected from 25 members of the National Council is the Presiding Oicer of the House, and is assisted by a Deputy Chairperson. he National Council has
seven working commitees; namely the House Commitee, the Legislative Commitee, the Economic
Afairs Commitee, the Social & Cultural Afairs Commitee, the Natural Resources and Environment
Commitee, the Good Governance Commitee and the Foreign Relation Commitee. Each commitee has
a minimum of seven members headed by a Chairperson who is elected from the seven members. he National Council is assisted in the discharge of its parliamentary functions by a secretariat which is headed by a Secretary General.
he Monastic Body
he Monastic Body comprises of the Central Monastic Body and the Rabdeys (Dzongkhag Monastic Body). he Central Monastic Body receives annual subsidy from the Government to manage and run its day to day afairs. he Monastic Body is the sole arbiter on religious maters. he Je-Khenpo (Chief Abbot) is the head of the monastic body and is responsible for the nation’s religious afairs. He is chosen from among high ranking monks. Apart from being thoroughly versed in all branches of religious scholarship and practice, the candidate must also have undergone prolonged mediation. he present Je-Khenpo Trulku Jigme Chhoeda is the 70th in succession. He was appointed in 1996.
he Je-Khenpo is assisted by ive high-ranking Lopens (Masters) viz. Dorji Lopen acts as Deputy
Je-Khenpo and the Chief of all Lopens (Masters), Yangbi Lopen heads the liturgical division inclusive
of Sacred Dances, Rituals Arts, and Metrical Ryhme, Drabi Lopen heads Lexicographical division
that includes literature, grammar, lexicon, metrics and prosody, Tshenyi Lopen heads the division of
Metaphysics and Logic and Tsugla Lopen is responsible for the higher studies of the monastic Body.
- 1 - StatiStical yearbook | 2016| CHAPTER 1 POPULATION
his chapter contains statistics on the basic atributes of population such as the size and the growth of population, its geographical distribution, its structure by sex and age etc. he principle source of data on population is the population and housing census, which is conducted every ten years. he Population and Housing Census in Bhutan was irst conducted in May 2005 as per the UN standards and had been enumerated using both de facto and de jure method. he census provides a complete count of the population according to a range of characteristics such as demography, health, education and other social aspects. it is useful not only because they provide a range of current population data but also used as a benchmark for making population estimates in non-census years and for population projections.
he other aspects of population statistics relates to the demographic characteristics of the population. he most common source of information on demography is the vital registration system (which usually covers the registration of births and deaths and sometimes marriages and divorces).
he Statistics presented in this chapter are from the Population and Housing Census of Bhutan 2005. he actual resident population enumerated as of 30th and 31st May 2005 is 634,982 persons
2 -StatiStical yearbook | 2016|
he interpretations of demographic indicators are:
Crude Birth Rate: Number of live births in a year per thousand population.
General Fertility Rate: Number of live births in a year per thousand women in the childbearing age (15 to 49).
General Marital Fertility Rate: A ratio of number of births to 1000 married women in the
reproductive ages.
Total Fertility Rate: Average number of children born by women during their reproductive span of life.
Gross Reproductive Rate: Measures the extent to which a cohort of newly born girls will replace their mothers under pre-determined schedules of fertility and mortality.
Crude Death Rate: Number of deaths in a year per thousand population.
Infant Mortality Rate: Number of deaths during irst year of life per thousand live births.
Maternal Mortality Ratio: he annual number of deaths of women from pregnancy-related causes per 100,000 live births.
Rate of Natural Increase: he diference between the crude birth rate and the crude death rate.
Dependency Ratio: Measures the number of dependents as a percentage of population aged 15 to 64. Child dependency refers to children aged 0 to 14 years, while old age dependency refers to persons aged 65 and over.
- 3 - StatiStical yearbook | 2016|
Table 1.1: Projected Population by Sex, Bhutan (2010 - 2030)
Year Persons Percent
Male Female Total Male Female Total
2010 363,383 332,439 695,822 52.2 47.8 100
2011 369,476 338,789 708,265 52.2 47.8 100
2012 375,554 345,125 720,679 52.1 47.9 100
2013 381,582 351,422 733,004 52.1 47.9 100
2014 387,520 357,633 745,153 52.0 48.0 100
2015 393,324 363,718 757,042 52.0 48.0 100
2016 398,948 369,629 768,577 51.9 48.1 100
2017 404,347 375,319 779,666 51.9 48.1 100
2018 409,474 380,741 790,215 51.8 48.2 100
2019 414,293 385,861 800,154 51.8 48.2 100
2020 418,760 390,637 809,397 51.7 48.3 100
2021 423,085 395,285 818,370 51.7 48.3 100
2022 427,250 399,788 827,038 51.7 48.3 100
2023 431,247 404,132 835,379 51.6 48.4 100
2024 435,058 408,305 843,363 51.6 48.4 100
2025 438,679 412,297 850,976 51.6 48.4 100
2026 442,200 416,210 858,410 51.5 48.5 100
2027 445,626 420,036 865,662 51.5 48.5 100
2028 448,965 423,794 872,759 51.4 48.6 100
2029 452,224 427,483 879,707 51.4 48.6 100
2030 455,409 431,114 886,523 51.4 48.6 100
4 -StatiStical yearbook | 2016|
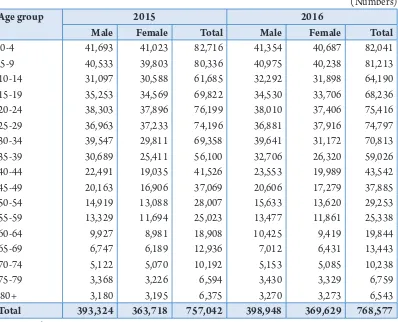
Table 1.2: Projected Population by Age Group and Sex, Bhutan (2015 - 2016)
(Numbers)
Age group 2015 2016
Male Female Total Male Female Total
0-4 41,693 41,023 82,716 41,354 40,687 82,041
5-9 40,533 39,803 80,336 40,975 40,238 81,213
10-14 31,097 30,588 61,685 32,292 31,898 64,190
15-19 35,253 34,569 69,822 34,530 33,706 68,236
20-24 38,303 37,896 76,199 38,010 37,406 75,416
25-29 36,963 37,233 74,196 36,881 37,916 74,797
30-34 39,547 29,811 69,358 39,641 31,172 70,813
35-39 30,689 25,411 56,100 32,706 26,320 59,026
40-44 22,491 19,035 41,526 23,553 19,989 43,542
45-49 20,163 16,906 37,069 20,606 17,279 37,885
50-54 14,919 13,088 28,007 15,633 13,620 29,253
55-59 13,329 11,694 25,023 13,477 11,861 25,338
60-64 9,927 8,981 18,908 10,425 9,419 19,844
65-69 6,747 6,189 12,936 7,012 6,431 13,443
70-74 5,122 5,070 10,192 5,153 5,085 10,238
75-79 3,368 3,226 6,594 3,430 3,329 6,759
80+ 3,180 3,195 6,375 3,270 3,273 6,543
Total 393,324 363,718 757,042 398,948 369,629 768,577
- 5 - StatiStical yearbook | 2016|
Table 1.3: Crude Birth Rate by Area and Dzongkhag, 2005
Dzongkhag Urban Rural Both
Bumthang 21.2 16.5 17.7
Chhukha 16.6 16.9 16.8
Dagana 18.6 24.5 23.8
Gasa 24.9 22.8 23.1
Haa 16.4 17.9 17.6
Lhuentse 13.6 21.6 20.9
Monggar 19.6 23.1 22.4
Paro 20.5 16.5 16.8
Pema Gatshel 23.9 17.3 18.3
Punakha 12.7 20.5 19.8
Samdrup Jongkhar 28.5 18.4 21.4
Samtse 21.2 19.4 19.7
Sarpang 20.9 17.2 19.5
himphu 19.1 17.2 19.8
Trashi Yangtse 21.5 24.5 24.0
Trashigang 21.5 21.8 21.3
Trongsa 19.3 24.5 21.8
Tsirang 32.4 19.4 20.6
Wangdue Phodrang 23.3 20.1 20.9
Zhemgang 14.8 21.5 20.3
Bhutan 19.6 19.8 19.7
- 6
-St
a
tiStic
al
y
earbook
| 2
0
1
6
|
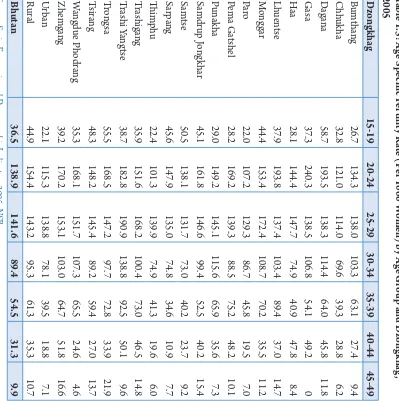
Table 1.4: General Fertility Rate (GFR), General Marital Fertility Rate (GMFR) and Total Fertility Rate (TFR) by Area and Dzongkhag, 2005
Dzongkhag GFR (per 1000 women) GMFR (per 1000 women) TFR (per women)
Urban Rural Both Urban Rural Both Urban Rural Both
Bumthang 89.9 73.0 77.5 142.9 133.9 136.6 2.6 2.4 2.5 Chhukha 58.7 81.2 69.5 95.7 118.0 107.1 1.7 2.5 2.1 Dagana 68.1 100.9 96.5 144.5 140.5 140.8 3.0 3.2 3.1 Gasa 116.3 100.3 102.3 172.4 148.7 151.6 2.7 3.1 3.1 Haa 56.2 78.6 72.8 125.4 117.6 119.1 2.5 2.5 2.5 Lhuentse 52.9 94.0 89.7 103.6 146.7 143.0 2.1 3.2 3.1 Monggar 69.5 95.5 89.9 139.6 145.0 144.0 2.5 3.1 3.0 Paro 82.9 64.2 65.6 134.2 117.3 118.7 2.2 2.1 2.1 Pema Gatshel 95.9 74.3 77.7 173.6 121.0 128.6 3.4 2.7 2.8 Punakha 39.8 84.0 78.5 127.2 139.6 138.8 1.8 2.8 2.7 Samdrup Jongkhar 112.1 77.5 88.1 150.0 112.6 124.7 2.9 2.6 2.8 Samtse 72.2 78.1 77.0 111.2 115.2 114.4 2.0 2.4 2.3 Sarpang 78.0 76.5 77.0 117.1 107.4 110.5 2.2 2.3 2.3 himphu 68.9 79.6 70.2 119.8 126.3 120.7 2.0 2.4 2.0 Trashigang 64.3 91.1 86.8 146.3 138.8 139.7 2.4 3.1 3.0 Trashi Yangtse 78.9 107.1 101.5 171.5 164.2 165.3 3.1 3.7 3.5 Trongsa 77.6 96.5 92.5 123.8 162.7 154.1 2.3 3.1 3.0 Tsirang 114.6 78.0 81.7 166.2 118.0 123.0 3.2 2.6 2.7 Wangdue Phodrang 97.2 83.4 86.7 146.3 137.2 139.6 2.9 2.8 2.8 Zhemgang 54.6 95.3 86.8 112.1 140.2 135.7 2.0 3.2 3.0
Bhutan 71.5 83.5 79.4 121.7 19.8 19.7 2.1 2.7 2.5
8 -StatiStical yearbook | 2016|
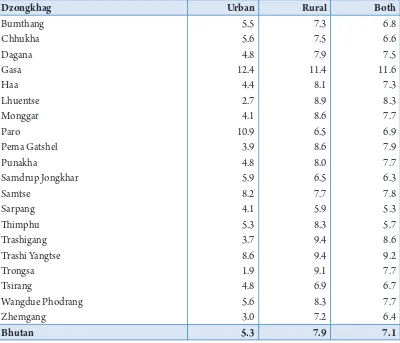
Table 1.6: Crude Death Rate (CDR) by Area and Dzongkhag, 2005
Dzongkhag Urban Rural Both
Bumthang 5.5 7.3 6.8
Chhukha 5.6 7.5 6.6
Dagana 4.8 7.9 7.5
Gasa 12.4 11.4 11.6
Haa 4.4 8.1 7.3
Lhuentse 2.7 8.9 8.3
Monggar 4.1 8.6 7.7
Paro 10.9 6.5 6.9
Pema Gatshel 3.9 8.6 7.9
Punakha 4.8 8.0 7.7
Samdrup Jongkhar 5.9 6.5 6.3
Samtse 8.2 7.7 7.8
Sarpang 4.1 5.9 5.3
himphu 5.3 8.3 5.7
Trashigang 3.7 9.4 8.6
Trashi Yangtse 8.6 9.4 9.2
Trongsa 1.9 9.1 7.7
Tsirang 4.8 6.9 6.7
Wangdue Phodrang 5.6 8.3 7.7
Zhemgang 3.0 7.2 6.4
Bhutan 5.3 7.9 7.1
- 9 - StatiStical yearbook | 2016|
Table 1.7: Natural Population Growth Rate by Area and Dzongkhag, 2005
Dzongkhag Urban Rural Both
Bumthang 1.6 0.9 1.1
Chhukha 1.1 0.9 1.0
Dagana 1.4 1.7 1.6
Gasa 1.3 1.1 1.2
Haa 1.2 1.0 1.0
Lhuentse 1.1 1.3 1.3
Monggar 1.6 1.5 1.5
Paro 1.0 1.0 1.0
Pema Gatshel 2.0 0.9 1.0
Punakha 0.8 1.3 1.2
Samdrup Jongkhar 2.3 1.2 1.5
Samtse 1.3 1.2 1.2
Sarpang 1.7 1.3 1.4
himphu 1.4 0.9 1.3
Trashigang 1.4 1.2 1.3
Trashi Yangtse 1.3 1.5 1.5
Trongsa 1.7 1.3 1.4
Tsirang 2.8 1.3 1.4
Wangdue Phodrang 1.8 1.2 1.3
Zhemgang 1.2 1.4 1.4
Bhutan 1.4 1.2 1.3
10 -StatiStical yearbook | 2016|
Table 1.8: Infant Mortality (IMR), Child Mortality Rate (CMR) and Under 5 Mortality Rate (U5MR) by Dzongkhag, 2005
Dzongkhag IMR (< 1 yr) CMR (1-4 yr) U5MR (< 5
yr)
Bumthang 28.1 10.5 38.6
Chhukha 30.4 58.5 88.9
Dagana 46.3 25.9 72.2
Gasa 0 13.9 13.9
Haa 14.6 39 53.7
Lhuentse 49.8 12.5 62.3
Monggar 50.5 20.4 70.9
Paro 21.2 6.5 27.7
Pema Gatshel 36.8 12.3 49
Punakha 28 6.5 34.5
Samdrup Jongkhar 69.1 18 87
Samtse 33.8 22.8 56.7
Sarpang 51 22.1 73.1
himphu 30.8 13.7 44.5
Trashigang 64.5 24.1 88.6
Trashi Yangtse 30.5 11.7 42.3
Trongsa 41.1 3.4 44.5
Tsirang 23.4 13 36.5
Wangdue Phodrang 53.8 18.5 72.3
Zhemgang 34.4 23.8 58.2
Bhutan 40.1 21.5 61.6
- 11 - StatiStical yearbook | 2016| CHAPTER 2 HEALTH
Guided by the national development philosophy of Gross National Happiness, the health sector envisions building “a healthy and happy nation through a dynamic professional health system with atainment of highest standard of health for the people within the broader framework of overall national development, in the spirit of social justice and equity.”
Since the early years (1960s) of the introduction of modern health care development in Bhutan (Allopathic), the health programmes and interventions have focused on the preventive aspects of health care and services including, the prevention of morbidity, the promotion of positive determinants of health, and the control of infectious disease. hese measures were further being reinforced ater being signatory to the Alma Ata declaration in 1978.
here have been a continuous eforts and remarkable strides in improving the modern health care systems and services since then. he Ministry of Health has now a wide spread network of Health Facilities covering around 95 percent of the total population within three hours walking distance of the health facility. institutional health facilities were earlier concentrated in the urban agglomerated centers, but today the emphasis has shited to the rural areas where the majority of the population live.
Health Care is delivered in a totally integrated three-tiered system with National Referral Hospital at the apex, regional referral hospitals, district hospitals, and Basic Health Units (BHUs) at the Community Level. BHUs serve remote populace and are stafed by well-trained health personnel who are equipped to treat minor ailments and advice on preventive measures to avoid the spread of communicable diseases. Extended Health Centers such as Out Reach Clinics (ORCs) and Sub-posts support these BHUs.
12 -StatiStical yearbook | 2016|
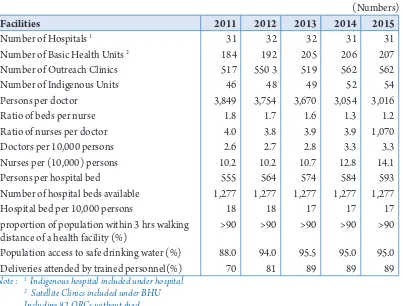
Table 2.1: Summary of Health Facilities and Personnel, Bhutan, (2011-2015)
(Numbers)
Facilities 2011 2012 2013 2014 2015
Number of Hospitals 1 31 32 32 31 31
Number of Basic Health Units 2 184 192 205 206 207
Number of Outreach Clinics 517 550 3 519 562 562
Number of indigenous Units 46 48 49 52 54
Persons per doctor 3,849 3,754 3,670 3,054 3,016
Ratio of beds per nurse 1.8 1.7 1.6 1.3 1.2
Ratio of nurses per doctor 4.0 3.8 3.9 3.9 1,070
Doctors per 10,000 persons 2.6 2.7 2.8 3.3 3.3
Nurses per (10,000) persons 10.2 10.2 10.7 12.8 14.1
Persons per hospital bed 555 564 574 584 593
Number of hospital beds available 1,277 1,277 1,277 1,277 1,277
Hospital bed per 10,000 persons 18 18 17 17 17
proportion of population within 3 hrs walking distance of a health facility (%)
>90 >90 >90 >90 >90
Population access to safe drinking water (%) 88.0 94.0 95.5 95.0 95.0
Deliveries atended by trained personnel(%) 70 81 89 89 89
Note : 1 Indigenous hospital included under hospital 2 Satellite Clinics included under BHU
Including 82 ORCs without shed
- 13 - StatiStical yearbook | 2016|
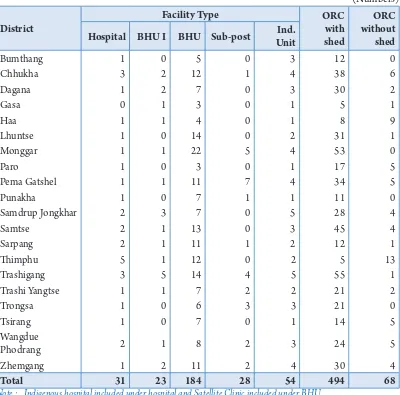
Table 2.2: Type of Health Facilities by Dzongkhag, Bhutan, 2015
(Numbers)
District
Facility Type ORC
with shed
ORC without shed
Hospital BHU I BHU Sub-post Ind.
Unit
Bumthang 1 0 5 0 3 12 0
Chhukha 3 2 12 1 4 38 6
Dagana 1 2 7 0 3 30 2
Gasa 0 1 3 0 1 5 1
Haa 1 1 4 0 1 8 9
Lhuntse 1 0 14 0 2 31 1
Monggar 1 1 22 5 4 53 0
Paro 1 0 3 0 1 17 5
Pema Gatshel 1 1 11 7 4 34 5
Punakha 1 0 7 1 1 11 0
Samdrup Jongkhar 2 3 7 0 5 28 4
Samtse 2 1 13 0 3 45 4
Sarpang 2 1 11 1 2 12 1
himphu 5 1 12 0 2 5 13
Trashigang 3 5 14 4 5 55 1
Trashi Yangtse 1 1 7 2 2 21 2
Trongsa 1 0 6 3 3 21 0
Tsirang 1 0 7 0 1 14 5
Wangdue
Phodrang 2 1 8 2 3 24 5
Zhemgang 1 2 11 2 4 30 4
Total 31 23 184 28 54 494 68
14 -StatiStical yearbook | 2016|
Table 2.3: Health Personnel by Category, Bhutan, (2011-2015)
(Numbers)
Health personnel 2011 2012 2013 2014 2015
Doctors (MBBS/Specialist) 1 181 194 203 244 251
Assistant Clinical Oicers (ACO) 41 39 38 36 35
Nurses (Assistant Nurse/GNM/B.Sc. Nurse)
723 736 799 957 1,070
Health Assistant 408 416 455 514 548
Basic Health Worker 164 162 153 118 95
Drungtshos (indigenous Physicians) 38 35 35 46 47
sMenpas (Sowa Menpas) 56 63 82 90 100
Pharmacists 11 11 9 14 15
Medical Lab. Technologists 14 27 22 20 38
Physiotherapists 6 10 10 12 12
Technicians 681 780 738 884 900
Note : 1 Includes all medical doctors registered and certiied by the Bhutan Medical and Health Council.
Source: Annual Health Bulletin 2015, MoH, himphu.
Table 2.4: Top Ten Morbidity, Bhutan, 2015
(Numbers)
Diseases 2015
Common Cold 275,951
Skin infections 92,173
Other Musculo-skeletal disorders 95,213
Other Diseases of the Digestive System 94,891
Other Disorders of Skin & Subcutaneous-tissues 90,985
Acute Pharyngitis/Tonsilitis 68,357
Peptic Ulcer Syndrome 63,955
Other Nervous including Peripheral Disorders 63,487
Diarrhoea 51,593
- 15 - StatiStical yearbook | 2016|
Table 2.5: Top Ten Inpatient Hospital Mortality, Bhutan, 2015
(Numbers)
Diseases 2015
Alcohol Liver Diseases 158
Other Circulatory Diseases 112
Other Respiratory & Nose Diseases 118
Other infections (excluding ear, brain, STi) 91
Other Diseases of the Digestive System 67
Pneumonia 63
Other Kidney, UT/ Genital Disorders 59
Other Cancers 100
Neonatal Death 17
Meningitis/Encephalitis 33
16 -StatiStical yearbook | 2016|
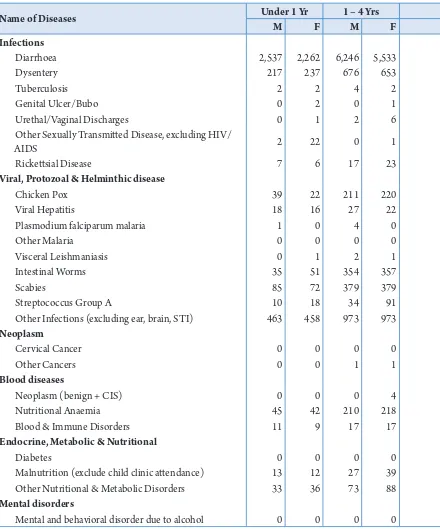
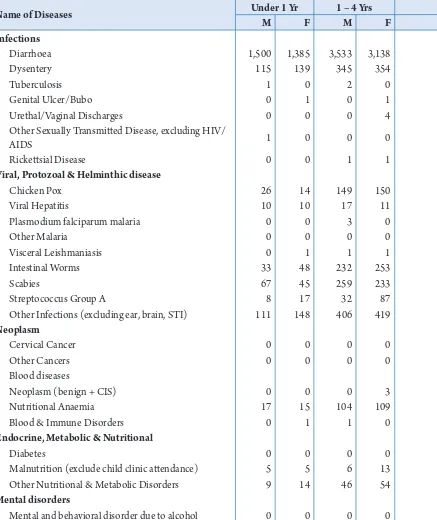
Table 2.6: Total Morbidity by sex, Bhutan, 2015
Name of Diseases Under 1 Yr 1 – 4 Yrs
M F M F
Infections
Diarrhoea 2,537 2,262 6,246 5,533
Dysentery 217 237 676 653
Tuberculosis 2 2 4 2
Genital Ulcer/Bubo 0 2 0 1
Urethal/vaginal Discharges 0 1 2 6
Other Sexually Transmited Disease, excluding Hiv/
AiDS 2 22 0 1
Ricketsial Disease 7 6 17 23
Viral, Protozoal & Helminthic disease
Chicken Pox 39 22 211 220
viral Hepatitis 18 16 27 22
Plasmodium falciparum malaria 1 0 4 0
Other Malaria 0 0 0 0
visceral Leishmaniasis 0 1 2 1
intestinal Worms 35 51 354 357
Scabies 85 72 379 379
Streptococcus Group A 10 18 34 91
Other infections (excluding ear, brain, STi) 463 458 973 973
Neoplasm
Cervical Cancer 0 0 0 0
Other Cancers 0 0 1 1
Blood diseases
Neoplasm (benign + CiS) 0 0 0 4
Nutritional Anaemia 45 42 210 218
Blood & immune Disorders 11 9 17 17
Endocrine, Metabolic & Nutritional
Diabetes 0 0 0 0
Malnutrition (exclude child clinic atendance) 13 12 27 39
Other Nutritional & Metabolic Disorders 33 36 73 88
Mental disorders
- 17 - StatiStical yearbook | 2016|
(Numbers)
5 – 14 Yrs 15 – 49 Yrs 50 - 64 Yrs 65 + Yrs
Total
M F M F M F M F
6,180 5,537 8,744 8,428 1,829 1,813 1,196 1,288 51,593
800 859 2,367 2,186 688 575 446 349 10,053
14 26 326 324 76 64 53 36 929
6 4 131 266 42 74 19 4 549
7 39 1,169 2,131 148 299 16 11 3,829
4 11 761 776 237 176 6 7 2,003
39 28 163 165 57 52 29 19 605
977 1,031 395 363 36 16 5 4 3,319
63 66 279 207 46 27 26 14 811
27 16 39 13 4 2 1 107
3 5 36 9 6 2 1 3 65
2 6 5 5 1 1 0 1 25
791 822 1,492 1,541 514 450 308 259 6,974
1,943 1,509 1,967 1,580 319 242 202 144 8,821
47 49 94 90 12 14 13 12 484
2,830 2,701 3,527 4,048 748 671 362 277 18,031
0 0 0 34 0 35 0 11 80
5 6 44 119 124 126 143 100 669
2 13 22 100 17 29 55 7 249
368 664 2,121 6,132 898 1,237 690 764 13,389
50 35 162 328 88 110 96 63 986
1 0 1,519 1,837 2,516 2,774 1,918 1,819 12,384
28 38 41 58 14 20 11 10 311
185 234 702 1,208 205 309 153 158 3,384
0 2 821 364 140 77 24 14 1,442
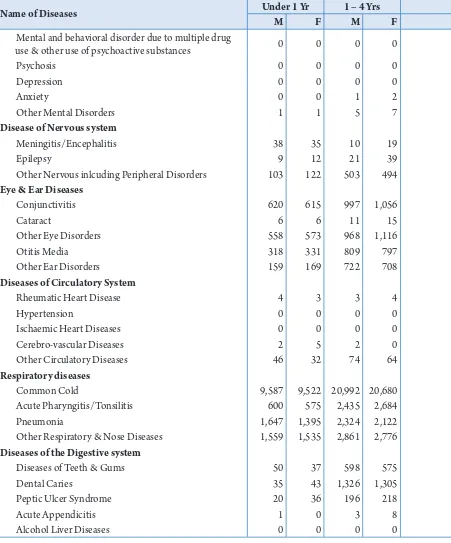
18 -StatiStical yearbook | 2016|
Name of Diseases Under 1 Yr 1 – 4 Yrs
M F M F
Mental and behavioral disorder due to multiple drug
use & other use of psychoactive substances 0 0 0 0
Psychosis 0 0 0 0
Depression 0 0 0 0
Anxiety 0 0 1 2
Other Mental Disorders 1 1 5 7
Disease of Nervous system
Meningitis/Encephalitis 38 35 10 19
Epilepsy 9 12 21 39
Other Nervous inlcuding Peripheral Disorders 103 122 503 494
Eye & Ear Diseases
Conjunctivitis 620 615 997 1,056
Cataract 6 6 11 15
Other Eye Disorders 558 573 968 1,116
Otitis Media 318 331 809 797
Other Ear Disorders 159 169 722 708
Diseases of Circulatory System
Rheumatic Heart Disease 4 3 3 4
Hypertension 0 0 0 0
ischaemic Heart Diseases 0 0 0 0
Cerebro-vascular Diseases 2 5 2 0
Other Circulatory Diseases 46 32 74 64
Respiratory diseases
Common Cold 9,587 9,522 20,992 20,680
Acute Pharyngitis/Tonsilitis 600 575 2,435 2,684
Pneumonia 1,647 1,395 2,324 2,122
Other Respiratory & Nose Diseases 1,559 1,535 2,861 2,776
Diseases of the Digestive system
Diseases of Teeth & Gums 50 37 598 575
Dental Caries 35 43 1,326 1,305
Peptic Ulcer Syndrome 20 36 196 218
Acute Appendicitis 1 0 3 8
Alcohol Liver Diseases 0 0 0 0
- 19 - StatiStical yearbook | 2016|
5 – 14 Yrs 15 – 49 Yrs 50 - 64 Yrs 65 + Yrs
Total
M F M F M F M F
0 0 186 63 9 7 1 3 269
0 1 197 240 39 31 4 14 526
4 4 188 289 66 78 18 20 667
5 9 286 471 186 222 160 182 1,524
61 95 661 1,335 135 175 33 67 2,576
25 25 63 96 10 12 9 7 349
97 123 526 564 67 52 29 20 1,559
3,598 4,235 14,183 27,141 3,976 4,990 1,947 2,195 63,487
2,766 2,641 6,641 8,243 1,866 2,063 1,124 1,261 29,893
58 65 202 253 233 252 323 318 1,742
3,378 3,918 11,413 16,105 3,824 4,606 3,109 3,338 52,906
2,104 1,913 2,603 2,869 494 386 205 180 13,009
2,131 2,157 3,832 4,224 867 850 576 486 16,881
11 18 216 291 233 231 173 174 1,361
32 59 5,495 7,837 5,342 6,231 4,775 4,875 34,646
1 0 93 107 132 139 148 148 768
5 9 79 77 90 71 164 123 627
357 394 1,167 1,877 561 585 641 591 6,389
32,675 34,446 52,251 62,011 10,854 11,232 6,183 5,518 275,951
8,305 9,196 16,239 20,595 2,788 2,776 1,180 984 68,357
649 555 490 516 192 213 231 191 10,525
4,763 5,082 11,265 13,826 3,142 3,402 2,587 2,444 55,242
2,226 2,416 5,561 6,620 1,528 1,305 868 673 22,457
6,223 6,601 12,493 16,765 3,729 3,446 1,787 1,283 55,036
1,881 2,679 17,941 24,303 4,975 6,044 2,790 2,872 63,955
51 30 327 295 62 67 30 29 903
0 0 1,077 648 575 391 301 142 3,134
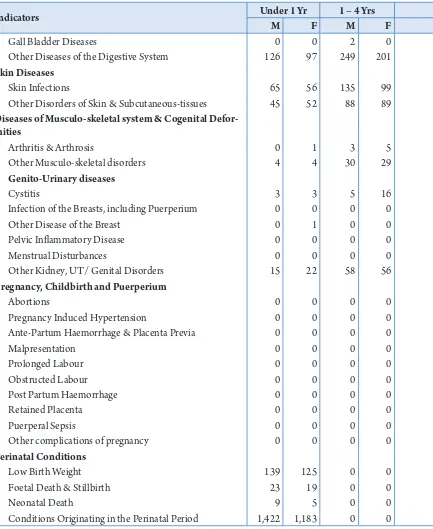
20 -StatiStical yearbook | 2016|
Name of Diseases Under 1 Yr 1 – 4 Yrs
M F M F
Gall Bladder Diseases 6 8 16 9
Other Diseases of the Digestive System 977 965 3,412 3,450
Skin Diseases
Skin infections 1,938 1,954 6,180 6,058
Other Disorders of Skin & Subcutaneous-tissues 1,832 1,893 4,931 4,955
Diseases of Musculo-skeletal system & Cogenital Defor-mities
Arthritis & Arthrosis 1 2 23 33
Other Musculo-skeletal disorders 42 40 422 469
Genito-Urinary diseases
Cystitis 6 7 39 54
infection of Breasts, including Puerperium 0 0 0 0
Other Disease of the Breast 0 1 0 8
Pelvic inlammatory Disease 0 0 0 0
Menstrual Disturbances 0 0 0 0
Other Kidney, UT/ Genital Disorders 70 79 459 520
Pregnancy, Childbirth and Puerperium
Abortions 0 0 0 0
Pregnancy induced Hypertension 0 0 0 0
Ante-Partum Haemorrhage & Placenta Previa 0 0 0 0
Malpresentation 0 0 0 0
Prolonged Labour 0 0 0 0
Obstructed Labour 0 0 0 0
Post Partum Haemorrhage 0 0 0 0
Retained Placenta 0 0 0 0
Puerperal Sepsis 0 0 0 0
Other complications of pregnancy 0 0 0 0
Perinatal Conditions
Low Birth Weight 147 139 0 0
Foetal Death & Stillbirth 23 20 0 0
Neonatal Death 11 6 0 0
Conditions Orginating in the Perinatal Period 1,530 1,298 0 0
- 21 - StatiStical yearbook | 2016|
5 – 14 Yrs 15 – 49 Yrs 50 - 64 Yrs 65 + Yrs
Total
M F M F M F M F
59 80 295 660 133 225 71 88 1,650
8,235 9,213 22,169 29,210 5,297 5,559 3,234 3,170 94,891
13,730 11,521 21,432 18,688 4,020 3,206 2,077 1,369 92,173
11,060 10,665 21,561 22,064 4,282 3,849 2,183 1,710 90,985
259 220 2,569 3,063 1,495 1,477 1,008 931 11,081
3,325 2,968 28,059 30,229 9,677 9,585 5,596 4,801 95,213
62 103 668 2,053 174 286 93 131 3,676
0 7 0 450 0 17 0 3 477
2 65 21 1,415 3 93 2 31 1,641
0 7 0 687 0 56 0 8 758
0 146 0 4,146 0 513 0 29 4,834
1,126 1,382 6,253 21,652 1,513 2,573 1,138 1,064 37,829
0 2 0 1,564 0 0 0 0 1,566
0 1 0 565 0 0 0 0 566
0 0 0 116 0 0 0 0 116
0 0 0 79 0 0 0 0 79
0 1 0 256 0 0 0 0 257
0 0 0 76 0 0 0 0 76
0 1 0 101 0 0 0 0 102
0 1 0 140 0 0 0 0 141
0 0 0 53 0 0 0 0 53
0 23 0 11,289 0 0 0 0 11,312
0 0 0 0 0 0 0 0 286
0 0 0 0 0 0 0 0 43
0 0 0 0 0 0 0 0 17
0 0 0 0 0 0 0 0 2,828
22 -StatiStical yearbook | 2016|
Name of Diseases Under 1 Yr 1 – 4 Yrs
M F M F
Malformations
Malformations 90 88 27 30
Injuries & Trauma
Mushroom Poisoning (Toxic efect of other unspeciied
susbstances) 2 3 23 29
Transport Accidents 1 3 36 29
Accidental Falls 26 23 369 292
Other Bites & Stings 20 27 268 223
Dog Bite 11 10 351 280
Drowning & Submersion 0 0 2 3
Exposure to Electric Current 0 0 5 2
Contact with Heat & Hot substances & exposure to
smoke, ire, lames 45 42 313 273
Snake Bite 1 0 5 0
Contact with venomous animals (excluding Snake bite) 0 1 12 6
intentional Self Harm 0 3 12 10
Work Related injuries 15 11 322 259
Others (injuries other than above & unknown cause of
injury) 104 66 895 632
Other Conditions
Complications of Health Care 24 28 58 60
ANC, immunisation & Other counseling 2,921 3,325 4,276 4,316
Total 28,724 28,358 66,574 65,318
- 23 - StatiStical yearbook | 2016|
5 – 14 Yrs 15 – 49 Yrs 50 - 64 Yrs 65 + Yrs
Total
M F M F M F M F
34 28 30 27 3 2 1 1 361
36 30 106 99 15 9 6 4 362
130 91 1,194 507 194 93 64 41 2,383
1,475 712 2,567 1,418 586 464 324 252 8,508
590 445 1,059 1,052 239 199 110 71 4,303
1,308 794 1,896 1,452 405 273 200 119 7,099
20 7 17 6 9 6 1 3 74
7 5 32 9 3 1 1 0 65
342 275 576 523 106 83 40 39 2,657
19 8 88 60 21 13 7 7 229
22 13 56 30 17 3 3 6 169
70 41 295 225 43 28 17 6 750
3,294 1,688 13,724 5,912 2,641 1,409 1,025 505 30,805
3,835 1,856 7,395 4,474 1,361 770 539 338 22,265
80 84 276 446 76 38 21 26 1,217
2,189 2,420 22,653 22,606 1,268 1,141 773 601 68,489
24 -StatiStical yearbook | 2016|
Table 2.7: Inpatient Cases in all Hospitals, Bhutan, 2015
Indicators Under 1 Yr 1 – 4 Yrs
M F M F
Infections
Diarrhoea 191 134 329 281
Dysentery 16 9 26 22
Tuberculosis 0 1 2 1
Genital Ulcer/Bubo 0 1 0 0
Urethal/vaginal Discharges 0 1 0 0
Other Sexually Transmited Disease, excluding Hiv/
AiDS 1 1 0 0
Ricketsial Disease 7 6 16 22
Viral, Protozoal & Helminthic disease
Chicken Pox 4 0 5 5
viral Hepatitis 7 5 9 9
Plasmodium falciparum malaria 1 0 1 0
Other Malaria 0 0 0 0
visceral Leishmaniasis (Kala-azar) 0 0 1 0
intestinal Worms 0 0 2 2
Scabies 5 7 8 3
Streptococcus Group A 1 0 2
Other infections (excluding ear, brain, STi) 213 177 134 144
Neoplasm
Cervical Cancer 0 0 0 0
Other Cancers 0 0 1 1
Blood diseases
Neoplasm (benign + CiS) 0 0 0 1
Nutritional Anaemia 16 10 43 19
Blood & immune Disorders 11 7 5 7
Endocrine, Metabolic & Nutritional
Diabetes 0 0 0 0
Malnutrition (exclude child clinic atendance) 8 5 6 10
Other Nutritional & Metabolic Disorders 19 18 7 13
Mental disorders
- 25 - StatiStical yearbook | 2016|
(Numbers)
5 – 14 Yrs 15 – 49 Yrs 50 - 64 Yrs 65 + Yrs
Total Death
M F M F M F M F
131 121 293 323 80 85 72 94 2,134 2
11 14 51 33 12 3 9 9 215 0
9 18 252 261 37 38 37 21 677 29
3 0 0 1 1 1 2 0 9 0
0 0 10 8 0 2 1 0 22 0
2 0 13 9 3 0 0 0 29 0
32 25 100 97 31 38 19 14 407 4
18 14 12 6 2 0 0 0 66 4
21 29 63 57 9 7 13 4 233 0
3 3 20 5 4 1 1 0 39 2
0 1 18 1 4 0 0 0 24 1
1 1 2 1 0 0 0 1 7 0
2 3 2 16 5 5 1 0 38 0
14 10 3 8 1 1 1 0 61 0
2 2 4 3 0 1 0 0 15 0
161 145 445 518 103 110 97 72 2,319 89
0 0 0 31 0 33 0 8 72 6
5 6 44 119 124 125 143 100 668 100
2 9 16 92 17 28 55 7 227 1
15 25 122 269 63 63 64 67 776 7
17 17 36 87 14 28 14 14 257 10
0 0 119 116 154 150 152 101 792 28
0 4 1 3 0 0 1 1 39 0
9 11 48 86 15 32 13 10 281 11
0 2 490 195 80 32 13 6 818 2