CLASSIFICATION OF HYPERSPECTRAL DATA BASED ON GUIDED FILTERING
AND RANDOM FOREST
Haiyi Ma a, Wanwan Feng a, Xiaowang Cao a, Leiguang Wang a
a
School of Forestry, Southwest Forestry University, Kunming, China, 650224
KEY WORDS: Classification, Hyperspectral image, Guided Image Filter, Random Forest (RF)
ABSTRACT:
Hyperspectral images usually consist of more than one hundred spectral bands, which have potentials to provide rich spatial and spectral information. However, the application of hyperspectral data is still challengeable due to “the curse of dimensionality”. In this context, many techniques, which aim to make full use of both the spatial and spectral information, are investigated. In order to preserve the geometrical information, meanwhile, with less spectral bands, we propose a novel method, which combines principal components analysis (PCA), guided image filtering and the random forest classifier (RF). In detail, PCA is firstly employed to reduce the dimension of spectral bands. Secondly, the guided image filtering technique is introduced to smooth land object, meanwhile preserving the edge of objects. Finally, the features are fed into RF classifier. To illustrate the effectiveness of the method, we carry out experiments over the popular Indian Pines data set, which is collected by Airborne Visible/Infrared Imaging Spectrometer (AVIRIS) sensor. By comparing the proposed method with the method of only using PCA or guided image filter, we find that effect of the proposed method is better.
1. INTRODUCTION
Hyperspectral imagery, as a major breakthrough in the field of remote sensing, is attracting more and more attention. The hyperspectral imagery has extremely high spectral resolution and also often has high spatial resolution, which can be used for the physicochemical characteristics mining or recognition of different ground objects 1 . However, classification of hyperspectral data is still a challenging problem due to the curse of dimensionality (Hughes phenomenon) (Hughes, 1986).
In order to solve this problem, principal component analysis (PCA) is considered as an effective method. It can not only reduce the dimension of data, but also extract spectral features. Only those principal components contain most of information are utilized, while the remaining components are discarded. In spite of the benefits, it also suffers from an inefficient exploration of spatial information.
Recently, guided filter has been successfully applied in image matting ( Levin, 2006), image super-resolution (Zomet, 2002), and haze removal (He, 2009). The guided filter can perform edge-preserving smoothing like the popular bilateral filter (Tomasi, 1998), but has better behaviour near the edges when input images and guidance images are the same image. So it can extract spatial information from hyperspectral data effectively.
Random Forest (RF) is a classifier containing multiple decision trees. The final classification results are decided by a majority vote rule, it offers two main advantages, i.e. very low computational complexity and having few parameters to tune (Breiman, 2001, Chan, 2008). Hence it is one of the most widely used pixel-wise classifier for hyperspectral data.
1
This project is supported by national Natural Science Foundation of China under grants of 41571372 and 41301470. Corresponding author: Leiguang Wang; [email protected]
In this context, the guided filter is proposed to extract spatial information from the PCs (principal components), and the extracted spatial features together with PCs, are fed into the RF classifier. The following parts are organized as follows: The second part introduces correlative theories and the proposed method. The third part reports the experimental results and analysis. The conclusion is drawn in the fourth part.
2. INTEGRATION OF PCA AND GUIDED FILTERING FOR CLASSIFICATION
The flowchart of the presented classification method is shown in Fig. 1. As can be seen, PCA firstly extracts discriminant features. Secondly, the guided filter provides complementary spatial information. Thirdly, RF is applied for classification. The detailed description on the whole process will be presented in the following sections.
2.1 Principal Component Analysis
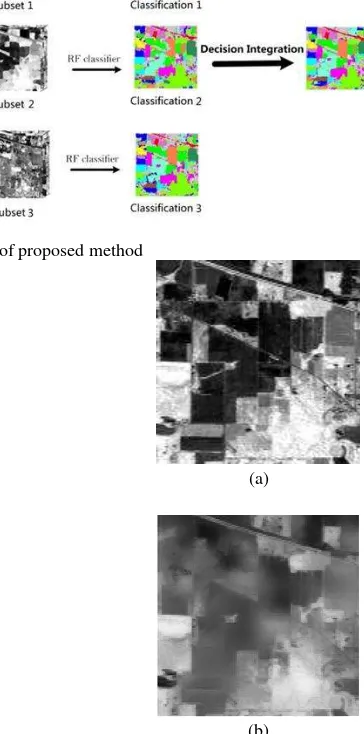
The original hyperspectral image consists of bands with consecutive spectral responses, which contains reductant information. PCA tries to replace the original bands related to each other by a new set of independent bands, which can benefit for dimension-reduction and extraction of spectral features. Fig. 2 (a) shows the first PC.
The International Archives of the Photogrammetry, Remote Sensing and Spatial Information Sciences, Volume XLII-2/W7, 2017 ISPRS Geospatial Week 2017, 18–22 September 2017, Wuhan, China
This contribution has been peer-reviewed.
Fig. 1 Flowchart of proposed method
2.2 Guided Image Filtering
Guided image filter (Kaiming, 2010) is a kind of explicit image filter based on the edge-preserving algorithm. It is derived from a local liner model. The algorithm assumes that output image is a linear transform of guidance image I in a window centred at the pixel k:
(1)
Where, , are some linear coefficients assumed to be constant in .
To determine the linear coefficients, we seek a solution to (1) that minimizes the difference between q and the filter input p
∑ (2)
Where, is a regularization parameter.
The solution to (2) can be given by linear regression (Draper, 1981):
| |∑ ̅
(3)
̅ (4)
Where, and are the mean and variance of I in ,| | is the number of pixels in , and ̅ is the mean of p in .
We use the guided filter to remove details and preserve edges of objects. In detail, the guided filter uses guided imagery to achieve the purpose of filtering the PCs. The guided filter can powerfully remove details and remain edges of objects. In this step, we conduct guided filtering on the three bands obtained in the previous step respectively. Input images and guidance images are the same principle components. Thus, in regions where pixels change softly the filter plays a smooth role in the image, meanwhile it can also keep the edges of the objects in the regions where pixels change sharply, resulting in distinguishing features of RF classifier. It is beneficial for the classification in the next step. By experiment, two parameters of guided filter are determined, where the radius r and regularization parameter ε are set as 25 and 0.1 respectively. Fig. 2 (b) is the filtered result of the first PC.
(a)
(b)
Fig. 2 (a) The first PC. (b)The filtered result of the first PC.
2.3 Random Forest
RF classifier is one of the most widely used pixel-wise classifier for hyperspectral data, which is insensitive to the dimensionality of data and can provide good performance in terms of classification accuracy (Junshi, 2016). A RF classifier consists of a lot of CARTs (Classification And Regression Tree). The training data is firstly obtained by sampling with replacement. Then, the data is put into each CART to train the CARTs. New data can be predicted by every CART and the final map is synthesized by majority voting over the results of all decision trees. In this paper, the number of trees is set to be 500 and available feature quantity of every node of a decision tree is set to be .
3. EXPERIMENTAL RESULTS AND ANALYSIS
In this experiment, the Indian Pines data set, including 16 classes, gathered by AVIRIS sensor over the Indian Pines test site in North-western Indiana, was employed. The data set consists of 145×145 pixels and 220 spectral reflectance bands in the wavelength range from 0.4×10⁻⁶ to 2.5×10⁻⁶ meters. Fig. 3 shows the colour composite of the Indian Pines image. The
The International Archives of the Photogrammetry, Remote Sensing and Spatial Information Sciences, Volume XLII-2/W7, 2017 ISPRS Geospatial Week 2017, 18–22 September 2017, Wuhan, China
This contribution has been peer-reviewed.
numbers of testing samples are shown in the Table 1. As for training samples, when the number of test samples of some class is more than 500, we randomly select 500 samples per class. Otherwise, a half of samples is utilized for training. In the following section, we will compare the experimental classification results with different feature settings and take advantage of Kappa coefficient and OA (Overall Accuracy) as evaluation index to estimate the effect of classification.
Original hyperspectral data comprises 220 spectral bands and a strong correlation among them is existed. So the aim of PCA is to reduce dimension and eliminate the effect of correlativity among bands. At the same time, most of the information in raw data can be retained. Here, we only keep the first three principal components, which can make up 93.51% of all the information (the proportion of the former three principal components are 68.49%, 23.53%, 1.49%).
(a)
(b)
(c)
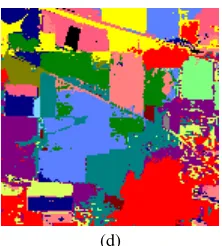
(d)
Fig. 3. (a) Three-band colour composite of the Indian Pines image. (b) The result map of NO. 1. (c) The result map of NO. 2. (d) The result map of NO. 3.
Class Testing Samples
NO.1 (%) NO.2 (%) NO.3 (%)
Alfalfa 46 89.13 100 100
Corn-no till 1428 36.48 87.04 88.31
Corn-min till 830 65.42 99.03 97.35
Corn 237 89.87 99.58 99.16
Grass-pasture 483 77.23 98.55 97.72
Grass-trees 730 86.58 98.90 99.32
Grass- pasture-mowed
28 96.43 96.43 96.43
Hay-windrowed 478 91.63 100 99.16
Oats 20 65.00 95.00 100
Soybean-no
till 972 74.90 94.03 92.49
Soybean-min
till 2455 56.54 93.89 91.85
Soybean-clean 593 59.36 97.80 96.12
Wheat 205 98.05 100 100
Woods 1265 74.38 97.94 98.10
Buildings- Grass-Trees-Drives
386 62.69 99.74 99.48
Stone-Steel-Towers 93 97.84 98.92 100
OA - 65.80% 95.51 94.79
Kappa - 0.6401 0.9496 0.9416
Time(s) - 1.86 31.46 1.67
Table 1. Classification accuracy of different classes
NO. 1: Merely spectral features are utilized to classify. Only the first three principal components, which can make up 93.51% of all the information (the proportion of the former three principal components are 68.49%, 23.53%, 1.49%) are used for RF classifier. The result map is Fig. 3 (b).
NO. 2: We simply utilize spatial features to classify. Each of 220 bands of image is input image as well as guided image. More specifically, each single band image exerts guided filter on itself. Two important parameters of guided filter are radius r=25 and regularization parameter ε=0.1, respectively. The result map is Fig. 3 (c).
NO. 3: The method of combining spectral features and spatial features is used to classify. Principal components of selection are the same as the first experiment. Parameters of the second
The International Archives of the Photogrammetry, Remote Sensing and Spatial Information Sciences, Volume XLII-2/W7, 2017 ISPRS Geospatial Week 2017, 18–22 September 2017, Wuhan, China
This contribution has been peer-reviewed.
experiment are also exploited in this experiment. The result map is Fig. 3 (d).
From the Table 1, we can conclude that classification accuracy of NO. 3 and NO. 2 is about the same, but NO. 3 takes less time. The precision of NO. 1 far lower than that of the latter two. Although the precision improves with the number of selected principal components increases, time cost raises, too. PCA might lead to a loss of useful information in the discarded components, so the classification accuracy of NO. 1 is low. However, the method that the spectral features extracted are combined with spatial information by guided image filtering can remarkably improve precision. That’s because guided image filtering can minish intraclass variations and keep interclass variations. We can see that tiny patch in (d) is much less than that in (a). PCA only uses the spectral information from 3 bands to express most of the original information of the 220 bands. Therefore, compared with NO. 2, the time NO. 3 spends is greatly reduced.
4. CONCLUSION
This paper proposes a novel hyperspectral images classification method that exploiting RF to classify with ensemble of PCA and guided image filtering. The target of this method is making the best of spatial information and spectral features to improve accuracy and efficiency of hyperspectral images classification. Table in the paper has shown that the proposed method produces high classification accuracy with OA of 94.79% and kappa coefficient of 0.9416. More importantly, this approach only takes 1.86 seconds. The use of PCA avoids “the curse of dimensionality”, while the application of guided image filtering is the significant reason for high classification accuracy. Experimental results indicate that the proposed method performs better and is more efficient than the mean of only with spectral features or spatial characteristics in remote sensing image classification.
REFERENCES
Breiman, L., 2001. Random forests. Mach. Learn, 45(1), pp. 5– 32.
Chan, J. C.W., Paelinckx, D., 2008. Evaluation of Random Forest and AdaBoost tree-based ensemble classification and spectral band selection for ecotope mapping using airborne hyperspectral imagery. Remote Sens. Environ, 112(6), pp. 2999–3011.
Draper, N., Smith, H., 1981. Applied Regression Analysis. 2 edn. John Wiley.
He, K., Sun, J., Tang, X., 2009. Single image haze removal using dark channel prior. CVPR.
Hughes, G., 1968. On the mean accuracy of statistical pattern recognizers. IEEE Trans. Inform. Theory, 14(1), pp. 55–63.
Junshi Xia, Lionel Bombrun, Tülay Adali, Yannick Berthoumieu, Christian Germain, 2016. Classification of hyperspectral data with ensemble of subspace ICA and edge-preserving filtering. ICASSP.
Kaiming He, Jian Sun, and Xiaoou Tang, 2010. Guided Image Filtering. European Conference on Computer Vision, 35(6), pp. 1–14.
Levin, A., Lischinski, D., Weiss, Y., 2006. A closed form solution to natural image matting. CVPR.
Tomasi, C., Manduchi, R., 1998. Bilateral filtering for gray and color images. ICCV.
Zomet, A., Peleg, S., 2002. Multi-sensor super resolution. IEEE Workshop on Applications of Computer Vision.
The International Archives of the Photogrammetry, Remote Sensing and Spatial Information Sciences, Volume XLII-2/W7, 2017 ISPRS Geospatial Week 2017, 18–22 September 2017, Wuhan, China
This contribution has been peer-reviewed.