A GROUND-BASED LIDAR AND IMAGING SPECTROMETER SYNCHRONOUS
EXPERIMENT ON VEGETATION
Tao Hong a, Xin Luo a, Hongyan Chen a, Jinxi Hui a
a School of Resources and Environment, University of Electronic Science and Technology of China,
Chengdu, 611731 Sichuan, China
KEY WORDS: LiDAR, Imaging Spectrometer, Ground-Based Observation, Vegetation Canopy Structure, Point Cloud Data
ABSTRACT:
Extraction of vegetation canopy structure parameters is of great significance for researching global ecosystem and environment. Focused on the effective synergy between active and passive sensors, we carried out some ground-based observations about different vegetation on different terrains. In different experimental sites, a light detection and ranging (LiDAR) data and an imaging spectrum data of typical vegetation were collected from different directions and angles. Meanwhile, a variety of canopy structure parameters, including plant height, crown breadth, leaf area index, etc, were measured. The whole observed results form a comprehensive ground synchronous data set corresponding to flight data and provide data support for development and validation of synergic retrieval methods of vegetation canopy structure parameters. Our specific experimental objectives and design are introduced, including the selection of sampling plots, arrangement of observation stations, acquisition of active and passive data, and measurement of auxiliary data. The processing and practical applications of those obtained synchronous data are also discussed. Finally, our experimental experience is summarized and it is a valuable reference for remote sensing researchers.
Corresponding author, email: [email protected]
1. INTRODUCTION
Vegetation, affecting the energy balance, climate, water and biogeochemical cycle on the earth, is a sensitive indicator of the environmental impacts as a result of climate changes and man's activities. Canopy structure parameters can be used to study structures and functions of vegetation ecosystems, and can offer quantitative structural information for describing energy exchanges of vegetation canopies, such as photosynthetic process, respiration, transpiration and growth. Therefore, extraction of canopy structure parameters is significant for the study of ecosystems (Korhonen,2011).
Ground-based observations are relatively convenient and low-cost. If conditions permit, ground-based observations can be performed anywhere at any time, according to needs of research (Puttonena,2010). Through multi-temporal static ground observations, we can obtain vegetation canopy information on different temporal and spatial scales, so as to enhance the efficiency of information extraction and realize more precise retrievals of vegetation parameters than through airborne or spaceborne observations. In addition, we can continuously expand the spatio-temporal information of the vegetation in research areas. Consequently, we can analyze the multi-source dynamic information, verify remote sensing modeling theories of vegetation, and develop new remote sensors.
Although airborne LiDAR and imaging spectrum synchronous data have been utilized in a few research of vegetation canopy structure parameter extraction (Latifi,2012; Dalponte,2012; Laurin,2014), the usages of ground active and passive synchronous data were reported rarely. The lack of data is a bottleneck of the development of ground retrieval methods. From the Heihe integrated remote sensing experiment, we acquired some multi-sensor data of ground vegetation, but there is no LiDAR and imaging spectrum ground synchronous data
that is of important significance for vegetation canopy structure research(Li,2013). Aiming at this problem, we carried out a ground-based observation experiment and obtained some valuable LiDAR and imaging spectrum synchronous data of vegetation. The scientific objectives of our ground-based experiment are introduced in the first part of this article. In the second part, overall experimental design is described. The preliminary results of the experiment are presented at last.
2. SCIENTIFIC OBJECTIVES OF GROUND-BASED OBSERVATIONS
Since imaging spectrum remote sensing can provide rather precise spectral information about objects on the ground, it has great advantages in identification of vegetation species and retrieval of vegetation biochemical components(Omari,2008; Jacquemoud,2009; Darvishzadeh,2011). However, using a single type of passive optical remote sensing data to extract vegetation canopy structure parameters still has its own technical limitations(Schlerf,2006). For instance, most of retrievals are based on statistical methods, and those retrievals based on physical models cannot reach satisfying accuracies yet(Bunting,2006). Some methods based on active optical remote sensing data, have been presented for extracting vegetation canopy structure parameters in recent years. More precise position, height and canopy information of vegetation have been extracted through directly measuring geometric structures of vegetation by LiDAR(Zhao,2009;Wang,2008). Hence, it has become possible to enhance accuracies of vegetation structure parameter retrievals through synergy of active and passive remote sensing.
During a flight remote sensing experiment, our ground-based observations were performed with the purpose of collecting ground data outdoors. Several sampling plots in the flight area ISPRS Annals of the Photogrammetry, Remote Sensing and Spatial Information Sciences, Volume IV-2/W4, 2017
were selected, where an LiDAR and an imaging spectrometer were installed to acquire laser point cloud data and imaging spectrum data simultaneously from different angles and different directions. These synchronous data can provide supports to retrievals of vegetation structure parameters. The specific goals of our experiment are expressed as follows: a. We can explore new approaches to retrieve structure parameters of individual or population vegetation from ground synchronous data and offer high-quality validation data to airborne or spaceborne remote sensing.
b. Meanwhile, from ground synchronous data we can extract three-dimensional structures of vegetation canopies in more detail and realize vivid simulations of different scenes (Teobaldelli,2008).
c. Moreover, we can verify remote sensing parameterized models and retrieval methods for complex surfaces.
3. SCHEMES FOR OBTAINING GROUND DATA
According to the time some satellites overpass and the flight time of the aircraft, we determined a schedule to perform the synchronous experiment on the ground. For studying continuous variations of vegetation parameters in horizontal space, a primary sampling strip was marked out close to the central region in the key experimental area. The sampling strip was laid out because of feasibility of ground survey, representativeness of species and terrain, and so on. Thus, our sampling plots in the sampling strip satisfied the following conditions:
a. Every sampling plot occupied a certain area, which was usually corresponding to the spatial resolution of available satellite remote sensing images.
b. Sampling plots were of different sizes involving different vegetation species and growth stages.
c. Sampling plots could allow us to obtain vegetation information from of different types of terrain, so that we could study the effect of terrain on vegetation structure parameter retrievals.
d. Sampling plots could allow us to observe vegetation in different distribution densities, so that we could get observation data of different populations.
A series of instruments used in our experiment included: a portable LiDAR, a portable imaging spectrometer, a field spectrometer, a high precision RTK (Real Time Kinematic), an electronic total station, a plant canopy analyzer, a portable GPS, a laser altimeter, a tape ruler, a compass, etc. Here, taking the registration problem of ground and aerial data into consideration, we used the WGS84 coordinate values of observation stations recorded by the RTK to transform the local coordinate values of ground data. The size of each sampling plot was determined by the tape ruler; the local precise coordinate values of observation stations were given by the electronic total station; and leaf area index (LAI) and other basic auxiliary parameters related to sampling plots were measured by the plant canopy analyzer. The primary sensors used in our experiment are listed in Table 1.
3.1 The Design of Experimental Sampling Plots
As mentioned above, our sampling plots involved main types of surface, including sunny and shady slopes except shaded areas. Moreover, we also had attempted to get the corresponding spaceborne images of them. The objects we observed included forest, farmland and so on.
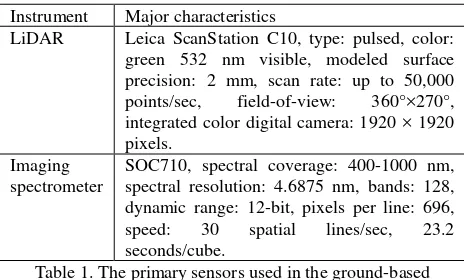
Instrument Major characteristics
LiDAR Leica ScanStation C10, type: pulsed, color: green 532 nm visible, modeled surface precision: 2 mm, scan rate: up to 50,000 points/sec, field-of-view: 360°×270°, integrated color digital camera: 1920 × 1920 pixels.
Imaging spectrometer
SOC710, spectral coverage: 400-1000 nm, spectral resolution: 4.6875 nm, bands: 128, dynamic range: 12-bit, pixels per line: 696, speed: 30 spatial lines/sec, 23.2 seconds/cube.
Table 1. The primary sensors used in the ground-based experiment
Farmland. We chose several pieces of farmland covered with a certain single type of grown-well crop separately, such as barley, wheat, tea, and so on. Generally, each of them was about 50 m × 50 m in size.
Forest. With intent to avoid mixture of vegetation species, we determined some forest sampling plots covered with different single species and no destruction, such as coniferous, broadleaf forest, and so on. The size of each plot was up to 15 m × 15 m usually. In addition, we also chose some regions covered with sparse vegetation in order to observe individual vegetation. By means of field survey, we designed two kinds of sampling plots based on actual terrain, vegetation species, growth status, and other environmental factors. One kind of sampling plot was so large as to represent different types of forest stands. Each of them was roughly 45 m × 45 m in size, where we obtained laser point cloud data on large scene scales by using a portable LiDAR so as to offer input parameters to multi-pattern synergy retrieval models. The other kind of sampling plot was comparative small so that we could make more detailed measurements for modeling and simulations, i.e. three-dimensional reconstructions of typical species and forest stand scenes. In addition, the design of sampling plots allowed us to research not only terrain effects on vegetation structure parameter retrievals, but also directional reflectance properties of vegetation.
3.2 The Method of Acquiring LiDAR Data
Considering the range and actual observation situation of every sampling plot, we selected some predominant observation stations for setting the LiDAR there, so that any two adjacent stations were visible to each other. Meanwhile, for the subsequent accurate registration and mosaic of multi-station point cloud data later, we selected an unique observation station for setting the electronic total station in every sampling plot, which was visible to all the other.
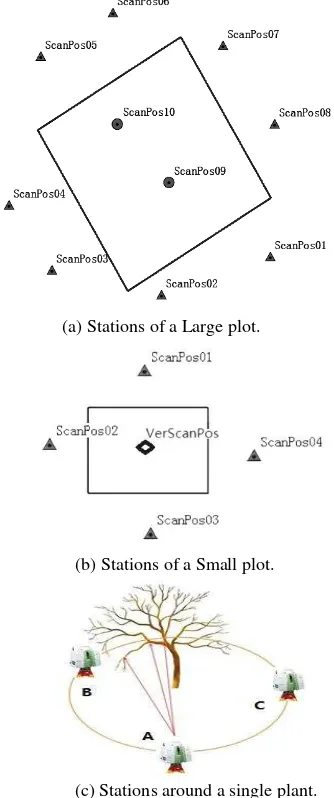
Figure 1.(a) illustrates ten chosen observation stations in a Large sampling plot, named from ScanPos01 to ScanPos10. In each sampling plot, after direction determination by the compass and rough measurement by the tape ruler, we used the total station for accurate location of observation stations in an independent coordinate system. Finally, by using the LiDAR, we scanned every vegetation scene sequentially in the manner of "Known backsight". The scan resolution was set in the "High" mode, which means that the distance between any two laser points at 100 m is 0.05 m. At all stations outside a sampling plot, the horizontal scan range was determined that the overlap field of view between any two adjacent stations was as small as possible, and the vertical scan range was from 0° to 270°. At all stations inside a sampling plot, the horizontal and vertical scan ranges were from 0° to 360° and from 0° to 270° ISPRS Annals of the Photogrammetry, Remote Sensing and Spatial Information Sciences, Volume IV-2/W4, 2017
respectively. At the above settings, every station had to be scanned for about 20 minutes.
Taking the data mosaic problem of Small plots into account, we selected four predominant observation stations from different directions outside each Small sampling plot and ensured that there was a certain distance between every station and the Small sampling plot. As depicted in Figure 1.(b), the four observation stations are named from ScanPos01 to ScanPos04. The scan resolution was set in the "Highest" mode, which means that the distance between any two laser points at 100 m is 0.02 m. The horizontal scan range was carefully determined to ensure that there was some overlap field of view between any two adjacent stations, and the vertical range was from 0° to 270°. At the above setting, every station had to be scanned for about one hour.
After data acquisition of each observation station, it was critical to check the quality of acquired data. We needed to make sure that the data contained the laser point cloud of desired objects exactly. Otherwise, we had to adjust the horizontal scan range and scan again. Figure 2.(a) is a scene of scanning tea plants on a slope by using the LiDAR.
As for the observation of a single plant, three stations were chosen on a circle around the plant. The radius of the circle is 5 m, so that we could get the entire point cloud data of the plant.
The three stations are represented severally by A, B, and C and the angle interval between any two of them is 120° as depicted in Figure 1.(c). Here, scan operations of the LiDAR were performed in the "High" mode and we also used the total station to measure the location of every station accurately.
3.3 The Method of Acquiring Imaging spectrum Data
While LiDAR data was being collected, imaging spectrum data of sampling plots was collected by using the portable imaging spectrometer. The observation station arrangement of the imaging spectrometer was similar to that of the LiDAR. The coordinate values of each observation station were also obtained by the total station. In consideration of low vegetation, we chose an additional vertical observation position for them. Then, we collected imaging spectrum data from different horizontal and vertical angles at every observation station by using imaging spectrometer. The horizontal angle of the instrument working posture increased 15° every time from left to right to ensure that the whole range of a plot could be observed. The instrument vertical angle of the instrument working posture was set at the horizontal position, a depression angle and elevation angle, to ensure that any canopy wholly lies within the imaging range of the imaging spectrometer. Meanwhile, we had to check the preview of every scene for the sake of focus and frame in order to maintain the integrity and clarity of acquired data. As mentioned previously, we needed to examine the quality of data after every data collection process of a scene. If there existed spectral saturation in the collected data, we had to adjust exposure settings of the instrument and start a new scan. At the end of daily observations, we should make a data backup. As shown in Figure 2.(b), we were acquiring imaging spectrum data of coniferous trees.
3.4 The Acquisition of Auxiliary Data
Besides the LiDAR and imaging spectrum data, we took some scenery pictures of every plot and got some other related auxiliary data, including leaf area index (LAI), plant height, crown breath, diameter at breast height, and precise geographical position of every single plant, though ground direct measurements.
a. The measurement of LAI: we chose some representative sites in each sampling plot and collected LAI data by using the canopy analyzer. We measured 3 to 5 dispersed points that we used the GPS to locate and recorded on a map, and took the average as the LAI of a sampling plot.
b. The measurement of vegetation spectrum: we used the field spectrometer to collect the spectra of low vegetation. As to forest, if possible, canopy spectra were measured directly; otherwise, they were simulated though spectrum profiles of collected leaves.
c. The measurement of basic structure parameters: we dispersedly measured five times by the altimeter and took the mean value as the vegetation height of a sampling plot. Diameter at breast height, spacing and crown width of vegetation were all measured by a tape ruler.
d. The collection of other auxiliary information: we recorded meteorological elements from a handheld weather station, and collected other information such as species of vegetation, row spacing, slope, aspect, sensor height, etc. In addition, we took photos of sampling plots and observed overall canopies. Figure 1. The arrangement of LiDAR observation stations.
(b) Stations of a Small plot. (a) Stations of a Large plot.
(c) Stations around a single plant.
4. DATA PROCESSING AND APPLICATIONS
In our ground-based experiment, the data collected from every sampling plot generally includes: the high precision RTK location data, LiDAR data from different stations, imaging spectrum data of from different stations and angles, basic canopy structure parameters, such as plant height, crown width, LAI, etc, and terrain data such as row spacing, slope, aspect, etc. All of these form multi-source comprehensive ground data sets, which is of different species, stations and angles, as a supplement to the flight data. Up to now, we have fulfilled the preprocessing of each type of the original observed data, such as format conversion, structural storage, noise reduction, etc (Bucksch,2008; Palenichka,2010). Considering the research of synergy between LiDAR and imaging spectrum data, we have accomplished the co-registration of these two sorts of data and have succeeded in extracting vegetation canopies from the co-registered data. Now, we are applying the processed ground synchronous data to developing estimation methods of vegetation canopy structure parameters through physical models.
4.1 The Co-registration of the Synchronous Data
In fact, the synchronous data of each specific scene to were obtained from different types of sensors distributed at different locations in the observation experiment. Only through co-registration operation can we find out the prime match relationships in space between these multi-source data, which is one prerequisite for performing further study via comprehensive utilization of the observation results (Xie,2004). At first, in view of the large differences between the LiDAR and imaging
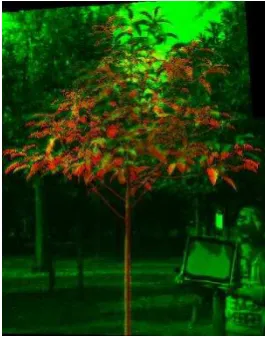
spectrometer in the manner of imaging, we converted three-dimensional point cloud data into two-three-dimensional images so as to meet the requirement of dimension consistency in co-registration courses. Figure 3. is a converted two-dimensional image of the laser point cloud data from a single plant. Then, we proposed an image registration method combining control points with mutual information of exacted features, which realized high-precision alignment of the LiDAR and imaging spectrometer data. A registration result of a single tree is shown in Figure 4. Our proposed method can effectively combine pictorial and statistical features of the active and passive data, and reach higher accuracy compared with the existing registration method based on control points (Abedini,2008; Kwak,2006). Its complexity is also lower than the registration algorithms in three-dimensional space(Habib,2004;Teo,2013). Our related research work and results have been submitted for complete publication.
4.2 The Synergic Exaction of Vegetation Canopy
As we mentioned before, LiDAR data can provide more detailed information about distributions and shapes of canopies, especially leaves, and play an important role in the research of vegetation biophysical processes on different scales. Nevertheless, the intensities of laser echo signals depend on
Figure 4.A Pseudo-color image of a pair of co-registered data. Here laser point cloud data is shown in red, and imaging data are given in green.
Figure 3.Aconverted two-dimensional image of the laser point cloud data from a single tree.
Figure 2. The scenes of acquisition ground data. (b) Scanning coniferous trees by using the
LiDAR and imaging spectrometer. (a) Scanning tea plants on a slope by
using the LiDAR.
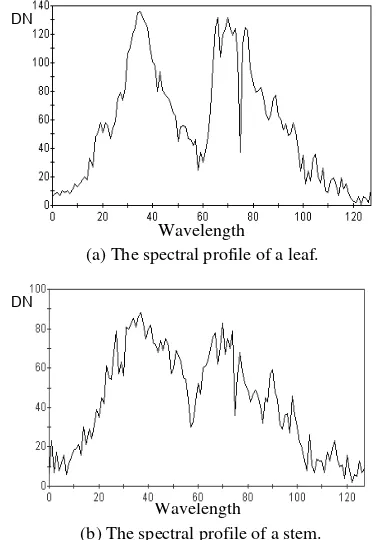
many factors, such as the wavelength and strength of emission pulses, angle of incidence, propagation environment and sampling distance, etc. Consequently, vegetation point cloud data cannot be segmented into leaves and stems by using echo intensity information merely(Ørka,2009). Moreover, the leaves and stems of most of vegetation usually shade each other and are very complex, which makes it difficult to separate their corresponding point cloud data. A segmentation method based on geometric information needs different experience values concerning different vegetation species. Owing to the lack of theoretical support, its calculation burden is also very heavy and its segmentation results are comparatively rough (Xu,2007). Accordingly, we utilized the abundant spectral information, from imaging spectrum data of the registered synchronous observation results, to segment the LiDAR point cloud data effectively. In the light of their differences in spectral reflectance, illustrated in Figure 5.(a) and (b), leaves and stems can be segmented in a imaging spectrum data with some thresholds in advance. Then, the segmentation results of imaging spectrum data can be merged with the LiDAR point cloud data of the same scene according to their registration parameters got in Section 4.1. Finally, with the guide of imaging spectrum segmentation results, we can extract the point cloud data of canopy leaves directly. Figure 6. is an extraction result of vegetation canopy leaves.
Furthermore, our proposed synergic extraction method can be also applied to classification, recognition and 3D modeling of vegetation, which will provide a more effective means for static monitoring and dynamic simulation of ecological environment on the ground.
4.3 The Synergic Retrieval of Canopy Structure Parameter
Ultimately, the co-registered and exacted synchronous data of vegetation canopy can be used to improve accuracy of canopy structure parameter retrieval. At present, a two-layer canopy reflectance model (ACRM) has been chosen, since it accounts for non-Lambertian soil reflectance, the specula reflection of direct sun rays on leaves, the hot spot effect, a two-parameter Leaf Angle Distribution (LAD) and the spectral effect of cultivation rows and is able to describe reflectance properties of natural homogeneous vegetation canopy with two-layer structures in more detail (Kuusk,2001).
Nevertheless, the ACRM model needs many precise input parameters that conventional measurements cannot offer, which constrain the accuracy improvement of retrieval methods based on physical models. Specifically, in the ACRM model LAD is represented by a two-parameter ellipsoid function, defined by
(1)
where θlrepresentsany leaf angle, θm is the mean leaf angle, e is the ellipsoid eccentricity and b is an intermediate variable derived from θm and e ( Liang, 2003). Actual leaf angles can be calculated by using LiDAR data and used to estimate these parameters more accurately. Therefore, we intend to synthesize the spatial information of LiDAR data and the spectral information of imaging spectrum data into the ACRM model and realize effective complementary of the active and passive data, with the aim of creating a consistent depiction of the observed vegetation. This research work is ongoing.
5. CONCLUSIONS
This article introduces the background, scientific objectives, and overall experimental design of our acquiring LiDAR and imaging spectrometer synchronous data on the ground. To some extent, the synchronous data have met the demand of our vegetation canopy structure research, with providing image, spectral and three-dimensional geometric information. However, because the limited adjustment of the LiDAR could not adapt to the height and spacing of plants in some experimental areas, the laser point cloud in some sampling plots are not distributed evenly. The density of laser point cloud collected far from the sensor is lower than those that is close to the sensor. There may even be no data somewhere. We ought to pay attention to the heterogeneity in post-processing. On account of changes of sky condition and effects of winds in scan processes, there are transplacements of point cloud in the overlap between adjacent stations, which also has some negative impacts on data mosaicking. Besides, due to thickness of forest, diversity of understory, and softness of meadow, some setting positions of
Figure 6.The extraced point cloud data of a vegetation canopy.
Figure 5. Vegetation spectral profiles. (b)The spectral profile of a stem.
Wavelength DN
(a)The spectral profile of a leaf. Wavelength
DN
the LiDAR could not be aligned with the total station very strictly. These factors may affect the precision of stitching the point cloud data of different stations significantly. On the other hand, in view of dense vegetation cover in some experimental sites, sunlight condition was relatively insufficient, which resulted in a little fuzz of imaging spectrum imagery. Furthermore, the uncertainty influence of weather variations, especially wind and sunlight, caused some distortion of imaging spectrum data. These problems also need to be noticed in data processing later.
In the future, we will perform more ground-based observation vertically on high vegetation canopies at a observation tower or track. If possible, we will carry out multi-temporal and long-term observation on vegetation on a small scale in order to study the problem of spatio-temporal extension of vegetation structure parameter extraction through synergy of active and passive remote sensing. Furthermore, we will increase the type of observation object in order to realize multi-direction and multi-angle observations on mountains, waters, roads, buildings and other types of land covers (Chen, 2014).
ACKNOWLEDGEMENTS
Our research is supported by the Chinese Key Project of Chinese National Programs for Fundamental Research and Development "Dynamic Analysis and Modeling of Remote Sensing Information for Complex Surfaces" (Grant 2013CB733400), the National Natural Science Foundation of China "Hyperspectral Remote Sensing Imagery Compression through Extracting Endmember Feature Information" (Grant 40901204), the China Postdoctoral Science Foundation "Dimensionality Analysis on Hyperspectral Remote Sensing Imagery with Rare Features Preserving" (Grant 20100471664), and the Fundamental Research Funds for the Central Universities of China" Synergy of Imaging Spectrometer and LiDAR Data for Forest Canopy Characterization" (Grant ZYGX2013J120). In addition, generous help for revising this paper was provided by the editors and reviewers.
REFERENCES
Abedini, A., Hahn, M., Samadzadegan, F.2008.An Investigation into the Registration of LiDAR Intensity Data and Aerial Images using the SIFT Approach. The International Archives of the Photogrammetry, Remote Sensing and Spatial Information Sciences, vol. 37, B1, pp. 169—175.
Bucksch, A., Lindenbergh, R.,2008. CAMPINO-A Skeletonization Method for Point Cloud Processing. ISPRS Journal of Photogrammetry and Remote Sensing, vol. 63, 1, pp. 115—127.
Bunting, P., Lucas, R.,2006. The Delineation of Tree Crowns in Australian Mixed Species Forests using Hyperspectral Compact Airborne Spectrographic Imager (CASI) Data. Remote Sensing of Environment, vol. 101, 2, pp. 230—248.
Chen, Y.; Wu, C.; Lin, S.,2014. Mechanisms of Forest Restoration in Landslide Treatment Areas. Sustainability, vol. 6, 10, pp. 6766—6780.
Dalponte, M., Bruzzone, L., Gianellea, D., 2012. Tree Species Classification in the Southern Alps Based on the Fusion of Very High Geometrical Resolution Multispectral/Hyperspectral Images and LiDAR Data. Remote Sensing of Environment, vol. 123, pp. 258—270.
Darvishzadeh, R., Atzberger, C., Skidmore, A., Schlerfc M.,2011. Mapping Grassland Leaf Area Index with Airborne Hyperspectral Imagery: a Comparison Study of Statistical
Approaches and Inversion of Radiative Transfer Models. ISPRS Journal of Photogrammetry, vol. 66, 6, pp. 894—906.
Habib, A.F., Ghanma, M.S., Tait, M.,2004. Integration of LIDAR and Photogrammetry for Close Range Applications. In: 20th ISPRS Congress, pp. 697:1--697:6. Copernicus GmbH, Göttingen .
Jacquemoud, S., Verhoef, W., Baret, F., Bacour C., Zarco-Tejada P.J., Asner G.P., François C., Ustin S.L.,2009. PROSPECT Plus SAIL Models: a Review of Use for Vegetation Characterization. Remote Sensing of Environment, vol. 113, pp. S56--S66.
Korhonen, L., Korpela, I., Heiskanen, J., Maltamo, M.,2011. Airborne Discrete-Return LiDAR Data in the Estimation of Vertical Canopy Cover, Angular Canopy Closure and Leaf Area Index. Remote Sensing of Environment, vol. 115, 4, pp. 1065--1080.
Kuusk, A.,2001. A Two-Layer Canopy Reflectance Model. Journal of Quantitative Spectroscopy & Radiative Transfer, vol. 71, 1, pp. 1--9.
Kwak, T.S., Kim, Y. I., Yu, K.Y., Lee, B.K.,2006. Registration of Aerial Imagery and Aerial LiDAR Data using Centroids of Plane Roof Surfaces as Control Information. KSCE Journal of Civil Engineering, vol. 10, 5, pp. 365—370.
Latifi, H., Fassnacht, F., Koch, B.,2012. Forest Structure Modeling with Combined Airborne Hyperspectral and LiDAR Data. Remote Sensing of Environment, vol. 121, pp. 10—25. Laurin, G.V., Chen, Q., Lindsell, J.A., Coomes, D.A., Frate, F.D., Guerriero, L., Pirottig, F., Valentinie R.,2014. Above Ground Biomass Estimation in an African Tropical Forest with LiDAR and Hyperspectral Data. ISPRS Journal of Photogrammetry and Remote Sensing, vol. 89, pp. 49—58. Li X., Cheng, G., Liu, S., et al,2013. Heihe Watershed Allied Telemetry Experimental Resarch. Bulletin of the American Meteorological Society, vol. 94, 8, pp. 1145—1160.
Liang, S.,2003. Quantitative Remote Sensing of Land Surfaces. John Wiley & Sons, Hoboken.
Omari, K., White, H.P., Staenz, K., King, D.J.,2008. Retrieval of Forest Canopy Parameters by Inversion of the PROFLAIR Leaf-canopy Reflectance Model using the LUT Approach. IEEE Journal of Selected Topics in Applied Earth Observations and Remote Sensing, vol. 6, 2, pp. 715—723.
Ørka, H.O., Næsset, E., Bollandsås, O.M.,2009. Classifying Species of Individual Trees by Intensity and Structure Features Derived from Airborne Laser Scanner Data. Remote Sensing of Environment, vol. 113, 6, pp. 1163—1174.
Palenichka, R.M., Zaremba, M.B.,2010. Automatic Extraction of Control Points for the Registration of Optical Satellite and LiDAR Images. IEEE Transactions on Geoscience and Remote Sensing, vol. 48, 7, pp. 2864—2879.
Puttonena, E., Suomalainena, J., Hakalaa, T., Räikkönena, E., Kaartinena, H., Kaasalainena S., Litkeya, P.,2010. Tree Species Classification from Fused Active Hyperspectral Reflectance and LIDAR Measurements. Forest Ecology and Management, vol. 260, 10, pp.1843—1852.
Schlerf, M., Atzberger, C.,2006. Inversion of a Forest Reflectance Model to Estimate Structural Canopy Variables from Hyperspectral Remote Sensing Data. Remote Sensing of Environment, vol. 100, 3, pp. 281—294.
Teo, T.A., Huang, S.H.,2013. Automatic Co-registration of Optical Satellite Images and Airborne Lidar Data using Relative and Absolute Orientations. IEEE Journal of Selected Topics in Applied Earth Observations and Remote Sensing, vol. 6, 5, pp. 2229—2237.
Teobaldelli M., Puig A.D., Zenone T., Matteucci M., Seufert G., Sequeira V.,2008. Building a Topological and Geometrical ISPRS Annals of the Photogrammetry, Remote Sensing and Spatial Information Sciences, Volume IV-2/W4, 2017
Model of Poplar Tree using Portable on-ground Scanning LIDAR. Functional Plant Biology, vol. 35, 10, pp. 1080--1090. Wang, C., Glenn, N.F.,2008. A Linear Regression Method for Tree Canopy Height Estimation using Airborne Lidar Data. Canadian Journal of Remote Sensing, vol. 34, Suppl. 2, pp. S217--S227.
Xie, Z., Farin, G.E.,2004. Image Registration Using Hierarchical B-splines. IEEE Transactions on Visualization and Computer Graphics, vol. 10, 1: 85--94 .
Xu, H., Gossett, N., Chen, B.,2007.Knowledge and Heuristic-Based Modeling of Laser-Scanned Trees. ACM Transactions on Graphics, vol. 26, 4, pp. 19:1--19:19.
Zhao, K., Popescu, S., Nelson, R.,2009. LiDAR Remote Sensing of Forest Biomass: a Scale Invariant Estimation Approach Using Airborne Lasers. Remote Sensing of Environment, vol. 113, 1, pp. 182—196.