TION ECOSYSTEM – CROSS-COUNTRY COMPARISON FROM
EUROPE
Master of Science Thesis
Examiner: prof. Saku Mäkinen
Examiner and topic approved by the Faculty Council of the Faculty of Business and Built Environment on August 28th 2017.
ABSTRACT
JUSSI VALTA: Policy pathways towards energy prosumer innovation ecosystem – cross-country comparison from Europe
Tampere University of Technology Master of Science Thesis, 118 pages November 2017
Master’s Degree Programme in Industrial Engineering Major: International Sales and Sourcing
Examiner: Professor Saku Mäkinen
Keywords: Energy prosumer, innovation ecosystems, distributed energy, policy comparison
Energy field is in transition caused by political interventions and decreasing costs of re-newable energy and ICT technologies. A new innovation ecosystem is being created around energy prosumers, new active market players, who produce part of their energy themselves. Electric vehicles, in-home batteries and ICT-driven business models like ag-gregation add possibilities to participate in the market. The transition from centralised energy system to a distributed one creates opportunities but also challenges for policy makers. Policy interventions are used for different purposes, like environmental targets but also developing economic competitiveness of the country. Policy instruments form policy mixes that steer the innovation ecosystem to a certain direction. The EU regulation creates a framework where countries are specialising in different technologies.
To structure the prosumer-related policy mix and see how they are deployed in practice, research questions of this thesis are:What policies contribute to energy prosumer ecosys-tem creation from prosumer’s point of view? How European countries differ in adopting these policies?
For answering the research question, a cross-country policy comparison was conducted. Data was gathered from secondary data sources. Countries researched were Finland, France, Germany, Switzerland and Italy. Policies that were included in scope were chosen according to an initial review of relevant papers and evaluation of their comparability. The policies were structured from prosumer’s point of view by using Rogers’ Innovation Adoption Model. It was based on adoption process of new solar PV system and adding electric vehicle, demand response or battery to the system.
The results of the cross-country comparison show that the case countries have different policy mixes related to energy prosuming. Germany supports microgeneration and bat-teries but lags behind in smart metering. Italy has a developed market for other areas except aggregation and demand response. Finland has developed good market conditions but does not incentivise any prosumer technologies. France has centralised energy market and lacks smart meters but has established regulation for demand response and incentives for microgeneration and electric vehicles. Switzerland has a dispersed policy landscape as cantons’ role is emphasised. It is a frontrunner in microgeneration and demand re-sponse but lags behind in smart metering. From the results, it can be seen that policy mixes could be further developed in each country to attain the potential prosumer inno-vation ecosystems have.
TIIVISTELMÄ
JUSSI VALTA: Poliittiset toimenpiteet energian tuottajakuluttajien innovaatio-ekosysteemien tukemiseen – maavertailu Euroopasta
Tampereen teknillinen yliopisto Diplomityö, 118 sivua
Marraskuu 2017
Tuotantotalouden diplomi-insinöörin tutkinto-ohjelma Pääaine: International Sales and Sourcing
Tarkastaja: professori Saku Mäkinen
Avainsanat: Tuottajakuluttaja, innovaatioekosysteemi, hajautettu energiantuo-tanto, vertaileva tutkimus
Energia-ala on suuressa murroksessa johtuen eri teknologioiden hintojen laskusta ja po-liittisista tukitoimista. Pientuottamisen, älymittareiden, kysyntäjouston, sähkön varas-toinnin ja sähköautojen kautta on syntymässä uudenlainen innovaatioekosysteemi, joka mahdollistaa kuluttajien osallistumisen sähkömarkkinoille uudella tavalla. Siirtyminen hajautettuun energiajärjestelmään johtaa lainsäädännön ja politiikan haasteisiin. Poliitti-silla toimenpiteillä on monia eri päämääriä, kuten ympäristön suojelu ja taloudellinen kasvu ja kilpailukyky uusilla markkinoilla. Kansantalouden kannalta voi olla viisasta pa-nostaa kilpailukykyyn strategisilla osa-alueilla, joskin Euroopan unionin säädökset tulee huomioida eri teknologioiden tukemisessa.
Tämä työ jäsentelee tuottajakuluttajiin liittyviä poliittisia toimenpiteitä ja vastaa seuraa-viin tutkimuskysymyksiin: Mitkä poliittiset toimenpiteet vaikuttavat tuottajakuluttajiin keskittyviin innovaatioekosysteemeihin? Miten eri Euroopan maissa näitä on toteutettu?
Työn tutkimusmenetelmänä käytettiin politiikkavertailua, joka suoritettiin sekundääristen tietolähteiden avulla. Maat, joiden politiikkayhdistelmiä tarkasteltiin, olivat Suomi, Ranska, Saksa Sveitsi ja Italia. Tarkasteltavat politiikkasäädökset rajattiin tutkimalla, mitä ajankohtaisia kysymyksiä tuottajakuluttajiin liittyy tällä hetkellä. Lisäksi niiden ver-tailtavuutta arvioitiin. Säädökset jäsenneltiin tuottajakuluttajan näkökulmasta käyttäen pohjana Rogersin innovaatioiden adoptointiprosessia. Mallissa kuluttaja ottaa käyttöön aurinkopaneelijärjestelmän ja liittää siihen kysyntäjouston, sähköauton tai/ja akun. Työn tulokset osoittavat, miten erilaisia politiikkayhdistelmiä maat ovat implementoi-neet. Saksa tukee sähkön varastointia, sähköautoja ja pientuottamista, mutta se ei ole tuo-nut älymittareita tai kysyntäjoustoa kuluttajamarkkinoille. Italia on edelläkävijä muissa teknologioissa ja ratkaisuissa, mutta sen kysyntäjoustomarkkinoita ollaan vasta luomassa. Suomi on edelläkävijä kysyntäjoustossa ja älymittaroinnissa mutta pysyttäytynyt mark-kinaehtoisissa ratkaisuissa teknologioiden edistämisessä. Ranskalla on hyvin säädellyt kysyntäjoustomarkkinat ja se tukee pientuottamista. Siltä kuitenkin puuttuu vielä älymit-tarijärjestelmät ja alhaisen sähkönhinnan vuoksi varastointi on kannattamatonta. Sveitsin kantonijärjestelmä vaikeuttaa kokonaiskuvan luomista, mutta kysyntäjousto ja pientuo-tanto ovat hyvin säädeltyjä ja tuettuja. Älymittareita Sveitsi ei ole vielä ottanut käyttöön. Tuloksista voidaan päätellä, että poliittisilla toimenpiteillä painotetaan eri teknologioita eri maissa. Ekosysteemin kehittämisen kannalta olisi järkevää, että maat täydentäisivät niiden politiikkayhdistelmiä puuttuvien teknologioiden ja sovellusten kohdilla.
PREFACE
Writing this thesis has been an interesting journey. Sometimes it felt like jumping on a moving train because especially electric vehicles develop so rapidly right now. Experi-encing this phase of these technologies in Brussels was special due to the discussions on the Clean Energy Package of the European Commission. It was released only a couple months before this work was started.
I would like to thank professor Saku Mäkinen and Kirsi Kotilainen for steering me in the process of making this thesis. I would also like to thank Joona Turtiainen and others from Nordic Energy Office in Brussels for advices on the topic. In addition, I would like to thank my friends in communities FC Juhuu and ‘9 ½’ for continuous support even from distance. Finally, I would like to thank Sanni for supporting, listening and motivating me during the long journey.
In Brussels, 10.11.2017
TABLE OF CONTENTS
1. INTRODUCTION ... 7
1.1 Background ... 7
1.2 Research questions ... 8
1.3 Structure ... 9
2. INNOVATION AND REGULATION ... 10
2.1 Factors of innovation diffusion ... 10
2.1.1 Incremental and disruptive innovations ... 10
2.1.2 Innovation adoption ... 12
2.1.3 Prosumers ... 15
2.1.4 Prosumer activities ... 17
2.1.5 Innovation ecosystem ... 21
2.1.6 Energy prosumer ecosystem ... 23
2.2 Policy interventions ... 25
2.2.1 Industrial policy approach ... 28
2.2.2 Innovation policy approach ... 30
2.2.3 Environmental policy approach ... 33
2.2.4 Transition policies ... 35
2.2.5 Policy mixes ... 37
2.3 Regulating energy prosumer ecosystem ... 39
3. RESEARCH METHODOLOGY ... 44 3.1 Methodological approach ... 44 3.2 Case countries... 45 3.3 Policy inclusion ... 47 3.4 Data collection ... 48 3.5 Data analysis ... 49
4. RESULTS AND DISCUSSION ... 51
4.1 Phase 1: Knowledge ... 51
4.1.1 Liberalisation of the energy markets ... 51
4.1.2 Smart meters ... 54
4.2 Phases 2 and 3: Persuasion and Decision ... 56
4.2.1 Building codes ... 56
4.2.2 Labels and certificates ... 58
4.2.3 Investment aids ... 60
4.2.4 Third party ownership ... 62
4.3 Phase 4: Implementation ... 65
4.3.1 Interconnection rules and costs ... 65
4.3.2 Indirect benefit from self-consumption ... 67
4.3.3 Collective self-consumption ... 73
4.3.4 Compensation for electricity fed into the grid ... 75
4.4.1 Aggregation ... 78
4.4.2 Energy storage ... 83
4.4.3 Electric vehicles ... 85
4.5 Summary of country regulations ... 87
5. CONCLUSIONS ... 92
5.1 Results ... 92
5.2 Contributions of the study ... 93
5.3 Assessment and limitations of the research ... 95
5.4 Future research ... 99
ABBREVIATIONS
ACER Agency for the Cooperation of Energy Regulators
AMI Advanced Meter Infrastructure
AMM Automated Meter Management
AMR Automated Meter Reading
CEER Council of European Energy Regulators
CPP Critical Peak Pricing
DER Distributed Energy Resources
DR Demand response
DSO Distribution System Operator
EC European Commission
ESCO Energy Service Company
ETS Emission Trading System
EU European Union
EV Electric Vehicle
FIP Feed-in premium
FIT Feed-in tariff
HEMS Home Energy Management System
ICT Information and Communication Technologies
IS Innovation System
LCOE Levelized Cost of Electricity
NRA National Regulatory Authority
nZEB nearly Zero Energy Building
PPA Power Purchase Agreement
PV Photovoltaic
R&D Research and Development
RE Renewable Energy
RED Renewable Energy Directive
RES Renewable Energy Sources
SC Self-consumption
TM Transition Management
ToU Time-of-Use
TPO Third Party Ownership
TSO Transmission System Operator
VAT Value Added Tax
V2G Vehicle to Grid
VPP Virtual Power Plant
1. INTRODUCTION
1.1 Background
Energy field is experiencing a big transformation as countries are determined to answer to the challenge of global warming. The EU (European Union) has a long-term goal of decreasing its total carbon emissions by 80% by 2050 in comparison to 1990 level (European Union, 2012). It has made commitments that in 2030 it will increase the share of renewable energy sources (RES) in its final consumption up to 27% in total. For elec-tricity sector, this means shares of approximately 50%. The energy sector has traditionally been included in “network industries” with telecommunication, water and transport (Daly, 2016). These all have been characterised by natural monopolies that have been diluting with more liberalised, yet often regulated, competition. Adding distributed en-ergy resources (DER) in the enen-ergy system revolutionises the old top-down structure of the field and brings different kind of player: “prosumers”, into the value chain (Schleicher-Tappeser, 2012).
Prosumers were introduced by Alvin Toffler (1981) as customers’ response to industrial-ised mass markets. Due to increasing resources and needs, customers started to want cus-tomised and differentiated products. During recent years, prosumption has become again into scope of research due to new technologies like 3D printing and sharing content on web (Ellsworth-Krebs & Reid, 2016). In the context of energy, prosuming refers to cus-tomers who are active in the market by producing, storing and selling energy. By adding an in-home battery, they can increase their autonomy from the grid but also act as a flex-ibility resource by providing grid services. Being active in the market means also co-creation by which prosumers become important part of the ecosystem development. Prosumer technologies like solar photovoltaic (PV) and electric vehicles (EVs) have been developed in politically protected niches until recently. Now they are getting cost com-petitive and entering to the main stream. They can be seen as disruptive innovations in relation to the old business models of the energy sector. Utilities are more and more be-coming big data specialists to enable flexibility and integration of DERs in the grid (Markard & Erlinghagen, 2012). A whole ecosystem is being built around these technol-ogies and different companies attain different strategic positions. Aggregators are needed in handling DERs cost efficiently, solar PV suppliers and installers manage the uptake of microproduction, and EV manufacturers try to attain value through battery diffusion. Complementing technologies like smart thermostats, boilers, applications, remote con-trols and displays offer opportunities for niche players. Business model innovations come
through new partnerships and acquisitions like in the case of Tesla and SolarCity (Frankel et al, 2014).
The context of the thesis is shown in figure 1. Because energy prosumer policies bring vast energy field into residential sector, this thesis takes macro, meso and micro level into consideration.
Policy approaches EU regulation
Innovation ecosystem Prosumer technology adoption Policy mix
Macro
Meso
Micro
Figure 1.Context of the thesis (modified from Kotilainen et al., 2016).
The EU regulation affects countries’ policies according to climate targets, economic sit-uation and other wide socio-technical trends. Political agenda pushes now energy transi-tion, which means a shift away from fossil fuel usage. Usual framing of energy policies is the ‘energy trilemma’, meaning that governments have to choose between energy se-curity, low costs and sustainability. This thesis highlights innovation creation, and there-fore following policy approaches are handled: industrial policy, environmental policy, innovation policy and transition policy. These approaches have different objectives and they frame the policy instruments differently. Chosen policy approaches deal with the transition in different ways. Transition policies thrive this disruptive socio-technical change whereas industrial policies enforce the current regime’s position and thrive for incremental change (Alkemade et al. 2011). Innovation policy aim to create new compe-tences and networks and environmental policies aim at environmental protection.
Countries have introduced different kinds of incentives for energy prosumers. Policies depend on policy strategies that countries adopt. Sustainable technologies have potential of integrating these objectives in policy mixes (Rogge & Rechardt, 2013, p. 19). These happen in the meso level, which determines the practices and rules regarding the prosumer ecosystem. The lowest level of the system include the prosumers and how they react to the policy mixes. In this thesis, the policies are framed as prosumer journey where different policies affect different steps of technology adoption.
1.2 Research questions
This thesis handles residential prosumers since they are set in the focus of EU’s Energy Union and reflect well the challenges the energy transition brings along (European Commission, 2017b, pp. 4-6). For example, prosumers have consumer’s status and need
different kind of informing and other policies than cooperatives and commercial prosum-ers who may have professionals taking responsibility. The first objective of this thesis is to structure policy interventions that affect the development of the energy prosumer eco-system into a relevant and comprehensive form. The first research questions of this thesis is:
RQ1: What policies contribute to energy prosumer ecosystem creation from prosumer’s point of view?
The second objective is to explore, what kind of decisions has been made regarding the studied public policies. The EU harmonises the regulation and in principle companies act in one single market. However, in the energy field, the single market is still developing. Countries may emphasise adoption of different technologies because of different envi-ronmental reasons and political objectives. This thesis combines also the strategic inno-vation management aspect into the picture. If the policy targets’ motiinno-vations are unclear, there is a danger of creating needless incentives that could be covered by different, less costly, policies. On the other hand, if people’s opinions are not taken into consideration and the technology diffuses quicker than the regulation, there will be a problem of ‘regu-latory disconnection’ that has appeared strongly in cases of AirBnb and Uber, for example (Butenko, 2016). The second research question is:
RQ2: How European countries differ in adopting these policies?
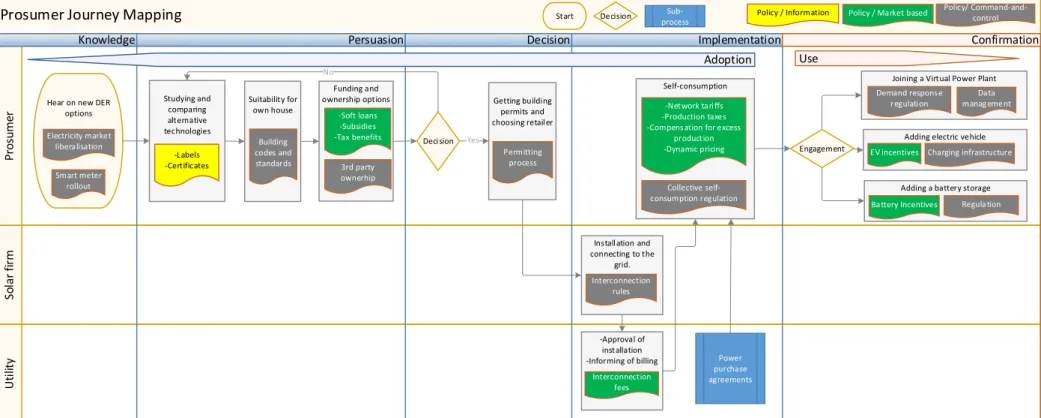
These questions are answered by studying policies in Germany, France, Switzerland, Italy and Finland. This is conducted with a cross-country policy comparison. As the influence of the EU is important in the energy field, the results also show the approaches the EU has on the different policies. To emphasise the consumer approach, this thesis uses Rog-ers’ (2003) Innovation Adoption Model to structure the regulations and incentives that affect the prosumer. In addition, earlier literature of related to energy prosumers has con-centrated in separate technologies and their regulations. This thesis concentrates in the most common prosumer technology solar PV, but adds enabling technologies like EVs, storage and DR into the scope. These technologies are interconnected and form the eco-system of distributed energy resources (DER).
1.3 Structure
The thesis is organised as follows: Second chapter will describe issues in governing in-novations and innovation ecosystems. It introduces the approaches on which prosumer policy mixes are being built. The methodology chapter describes the policy scoping pro-cess and data collection methods. Fourth chapter includes the results and discussion. Dis-cussion is added to the results because in that way is easier to demonstrate the dynamics between different policy options. The conclusions chapter will wrap up the results, dis-cuss the methodology and look forward to next challenges for research.
2. INNOVATION AND REGULATION
2.1 Factors of innovation diffusion
2.1.1 Incremental and disruptive innovations
“Innovations are processes where new or value adding products, processes, materials and services are established and repositioned to the places they are suitable” (Rubenstein, 1989). Traditionally innovation theories emphasis technological innovations and are cat-egorised to incremental and disruptive innovations (Markides, 2006). However, business model innovations play increasingly important role in companies’ innovation activities and often beat pure technological innovations (Chesbrough, 2007, p. 12). Disruptive in-novation can create remarkable competitive advantage to companies. Companies can ei-ther choose the strategy of first-mover or second-mover. Being first-mover may help to occupy the whole market and bring a monopolistic position by controlling resources. Be-ing frontrunner means also high costs and risks because it has to develop the new business model from scratch. Being a second-mover can bring some free-rider benefits by imita-tion, learning on the market and saving from research and development (R&D).(Schilling & Esmundo, 2009)
Technological innovations
The roots of incremental vs. radical innovation typology are in technological innovations (Dijk et al., 2015). Incremental innovations usually keep the same market and marketing approach. They are based on the existing knowledge, technology or products of the com-pany (Schoenmakers & Duysters, 2010). Often they are low level of risk and developed by small-scale experiments and problem solving inside the organisation (Bessant et al. 2014, p. 1284). They focus on improving products that mainstream consumers value (Dijk et al. 2015). Better fuel efficiency of engines is a good example of incremental technology innovation (Berninger et al., 2017). In some industries, this is highlighted whereas other industries have much faster innovation cycles. For example, the new generation of smart phones comes much faster to the market compared to energy production or new cars (Canzler et al. 2017, p. 31).
Technological innovations are disruptive to the competitors when they propose new prod-ucts and value propositions that do not fit in the producers competences and consumers’ current behaviours (Markides, 2006, p. 22). There are many examples of incumbent com-panies having troubles managing disruptive innovations (Magnusson et al., 2003, p. 4). Their aim is usually to achieve the dominant design that is approved by the whole industry and only incrementally improved. The mainstream consumers regard disruptive innova-tions worse in key funcinnova-tions but some consumers value some new features (Dijk et al.
2015, p. 278). Abernathy and Clark (1985) divide the technology linkage of innovations by disrupting or conserving competences.
Another way that highlights the technological side of innovations is examining the change on component level linkages and the components themselves. Disruptive innovations change also the role and choice of components that are used. For example, energy storage may change the way grids are needed in the energy system. Incremental innovation typi-cally keeps the same linkages between components but enhance their performance. In addition to these innovation types, Magnusson et al. (2003) introduces architectural and modular innovations. Architectural innovations keep the same type of components but change their interfaces and the way they are used. In modular innovations, new compo-nents are introduced but the linages between them remain the same.
Business model innovations
Companies have to develop business model innovations aside product innovations. If the competitor has same product but better business model, they will capture the profits from the market (Chesbrough, 2010). Business model innovators do not necessarily create new products or services but instead change the way they are delivered to the customer and this change can be disruptive or incremental. Garcia and Calantone (2002) divide business model innovation into three categories: newness to the firm, newness to the industry and newness to the customer. Business models have many different definitions depending on what the author is highlighting and what is his or her background. In a much used work, Timmers (1998) highlights information flows, Chesbrough (2007) value creation and cap-ture. Aside product-oriented innovations, Tukker (2004) classifies business model inno-vations into use oriented and result-oriented models.
Breakthrough innovations, like integration of internet in cell phones to transportation sec-tor, can change business models disruptively. In general, they change the value network and bring along business models that come outside company’s usual business paradigm (Biber et al. 2017, p. 12). Sharing economy has many implications from disruptive inno-vations. Uber, AirBnB and other companies that have changed the business models in very traditional sectors, are good examples of business model innovations that pose chal-lenges to regulation. Biber et al. (2017) claim that regime-shifting innovations involve combination of new business models that leverage a breakthrough technology.
Incremental business model innovations develop the existing model but do not create dis-continuities. Bucherer et al., (2012) take the case of new vehicle insurances as an exam-ple. In their approach, new business models can be disruptive either for the industry or for customers. For example, Better places, a Danish EV car sharing company tried to change both of them.
2.1.2 Innovation adoption
MacVaugh and Schiavone (2010) divide the adoption of innovation into three domains. On micro-level, the adoption depends on learning conditions. On meso-level, the adoption depends on social conditions and macro-level depends on technological conditions. The micro-level refers to personal adoption of a technology. Each domain has to be thought and evaluated, since they perceive the innovation adoption differently. Individuals eval-uate the benefits and costs of change through their relationships and other community members. Norms, values and hierarchies are shared within other people and affect the desirability of different technologies. On macro level, there is an advantage for first mov-ers to gain the dominant design. Microsoft Office software is one example of such devel-opment. On a broader scale, this can mean technological lock-ins that makes it harder not using a certain technology because of important complementary products are based on one technology. Within this kind of development there are whole industry clusters grown which are embedded in the social structures. (MacVaugh & Schiavone, 2010)
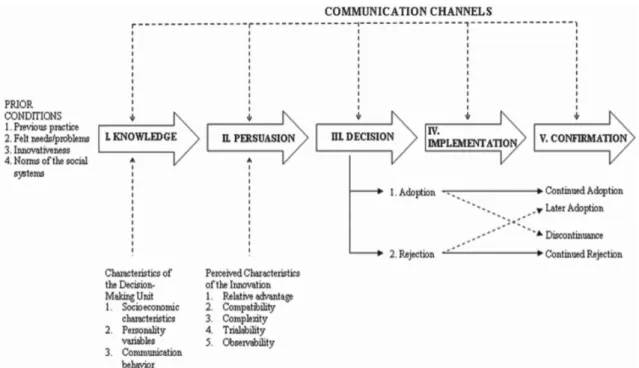
For personal adoption, which is the approach of this thesis, the most common framework of innovation adoption is Rogers’s (2003) innovation adoption model. According to, the innovation decision is a process which stages are knowledge, persuasion, decision, im-plementation and confirmation (see figure 3). Customer chooses after every stage, whether he/she will continue to the next step. The process is essentially an information-seeking and processing activity. Each step aims to reduce uncertainty and communicate the advantages of the innovation by the right communication channels. Generally, mass media is better in giving the initial awareness and spreading information of the innovation whereas peer-to-peer communication is more effective in shaping attitudes towards the innovation.
Home energy systems are strategic purchases that take big proportion of household budget, long-term commitment and high involvement in the process. Common factor of such durables is that buying decision is complex especially if the price is perceived high. Difference to frequently purchased items is that there is less possibility to try the product beforehand and learn from errors. Compared to a car or a house, energy systems and their use can also be less familiar for the customers. (Koklic & Vida, 2001)
Figure 2.Innovation adoption process (Rogers, 2003).
Innovation adoption process begins when customer realises the existence of the innova-tion, understands how it functions and how to use it efficiently. Gaining information is usually framed by personality variables and socio-economic characteristics. Usually peo-ple are selective to information and pick to ones that suit their opinions and interests. Some researches see that individuals seek actively for information whereas some say that individuals come aware of innovations more through coincidence. There might be a need for the innovation before the awareness of the innovation is created or the innovation suits a problem that is not conceptualised yet. Some customer segments are more probable to adopt technologies and therefore act as important target groups for marketers and policy makers. (Rogers, 2003)
Persuasion is a stage where customer evaluates the innovation and its attributes and forms an attitude towards it. At this phase, the individual starts actively seeking and processing information of the idea. Ability to imagine the future use of the innovation is important for the planning of the adoption. For this purpose, he/she seeks more customised infor-mation, which the mass media usually cannot provide. According to Rogers (2003), the diffusion determinants at his stage are relative advantage, compatibility, complexity, ob-servability and trialability. Relative advantage depends on the earlier experience customer has on the similar technology and how much he or she has put resources in learning it. Here, the individual perception of the advantages is more important than the objective advantage. Switching costs can be perceived bigger if one has used some time to over-come complexity issues related to the adoption. If the innovation is perceived difficult to understand and use, customer will probably reject it. Compatibility means the closeness of the innovation to customer’s earlier experiences, needs and values. Trialability refers
to the possibility to experiment the innovation. Observability is the degree of visibility of the value and benefits of the innovation.
Persuasion leads to decision of adopting or rejecting the innovation. Adoption can happen also partially, because people often want to try the innovation before the final decision. A possibility for small trial decreases perceived uncertainty and accelerates innovation diffusion. Sometimes it is enough if a peer has tried the innovation. In these cases it is also important whether the lead user or demonstrator is a so-called opinion-leader (von Hippel, 2005). (Rogers, 2003) Even though the perception of the innovation might be positive, he/she may still reject the innovation. This situation has been studied in the KAP-gap (knowledge-attitude-practice) literature. This literature is often related to Ajzen’s (1985) Theory of Planned Behaviour that attempts to explain the links between values, beliefs, attitudes intentions and behaviour.
In implementation phase, the customer does the purchase and continues to evaluate the usefulness of the innovation. Implementation leads to routinisation where new idea be-comes part of his/her habits and everyday life. Customer might still be uncertain about the innovation. Therefore, he/she gathers more information on the usage and operational problems it has. Innovation might also be used in a different manner than was originally intended by the inventor. This re-invention come from user’s modifications and changes to the innovation. According to Rogers (2003), invention is a good word for describing this change because it changes the inventor’s idea of the innovation. Re-inventing hap-pens especially when innovation has many applications, it is implemented to solve a wide range of problems or there is strong local pride of ownership. However, manufacturers often create products which are not easy to modify or even repair (von Hippel, 2005). In confirmation phase, the decision is already made but he/she is still looking for more information on the innovation. This information either reinforces or creates need to re-verse the adoption decision. A discontinuance of use can be divided in two categories: 1. Replacement and 2. Disenchantment. Replacement happens usually in sectors where in-novation cycles are fast and the new inin-novation just replaced the older inin-novation. Dis-enchantment is decision to reject an idea because of dissatisfaction or poor performance. In addition, wrong usage can push to rejection, which has been observed especially in late adopter segments. Shih & Venkatesh (2004) extend the model to the usage phase of the innovation by looking at frequency and ways of usage.
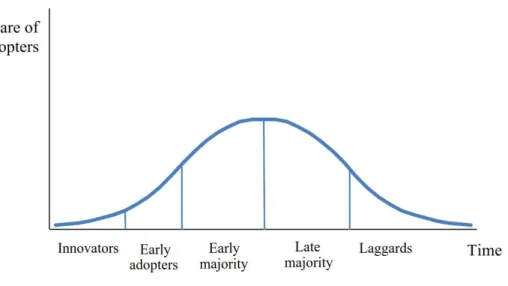
Adopter Segments
Customer segments are a common theme in marketing studies. This research area studies consumer characteristics, demographics and how they change in time and experience (MacVaugh & Schiavone, 2010, p. 199). The segments are showed in figure 3. The first adopter segment, innovators, are characterised as technology-oriented risk-takers. They have more resources and are closer to scientific groups developing the technologies than other segments. The next group, early adopters, have the most influence in the opinions
of later adopter categories (Rogers, 2003). They are more careful in their choices than innovators and usually they are well educated and informed. They are a very important part of the technology learning and shaping because they create new knowledge and con-ventions regarding the technology. As they are interested in the technology itself, they can also become co-producers of it. They share experiences and solutions through peer-observation, where people tend to have different needs and resources. That diversity makes innovating efficient because probability of reaching the needed knowledge is big (von Hippel, 2005).
Figure 3. Adopter segments (Rogers, 2003).
Early majority are the first to adopt technologies in a more mass-market oriented manner but they do not have same opinion leadership as early adopters. Moore (2002) calls the difference between early adopters and early majority ‘the chasm’ as it separates the vi-sionaries and pragmatists who have different expectations on the technology. Pragmatists value ready products and turnkey solutions. Usually the diffusion of a technology accel-erates after a certain stage when it has sufficient market scope. The diffusion spreads progressively upon one market from early adopters to majority and laggards. Late major-ity are relatively conservative who form the average participants. They might have less financial resources and lower social status. Last group are the laggards who are sceptical on new technologies and have an aversion to change. (Rogers, 2003)
2.1.3 Prosumers
Prosumers are “people who produce many of their own goods and services” and accord-ing to Toffler (1981) there are many reasons to this. People have more time besides work, and they are more educated. Workforce is expensive and do-it-yourself practices are seen as self-actualisation, which brings satisfaction and better products. According to Kotler (1986), there are two types of prosumers: “The Avid Hobbyist” and “The Archprosumer”. The first ones mainly produce to exchange but makes some products also for own use.
The latter refers to people who prefer to make almost everything by themselves thus avoiding the mass consumption society.
Prosuming changes the usual value chains as customers’ role is expanded to create part of the value creation. The idea behind prosuming is self-service. In prosuming context it does not mean less service but facilitating participation and fulfilling individual needs (Bremdal, 2013; Kotler, 1986). Prosumers see that they get more value from networking than acting within one value chain. Typical examples of value networks come from web domain and programming. Users are able to add their own work in shared platforms, like Wikipedia, Linux-based software, 3D-printing applications, Lonely Planet and Trip Ad-visor (Daly, 2016; IEA, 2014).
In the energy field, the definition of the prosumer is typically relatively simple, like: “con-sumer of energy who also produces energy to provide for their needs, and who in the instance of their production exceeding their requirements, will sell, store or trade the sur-plus energy” (Ford et al., 2016). Parag and Sovacool (2016) adds also the use of smart appliances, communication technologies, EVs and battery storage capacities for flexibil-ity services in the definition. Difference to current demand response (DR) markets, for example, is remarkable as prosumers step from being reactive to price signals to being active service providers to the grid. Prosumers’ influence in the market has to be high-lighted as they affect and provide value not only to themselves but also to others: neigh-bours, network operators and the society.
Energy prosumers are seen differently by emphasising differently the technicality and human aspect of their involvement to the energy market (Olkkonen et al. 2016). The more technical approach in literature links prosumers to intelligent systems such as EVs and smart houses. When smart houses are linked to demand side response that supports the electricity system, difference between energy production and home automation dilutes. Furthermore, when prosumers are bundled together by an aggregator, they can act as vir-tual power plants, which can be valuable resources to the electricity system.
The more behaviouristic approach of literature includes studies in energy communities and behaviour. It highlights the legal framework in which prosumers act. Prosumers can be seen as “active customers” highlighting consumer rights that they need from being separated from utility-scale energy production (Roberts, 2016). Bleicher and Gross (2015) see prosuming as co-development of RES within inventors and users. Olkkonen et al. (2016) refer to prosumers also as producer-consumer-citizens since they can have a distinctive impact in the community they act.
Some researchers combine these approaches. According to Shandurkova et al. (2012) prosumer is an economically motivated entity that consumes, produces and stores elec-tricity and energy in general; optimises the economic and to some extent the
technologi-cal, environmental decisions regarding its energy utilisation and becomes actively in-volved in the value creating effort of an electricity or energy service of some kind. Mean-while they also change the usage patterns of energy by changing the values that are related to energy consumption (Ellsworth-Krebs & Reid, 2016).
Motivations to invest in own energy production is a vastly researched topic. Balcombe et al. (2013) did a research on microgeneration adoption and categorise the motivation fac-tors as finance, the environment, security of supply, uncertainty and trust, inconvenience and impact on residence. Karakaya et al. (2015) see in their case study that in grid parity situation in southern Germany, environmental reasons and gained independence from electrical suppliers are important motivators. IEA report (2014) on residential prosumers mentions also status and prestige and interest in technology as motivators.
In literature on energy prosumers focuses not only on electricity but also heat and transport (Ellsworth-Krebs & Reid, 2016). This limitation depends on the article’s ap-proach. Possible technologies energy prosumers can use are solar PV, micro wind energy, geothermal, small scale CHP (e.g. biogas) or hydropower (Brange et al. 2016; Ellsworth-Krebs & Reid, 2016).
2.1.4 Prosumer activities
Prosumer participation in the market is coming more significant as technologies and reg-ulation open new areas of the energy market for them. The main activities that are now in sight are handled in this chapter and are shown in figure 4.
Prosumer
activities
Demand respose Co-creation Flexibility services Storing Self-consumption ∂ Residential ∂ CommunityFigure 4.Energy prosumer activities.
Self-consumption
Prosumers produce part of their own consumption with different microgeneration tech-nologies. Most common technology is solar PV installed on roofs. Typically, the produc-tion levels with solar PV is approximately 30% (Schill et al., 2017). Rest of producproduc-tion is fed into the grid, stored or sold (IEA, 2014). Self-consumption (SC) is relatively new model because until recently all own production was fed into the grid and remunerated
with a feed-in tariff (FIT) or net metering. The FIT used to be clearly above the normal wholesale price of electricity and is still is given for tens of thousands investor homeown-ers. With FIT model, prosumers continue to buy electricity from the utilities like before (IEA, 2014). Self-consumption works in very different dynamic and incentivises to buy smaller installations especially if own consumption is small whereas FITs incentivised to buy as many panels as possible (Schill et al. 2017).
Community self-consumption
If the prosumers are not active themselves, there is also a possibility that they can join a prosumer program running in their neighbourhood (Ford et al. 2016). Community project is a way for people to get together and think how they can develop their energy usage collectively. One example is a project where community is investing together in a wind farm or other bigger plant nearby (Ford et al. 2016). There are also many examples of initiatives where a micro grid is created between households and people use their produc-tions and storages collectively. Community micro grids are nowadays built on campuses, suburbs, harbours or other bigger entities. They are seen from the distribution system operator’s (DSO) perspective as one single connection point. Micro grids can have bene-fits like added resilience, decreased losses and increased efficiency of the delivery sys-tems (Adil & Ko, 2016; Koirala et al. 2016). Technologies that can be used on a commu-nity level are mostly the same, but bigger, as at household level.
Demand response
Shifting consumption from darker to sunnier times of the day can mean, for example, washing cloths during the day or adjusting thermostats so that they forecast the weather. This changes usage patterns, knowledge, and values towards flexible and greener models (Ellsworth-Krebs & Reid, 2016, p. 1992). It is similar to implicit DR, which happens when consumers decide to choose dynamic pricing for their energy contract. The con-sumers are exposed to time-varying electricity prices or network tariffs. However, in these contracts consumers are not participating in balancing or ancillary service markets (Bertoldi et al., 2016, p. 3).
Storing
Storing energy is a key for further integration of renewable energy (RE) in the grid be-cause it is intermittent in its nature. Prosuming storage is called “prosumage” (producing, consuming and storing) (Schill et al. 2017). Storing is usually done by installing a battery in the house and charging it with own production that is not immediately used. Companies like Sonnen are building services like trading on top of the batteries (Ford et al. 2016). The level of activeness towards the system depends on how much smartness is integrated to the storage and how it reacts to the market price signals. Firstly, the storage may only focus on maximising self-consumption rates and not looking at market prices. Secondly, the storage may have system-oriented shifts in charging by looking at market prices.
Thirdly, the storage can interact with the market with flexibility services (Schill et al., 2017, p. 147). Storing can be done also in the battery of an EV but then the electricity is not necessarily used in the house but for transportation. When batteries and EVs do charg-ing in a controlled way, they do not create peaks to the system (Pérez-Arriaga & Knitte, 2016, pp. 292-293).
Flexibility services
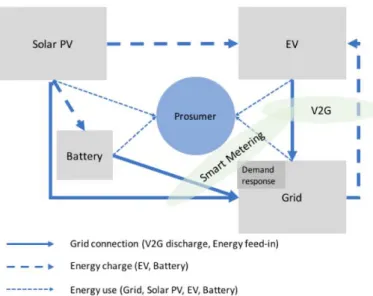
Flexibility services can be delivered through Virtual Power Plant (VPP) business model. When entering the energy market individually is not economically or technically reason-able, it can be done by an aggregator. An aggregator gathers many households into one entity that can offer controlled demand shifts in the market. Aggregator is acting on the same level as a retailer but delivers two-way transactions. The flexibility is offered to the DSO or Balance Responsible Party (BRP) (EnergieKoplopers, 2016). Applicable tech-nologies that can be aggregated are fridges, boilers, heat pumps, thermostats and other appliances that do not have to be on constantly or have little impact on people’s everyday life. In Vehicle-to-Grid (V2G) solutions, EVs and batteries can provide flexibility ser-vices by feeding electricity to the grid when car is parked and electricity prices are high. Missing infrastructure and standards, skepticism of consumers, like concerns about car batteries being charged when needed are issues that come up when as they become more mainstream (Steinhilber et al. 2013). The prosumer connections and activities related to the grid are illustrated in figure 5.
Figure 5.Prosumer activities related to the grid (Kotilainen et al., 2017).
Co-creation
Prosumers are also co-producers who engage in development of the production and busi-ness models through co-creation (Bremdal, 2011; Olkkonen et al., 2016). As innovations come from a network of players, the innovation process opens for many actors.
Democ-ratised knowledge, harder control of expertise and ideas and venture capital have dimin-ished borders of innovation and companies have shifted from closed innovation processes into open ones. However, not all industries, like nuclear power generation, are willing to open their innovation processes. (Chesbrough, 2003) Co-creation is an active, creative and social process, based on collaboration between producers and users that is initiated by the company to generate value for customers. It allows use of customers’ creativity, improves customer relationships and enables the company to adapt market trends. Innovation process can be divided into two main steps: the contribution of novel ideas and selection of best ideas that are further elaborated. O’Hern & Rindfleisch (2008) cre-ated a typology of these two tasks as illustrcre-ated in figure 6. The contribution activity ranges from being fixed to company’s own processes or being open to everybody. Selec-tion part ranges in a similar way from company’s own decision to power of the customers.
Figure 6.Types of customer co-creation (O’Hern, M. S., & Rindfleisch, 2008).
Collaboration is a process where customers have power to create and choose best inno-vations. For example, open source software like Linux works in this way. Tinkering means that customers make modifications to existing products and these changes are taken into account when company releases the next version of the product. In co-design-ing, customers provide new ideas to the company, which then typically lets customers vote for the best models. Submitting often takes place by company’s invitation for new ideas. Ideas are formatted in a way the company wants and the company also has the full power to choose the innovations.
This framework is relevant to the energy field because people producing their own energy are also developing their production. Yet, co-created ideas can be somewhat harder to implement because the grid requires standardised interconnections and the appliances are regulated in many ways. Prosumer co-creation happens most commonly by inviting user to take part in product design processes and by gathering information on user preferences related to temperatures, heating, bathing and showering. Some homeowners go further to
technical issues like modifying and designing technical details or posting results on online platforms. (Bleicher & Gross, 2015)
2.1.5 Innovation ecosystem
Gomes et al. (2016) define innovation ecosystems as “a set for the co-creation, or the jointly creation of value.” Adner (2006) describes them as “collaborative arrangements through which firms combine their individual offerings into a coherent, customer-facing solution.” They are composed of interconnected and interdependent networked actors, that include the focal firm, customers, suppliers, complementary innovators, advertisers finance providers, universities, research institutes, standardisation organisations, custom-ers and regulators.
The concept of an innovation ecosystem is replicated from biology. Essential aspect of ecosystems is that everything is interconnected and all actions have complex feedback loops to other species. Companies have to manage their innovation processes in complex environments where the success of a product is dependent on the success of other players too. Creation of value happens by offering it to the customer but also by sharing it with other ecosystem actors. (Iansiti & Levien, 2004) Using other companies’ resources and integrating to other companies form innovations that are hard to imitate. Company strat-egy should be formed so that the consequences on the whole ecosystem are analysed. Iansiti and Levien (2004) takes Yahoo, who controlled the internet ecosystem, as an ex-ample of a too aggressive ecosystem leader. By making tough deals with their dot-com partners, it weakened their profitability and in that way lost important players from the ecosystem they were dominating. As innovations depend often on the whole ecosystem, the first-mover position is challenging because of the uncertainty of external environment and players (Adner & Kapoor, 2010).
Different players have different strategies in the innovation ecosystems. Iansiti and Levien (2004) form a matrix of possible strategies (see figure 7). Role depends on the relationships to other companies and the turbulence of the environment. If the company shares many assets with other companies and operates in a turbulent environment, it should aim to take the keystone strategy. Leading the ecosystem means solving major technological problems and offering a stable technological framework and business op-portunities to other companies. The keystone company also determines the ‘design rules’ of the ecosystem by standardisation of modules and their connections (Mäkinen & Dedehayir, 2012). Common example is Google’s way of leading its ecosystem by gath-ering information of its by-products (Iyer & Davenport, 2008). If the environment is rel-atively stable and the market is mature but the company operates a complex network, it can take the role of a physical dominator. By that, the company aims to integrate vertically or horizontally and capture large part of the network. If the relations to suppliers and complementary firms are clear but the field is in flux, a niche position may be the strategy
to follow. In commodity strategy, the relations to other actors are less important. (Iansiti & Levien, 2004) Niche Keystone Value dominator Physical dominator Commodity Complexity of relationships Le ve lo ft ur bu le nc e an d in no va ti on
Figure 7.Roles in an innovation ecosystem (Iansiti & Levien, 2004).
Each company has its own customers, suppliers and complements depending on their position in the ecosystem. Figure 8 shows a simplification of the relationships a focal firm can have in an ecosystem. Being a complementor means having a product that enables customer to gain better value from focal firm’s product or service. The positions of the firms are not stable. Ecosystems evolve as the firms feed-off, support and interact with each other while offering services and products to each other. The co-evolution of them is best seen in ecosystems where complementors and component makers form their own sub-systems. Sub-systems have their own development phases that are controlled by the platform leader who connects the different sub-systems together. (Iansiti & Levien, 2004; Mäkinen & Dedehayir, 2012)
Figure 8. Generic schema of an innovation ecosystem (Adner & Kapoor, 2010).
Adner and Kapoor (2010) divide external environment’s challenges into complement and component challenges. If suppliers fail to adopt required components, the focal firm has a bottleneck in its ecosystem’s value chain. In the same way, if complementors fail to create complementing technologies, focal firm’s product is less valuable for the customer. These challenges are also a way to gain competitive advantage based on learning curves.
Solving technological problems within the ecosystem partners create processes that are hard to imitate.
Besides the endogenous factors, there are also exogenous factors that influence the inno-vation ecosystem development. These include social, economic and technological changes in the environment. Adner and Kapoor (2010) describe the importance of exter-nal actors on both sides of the supply side with the example of AirBus’ A380. This air-plane was so much larger than earlier air-plane models that it required timely cooperation and performance by airports, regulators and component suppliers. If the technological changes converge outside the focal firm’s ecosystem, the original ecosystem may broaden its scope to attain a part of the new development. The external development may also produce a competitive ecosystem, which attract module developers out from the earlier dominant ecosystem. (Mäkinen & Dedehayir, 2012)
2.1.6 Energy prosumer ecosystem
Ecosystem framework is relevant to the energy transition since it emphasises the connec-tions of every actor and the need for complementary innovaconnec-tions (Adner & Kapoor, 2010). Energy field is changing, as it is getting more and more integrated with the trans-portation and information and communication technologies (ICT) sectors. In addition, the energy field itself is in integration as heating and cooling technologies are being electri-fied and therefore more connected to other electrielectri-fied functions of the systems. (Canzler et al. 2017; Erlinghagen & Markard, 2012) The challenges electricity sector faces are in many ways the same for transportation and heating sectors, for example stranding assets, decarbonisation and changes in the distribution channels. The opportunities are also con-nected. By connecting EVs to the grid, it is possible to diminish grid congestions pro-duced by intermittent RESs. Combining offers of solar PV, storage and DR into a package can add capacity usage of whole system.
The ongoing energy transition can be described as a shift from this top-down supply system to a multi-level exchange system (Schleicher-Tappeser, 2012). The traditional grid system is formed of five components: energy source, generation, transmission, dis-tribution and end user (Richter, 2012; Rodríguez-Molina et al. 2014). It is characterised by centralised energy production, one-way communication, small amount of data and censors, manual control and only a few user choices. In the past, power generation units kept on growing for better efficiencies and economies-of -scale. Large number of cus-tomers made it easy to predict the demand and behaviour patterns. Distributed energy system, on the other hand, means distributed energy generation, two-way real-time com-munication and extensive control systems (Zame et al. 2017). It may also include loca-tional pricing (Schleicher-Tappeser, 2012).
The market functioning is formed by an innovation ecosystem built around prosumers’ DERs. Depending on the business context, the focal firm of the ecosystem may be the
solar PV installers, solar service firms or prefabricated home manufacturers (Strupeit & Palm, 2016). Complementors and suppliers depend on the focal firm and may not have been created yet. To reach the potential of the ecosystem, these interactions should de-velop and bottlenecks solved. Issues for these interactions between complements and components include:
∂ Smart meters and appliances are necessary for real time flexibility but replacing old meters require a functioning DR market. If there is no demand for smart me-ters, their diffusion is slower. (Knight, 2016, p. 8).
∂ Intermittent RES and big loads like EVs and heat pumps increase the need for flexibility in the system. If their diffusion stays low, need for DR stays smaller. These factors also create a saturation point for the DR market (Arteconi et al., 2016).
∂ Developing grid scale energy efficiency eats consumer DR market (Knight, 2016, p. 8).
∂ The profitability of batteries and DR is dependent on the deployment of the other (Pérez-Arriaga & Knitte, 2016, p. 40). DR is less incentivised when having in-vested to an energy storage.
The way the grid architecture will shape is also a political affair, since it will shape not only technological innovations but also power relations between different actors. More decentralised generation, distributed grid intelligence and active balancing in distribution network will change big utilities’ current strong position in the market. The incumbents have different approaches to the prosumer ecosystem. Some are resisting the change and shaping policies and regulatory framework to be supportive for their resources (Geels, 2014). In the energy transition, they build on their strengths like data ownership, pricing and relationships and partnerships (PwC, 2010, p. 28). Prosumer technology choices are highlighted on the distribution system level, where new investments have traditionally been done according to the peak demand. Network operators’ customer contacts have been limited to the grid connection phase, disruption calls, metering and billing but now they are starting to manage different complex data sets. Now they face a new situation where the old business-as-usual model will lead to extent investments and new smart solutions are required to make the system sustainable (Pérez-Arriaga & Knitte, 2016, p. 46).
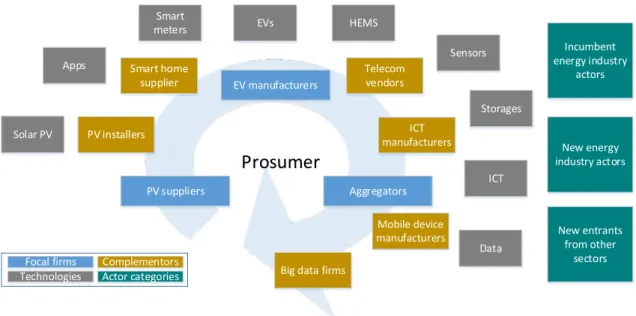
New entrants from other sectors like transportation, telecommunications and big data firms start to cooperate and compete in the energy regime (Canzler et al. 2017). They are interesting actors in the energy field that has long been seen as monopolistic industry (Daly, 2016). Usually they have less difficulties to adopt new technologies in disruptive changes (Adner & Kapoor, 2010). On the other hand, energy is still highly regulated field, which gives advantage to incumbents. New entrants may alter the strategic positions of the companies in the ecosystem that is illustrated in figure 9. Transportation sector with EVs is linked to prosumer ecosystem through smart charging, V2G business model and
battery infrastructure. EVs are now bigger investments than solar panels so they may be-come the physical dominators of the ecosystem (Rubel et al. 2017). Accordingly, devel-opment of battery manufacturing is currently an important piece of EV diffusion but af-fects also the solar PV industry.
Apps Storages ICT Smart home supplier EV manufacturers Smart meters HEMS Aggregators Sensors Solar PV Data EVs New entrants from other sectors New energy industry actors Mobile device manufacturers ICT manufacturers
Big data firms
Telecom vendors Prosumer Incumbent energy industry actors PV suppliers
Focal firms Complementors Actor categories Technologies
PV installers
Figure 9. Prosumer innovation ecosystem with technologies, focal firms and comple-ments (adapted from Kotilainen et al., 2016).
ICT sector, which is strongly entering the market, functions as an accelerator of the re-gime shift by enabling DR and aggregation (Markard & Erlinghagen, 2012). Aggregators can control and optimise the combinations of technologies can become the value domi-nators without owning much hardware themselves. They also handle interfaces to cus-tomer DERs and system operators. Sensors, applications, smart meters and other software based technologies form possibilities for niche strategies that have not existed in the en-ergy field in this extent. Design rules and standardisation face local solutions but offer also possibilities of leveraging the niche to bigger markets.
2.2 Policy interventions
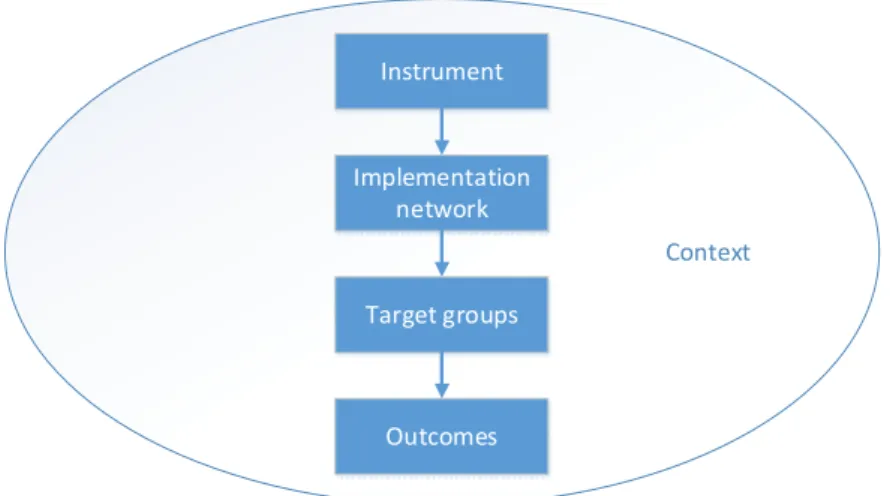
According to de Lovinfosse & Varone (2004), public policies are “intentionally coherent decisions or activities taken or carried out by public -and sometimes private- actors, whose resources, institutional links and interests vary.” Public policy aims at channelling the behaviour of a target population by the help of public effort to solve the decided prob-lems. Policies can be rules or otherwise influencing mechanisms, which impose obliga-tions, create incentives or build up capacity of the target group. Incentives are defined as: “Rewards or penalties designed to induce one set of economic agents to act in such a way as to produce results that another economic agent wants” (Black et al., 2017). The policy design can be broken down into four elements that are shown in figure 10 (Sorrell et al., 2003).
Context Instrument Implementation network Target groups Outcomes
Figure 10.Policy design elements (Sorrell et al., 2003).
Instrument is a new legislation, law, regulation or an initiative in order to achieve a certain objective. Implementation network includes private and public actors who have to be mo-bilised to implement the policy. In a multi-level policy context like the EU, the interme-diaries, like National Regulatory Agencies (NRAs) between different levels play im-portant role. Target groups are individuals or organisation that the policy influences di-rectly or indidi-rectly. Outcomes and objectives are the effects the policies are desired to have. In most cases there are several objectives and different stakeholders see them in different ways. Outcome is determined by the analysed potential change to the current situation the policy can create. For example, cost-benefit analyses are essential but often challenging to implement. The context of the policy includes economic, political and cul-tural factors that create circumstances and impose constraints for it. (Sorrell et al., 2003) Success of the policy design depends on many details of the instruments (Mir-Artigues & del Río, 2016, pp.275-276). Some elements are instrument-specific but some are com-mon for all instruments. In energy field, eligibility of old plants, location specific support, duration of the support and the flexibility of the support level are important risk factors for investors. These elements can steer investments and whole system towards either cen-tralisation or decencen-tralisation. In addition, the way support costs are burdened has an ef-fect on overall electricity price. Rogge and Rechardt (2013, pp. 13-15) add also more general features to policy design: stringency, level of support, predictability, flexibility, differentiations and depth.
Measuring policy success is a subject that has been researched a lot but has not been fully answered. The criteria of a good policy intervention is context specific and depends on the sector company size, level of implementation and incentive design (Rademaekers et al., 2012, p. 93). For example, transportation policy interventions are evaluated regarding emission and pollution differences, health outcomes and alternative policies and technol-ogies and even knowledge spill overs (Deshazo et al. 2017, p.20). In the field of RE, the indicators are effectiveness, efficiency, equity, institutional feasibility and replicability (IRENA, 2012). According to Jaffe et al. (2005, p. 170) innovation policy’s success is
uncertain and difficult to measure and is often not quantitatively measured. Ex-ante meas-urements are especially difficult in long periods like in the case of climate mitigation. However, general principles can be given. Following list is modified from Rademaekers et al.'s list (2012, p. 11) company strategies in mind. Incentives should
∂ work in long-term but also supporting near-term investments,
∂ affect firms’ profitability and competitiveness,
∂ be transparent, simple and action orientated
∂ give pressure from supply chain (effective especially for small companies)
∂ linked to well-known programs like ISO certificates or common reporting schemes and
∂ provide support to qualify for incentives is important especially for SMEs. The broadening context of policies and interoperability of them is making the evaluation of policy mixes more difficult. Policy mixes include many political objectives but also many administrative domains, like transportation, environment, fiscal and climate poli-cies (Kivimaa et al., 2017). Borrás and Edquist (2013, p. 18-21) combine the policy in-struments to actions of Innovation System functions. Sorrell et al. (2003, p. 63) mention that policy mix approach creates a situation where success of one instrument is dependent on timing and the other instrument’s success. A multi-criteria analysis is usually con-ducted with a matrix with quantitative or qualitative analysis (Sorrell et al., 2003, pp. 24-25).
Multi-level governance
Multi-level governance in the EU context is defined as “system of continuous negotiation among nested governments at several territorial tiers – supranational, national, regional and local” (Hooghe & Marks, 2003). In public policy literature, the EU has brought up a new kind of theoretical aspects of division of governance, which is different from the one concerning independent nations, the United Nations and NATO, for example. The EU includes complex relations between governments and the cohesion and integration-driven policy. Subsidiarity is one of EU’s priorities meaning that decisions should be done as close as possible to the citizens as far as the objectives can be met in that way. The EU has a strong influence on the other levels of governance and may be used in questions that handle specific matters where multi-purpose national bodies are not working on. Nations have delegated some duties to the EU through different treaties with the Lisbon treaty being the most important one. Competences in the energy field are divided between the member states and the EU as stated in the Treaty of the EU and Treaty of Functioning of the EU and their amendments. The EU steers their policies through directives, guide-lines, research and funding and affect directly via energy saving standards and the emis-sion trading system (ETS). Different types of EU laws are treaties, regulations, directives, decisions, recommendations and Commission communications (Lane, 2015). (Bommel & Bregman, 2013; SGTF, 2013)
Member states can decide their own energy mixes, support schemes and taxing of energy but they have to follow the EU directives. Also bilateral energy relations outside the EU belong to member state competencies (European Commission, 2012). The interpretation and implementation of different EU regulations may differ between countries. Many path dependencies like earlier investments and cultural habits shape the regional implementa-tion. For example, Scandinavia has traditions of consensus-driven policy and strong leg-islation whereas in southern Europe informal connections are important. In addition, some countries give more legal and administrative power to regions than others do. The importance of regional level can vary from being a federal state to a sole administrative level to a uniform state. Meanwhile part of the national power has been shifted to Brus-sels, in some cases the regional power has increased. This is the case especially in regions with strong lobbying power. (Keskitalo, 2010)
2.2.1 Industrial policy approach
Industrial policy has many different definitions depending on the country and time. Often industrial policy is pursued through many policy instruments, like infrastructure provi-sion, public procurement and defence an employment protection. Because of this vague-ness, industrial policy has not clear taxonomy (Warwick, 2013, p. 17). However, through-out the different definitions and rationales, the goal of industrial policy is competitive-ness, economic growth and productivity growth (Aiginger, 2007, p. 320). It is also a way of solving problems in certain industries and allocating resources to macro economically important fields. In this thesis, the widely used definition of Pack & Saggi (2006) for industrial policy is adopted: “Industrial policy is any type of selective intervention or government policy that attempts to alter the structure of production toward sectors that are expected to offer better prospects for economic growth than would occur in the ab-sence of such intervention.”
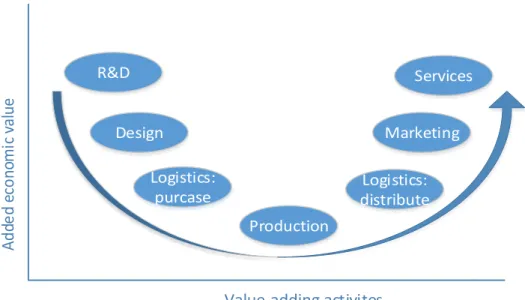
Important aspect in strategic industrial policies nowadays comes from the internationali-sation of manufacturing process and the shift to service-based business of many industrial manufacturers (Warwick, 2013, p.11). These trends lead to thinking of value chain posi-tioning which is illustrated in figure 11. As labour costs in industrialised countries have increased, firms aim to cover the parts of the value chain that require more educational workforce and in general use more human rather than natural capital. Automation is yet again changing this landscape as companies are relocating the production due to decreas-ing importance of labour costs.
Ad de d ec on om ic va lu e Value-adding activites R&D Logistics: purcase Production Design Logistics: distribute Marketing Services
Figure 11. Economic value of activities in a traditional value chain (modified from Warwick, 2013, p.12).
One approach is targeting certain sectors in attempt to create “strategic industries” with industry-specific interventions, subsidies or trade barriers. Weiss (2011) describes this kind of technology-specific activity as ‘promotional’ approach. This strategy was clearly seen in the traditional approach of industrial policy, where governments gave subsidies or other state aid to mainly domestic manufacturing industry (Warwick, 2013, p. 29). There is no lack of arguments against such policies. Economists warn politicians of inef-ficiencies that comes from picking winners, policies are prone for corruption and interna-tional rules leave little space for nainterna-tional policy interventions (Rodrik, 2004, pp.36-37). However, there are reasons for adopting such technology-specific policies. They are often popular because they disperse the costs of focused benefits (Jaffe et al., 2005, p. 169). Some authors also claim that they are needed for creating sustained knowledge, market distortions avoidance and path dependency (Groba & Breitschopf, 2013, p. 16). Weiss (2011, p. 3) note the need for subsidising risk-taking activities. Nowadays, the attempt in sectoral policy is to help infant industries to gain access to financial markets and certain economies-of-scale by clustering policies (Aiginger, 2007, p. 316).
Opposite of sectoral policies are horizontal measures that are set to improve business conditions in general. Weiss (2011, pp. 3-4) describes this kind of activity as market-based approach. Governments may aim to facilitate and creating supportive framework for business by correcting externalities, providing information and infrastructure. Strate-gic trade policy through subsidies is another way of supporting industries (Warwick,
2013, p. 21). If two exporting countries compete on the same markets, either one of them or both may give subsidies to the exporting industry for winning the trade deals.
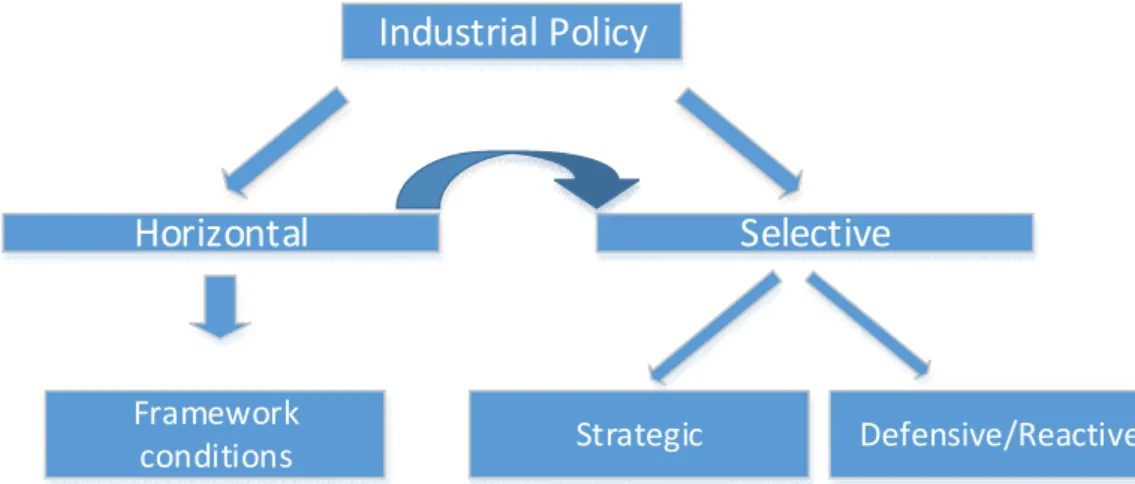
Industrial Policy
Selective
Horizontal
Framework
conditions Strategic Defensive/Reactive
Figure 12.Typology of industrial policies (modified from Warwick, 2013).
Another way of categorising industrial policies is by the orientation towards technological and societal changes. In other words, industrial policy may be defensive and reactive towards landcape changes to protect workplaces. Some policies prevent industries of dying for political reasons. For example, automotive industry got a lot of subisdies in the USA after 2008-2009 financial crisis. Other policies promote change through inducing innovation, new entrants, spoinoffs and new capbilities. Warwick (2013) also divides the selective policies into strategic domains or technologies in which country should focus and create competitive advantage.
2.2.2 Innovation policy approach
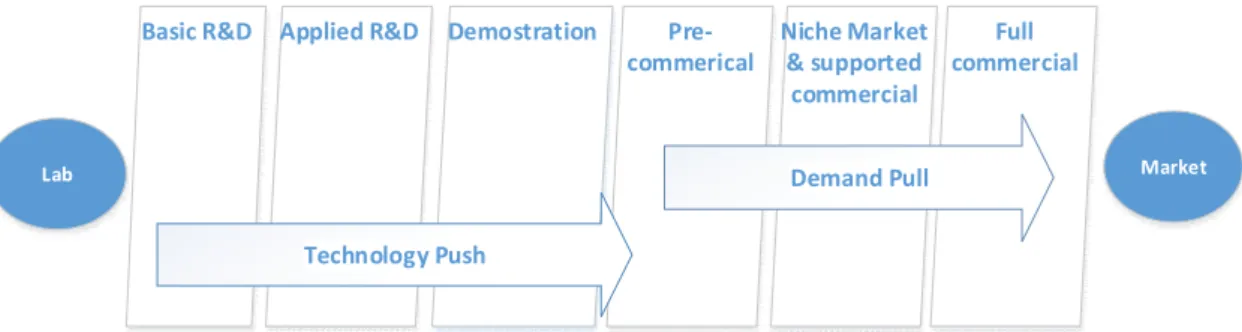
National innovation and technology policy aims to create national competitive advantages and productivity growth. It creates preconditions and framework for generating inven-tions and supports research and knowledge creation. National innovation strategies iden-tify fields where country has potential to thrive economically and socially. (Meissner, 2014) It includes wide range of activities, which depend on the country and its techno-logical development. It covers many areas from intellectual property rights to support for new business and policy on basic research. Meaning of technology and innovation policy depends on country’s development and priorities. More developed countries aim to be on the cutting edge of innovation whereas less developed countries aim to facilitate the adop-tion of innovaadop-tions from abroad. In general, there has been a shift from R&D policies towards markets and commercialisation of innovations. It means that technology and in-novation policy definition has widened to cover the whole inin-novation diffusion process and markets have gained more attention.