Correlation analysis of
subcellular ATP dynamics and
changes in cellular morphology
February 2018
Correlation analysis of
subcellular ATP dynamics and
changes in cellular morphology
February 2018
Graduate School of Science and Technology
Keio University
i
1.1 Background of this study ... 1
Significance of focusing on cellular morphological change ... 1
Relevance of ATP to cellular morphological change ... 1
Unsolved problem: physiological and local ATP behavior ... 2
Reasons for lack of studies on physiological and local ATP behavior ... 3
Innovation of a genetic ATP sensor for physiological and local ATP behavior ... 3
Additional work needed to investigate physiological and local ATP behavior ... 4
1.2 Purpose of this study ... 6
2. Chapter 2: Correlation analysis between local ATP dynamics and cellular morphological change ... 7
2.1 Introduction ... 7
2.2 Results ... 9
Inhibition of cytoskeletal dynamics increases local ATP ... 9
Cell edge has two marginal structures ... 13
Cell shape change by microtubule accompanying ATP increase ... 15
Cytoskeletons participate in change in morphology and ATP ... 19
2.3 Discussion ... 22
2.4 Materials and Methods ... 24
Materials ... 24
Plasmid construction ... 24
Cell culture ... 24
Transient transfection ... 24
Fluorescence microscopy ... 24
Image processing and analysis ... 26
Statistical Analysis ... 31
3. Chapter 3: Correlation analysis between membrane potential and ATP of mitochondria and axonal elongation ... 32
3.1 Introduction ... 32
3.2 Results ... 35
ii
ATPmito in GCs are involved in axonal elongation and GC morphological change ... 45
Actin turnover is one processes related to neuronal ATP dynamics ... 51
Correlation between ATPmito and IMPmito ... 52
3.3 Discussion ... 55
3.4 Materials and Methods ... 59
Experimental design... 59
Plasmid... 59
Cell culture ... 59
Measurement of ATPmito using mitAT1.03 ... 60
Measurement of IMPmito using TMRE ... 60
Fluorescence microscopy ... 61
Image processing and analysis of mitochondrial behavior ... 64
Unmixing processing ... 67
Image processing and analysis of neuronal behavior ... 67
Distinguishing transport categories ... 68
Analysis of fusion and fission events ... 68
Visualizing the correlation between ATPmito levels and IMPmito ... 69
Correlation analysis and random shuffling ... 69
Comparison of mitochondrial properties in the GC and axonal process ... 69
Inhibitor experiments ... 69
Quantification of morphological change in growth cone ... 70
Imaging of cytosolic ATP level ... 70
Statistical analysis ... 70
4. Chapter 4: Conclusion ... 71
4.1 Summary... 71
4.2 Significance ... 75
4.3 Features and advantages of this approach ... 77
Analysis without artificial intervention ... 77
Analysis without extreme conditions ... 77
Analysis without prior identification of analytical targets ... 77
iii
List of published papers and conference presentations ... 84
1
1. Chapter 1
Introduction
1.1 Background of this study
Significance of focusing on cellular morphological change
Each cell has its own morphology, which is thought to be related to its function (Lamprecht and LeDoux, 2004; Yuste and Bonhoeffer, 2001), therefore, appropriate morphology is crucial for cells. Since morphology and function are closely related, irregular morphological dynamics are thought to be harmful for proper cellular function. In fact, some neurodegenerative diseases have been shown to accompany damaged cellular morphology (Dubey et al., 2015; Plucińska et al., 2012; Takihara et al., 2015; Wang et al., 2016).
Relevance of ATP to cellular morphological change
Adenosine triphosphate (ATP) is one factor that may be related to morphological dynamics (Bernstein and Bamburg, 2003; Fukumitsu et al., 2015; Oruganty-Das et al., 2012; Rangaraju et al., 2014; Spillane et al., 2013). In special neurons, the Purkinje cells, inhibition of mitochondrial delivery results in low ATP levels at the edges of dendrites, as well as in reduced actin dynamics (Fukumitsu et al., 2015). Hippocampal neurons lacking cytoplasmic polyadenylation element binding protein 1 (CPEB1) exhibit mitochondrial dysfunction and reduced ATP levels, resulting in defective dendrite morphogenesis (Oruganty-Das et al., 2012). As with other ATP-related morphological changes in the neuronal spines, neuronal activity is known to enhance ATP consumption (Attwell and Laughlin, 2001; Harris et al., 2012; Rangaraju et al., 2014). Recycling of synaptic vesicles requires a large amount of ATP, which may be because of the dynamin that mediates membrane fission (Rangaraju et al., 2014). These local morphological changes have also been reported in other cell types. In tumor cells, increased cell motility and invasion induced by phosphatidylinositol 3-kinase (PI3K)
2
activity accompanies redistribution of their mitochondria to the cortical cytoskeleton (Caino et al., 2015). In endothelial cells, the lamellipodia (structures localized in
leading-membrane ruffles and rich in actin) contain several small regions in which ATP levels are relatively high (De Bock et al., 2013).
Unsolved problem: physiological and local ATP behavior
However, these previous findings are mainly based on perturbations of energy metabolism, and ATP dynamics and their relevance to morphological change under physiological conditions are still poorly understood. Although some studies have
monitored intracellular ATP levels, they mostly measured changes in response to strong stimuli that induced extensive intracellular changes in ATP levels (Fukumitsu et al., 2015; Oruganty-Das et al., 2012; Rangaraju et al., 2014). Cellular ATP dynamics under normal physiological conditions are thus not yet well understood.
In addition, there is a lack of research focused on local ATP dynamics. Some cellular biophysical and/or biochemical processes, such as the synthesis of new proteins, the reorganization of cytoskeletons, and the functioning of ATP/GTPase, require ATP during cellular morphological change (Ataullakhanov and Vitvitsky, 2002; Hara and Kondo, 2015; Rolfe and Brown, 1997). However, previous findings suggest that the one that requires the most ATP is actin turnover. One estimate suggested that this process is responsible for 50% of the ATP turnover in platelets (Daniel et al., 1986). Since actin localizes heterogeneously within a cell, fluctuation in ATP levels related to actin dynamics may also not be uniform throughout the cell. Furthermore, in general, activeness of cellular morphological change are also not uniform within a cell; in most cases, the peripheral areas of the cell show higher activity than the areas near the center of the cell body (Caino et al., 2015; De Bock et al., 2013). Therefore, local ATP levels should be considered when investigating the relationship between ATP and
morphological change. However, most previous studies have estimated ATP levels as average values for whole cells (Connolly et al., 2014; Dalton et al., 2014; Surin et al.,
3
2012; Tanaka et al., 2014), and the intracellular varieties of distribution and dynamics of ATP are as yet unknown.
Reasons for lack of studies on physiological and local ATP behavior
It is likely that one of the reasons for this lack of research into physiological and local ATP behavior is that it is not possible to perform sufficiently high-resolution
spatiotemporal quantification under physiological conditions using conventional ATP-measuring methods. One of the conventional methods, 31P nuclear magnetic resonance
(NMR), requires cellular lysate, i.e., cellular spatial information is lost. Monitoring temporal changes within a cell is also impossible using this method (McLaughlin et al., 1979). Another conventional approach, the luciferase assay, requires a large excess quantity of the enzyme to quantitatively measure the change in ATP levels (Strehler and McElroy, 1957); it does not therefore reflect normal physiological conditions.
Innovation of a genetic ATP sensor for physiological and local ATP behavior
In this context, a novel genetic ATP sensor (Imamura et al., 2009) has been developed to overcome these problems. This is a fluorescence resonance energy transfer (FRET)-based indicator, and is composed of the epsilon subunit of the FoF1-ATP synthase
sandwiched between cyan- and yellow-fluorescent proteins. FRET is a phenomenon that occurs between donor and acceptor molecules. When the emission spectrum of a donor overlaps the absorption spectrum of an acceptor, the energy of the excited donor is transferred to the acceptor. This occurs when the two molecules are in close proximity, although the extent of the spectral overlap between donor and acceptor, as well as their orientation, affects the efficiency of the FRET. The epsilon subunit largely changes its morphology into a folded form upon ATP binding, which is relaxed in the absence of ATP. As result, the change in ATP levels can be estimated based on the change in FRET signal (Imamura et al., 2009). Because this sensor is genetically encoded, time-lapse imaging with a high spatiotemporal resolution within living cells should be possible.
4
Additional work needed to investigate physiological and local ATP behavior
Nevertheless, there are only a few studies that have explored physiological or local ATP dynamics. Considering that ATP estimation using averaged whole-cell values (Connolly et al., 2014; Dalton et al., 2014; Nakano et al., 2011; Surin et al., 2012; Tanaka et al., 2014), and observation of ATP change in response to extensive stimuli (Connolly et al., 2014; Surin et al., 2012; Tanaka et al., 2014) have been conducted using the genetic ATP sensor, the remaining challenges for investigating physiological or local ATP behavior appear to be related to developing appropriate analyses. For instance, since cell morphology changes dynamically at cell edges, quantifying local ATP dynamics in such areas requires image-processing analysis that is able to track changes in cellular
morphology. Moreover, in general, change in ATP levels without extensive stimulation is subtle; therefore, a suitably sensitive procedure is needed to evaluate this change.
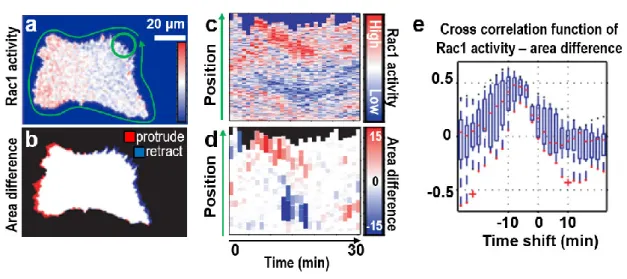
However, recently, several bio-imaging studies have succeeded in demonstrating relationships among biological signals collected from simultaneous fluorescence imaging under physiological conditions (Kobayashi et al., 2013; Tsukada et al., 2008; Zawistowski et al., 2013). Common to all of them is a combination of spatiotemporal image processing and cross-correlation analysis. Tsukada et al. conducted a correlation analysis between Ras-related C3 botulinum toxin substrate 1 (Rac1) activity and cellular morphological change and found a positive correlation (Fig. 1-1) (Tsukada et al., 2008). Zawistowski et al. reported a correlation-analysis between the protrusion velocity of the cell edge and eitherRas homolog family member A (RhoA) or Ras homolog family member C (RhoC) activity (Zawistowski et al., 2013). They showed that RhoA and RhoC are differentially regulated in cell protrusions, with distinct kinetics in several areas, which are defined by their distance from the cell edge (Fig. 1-2). Both studies involved extensive image-processing analysis after simultaneous fluorescence imaging, followed by an evaluation of the signals using cross correlation analysis. This approach facilitates local quantification and exploratory correlation analysis, and also appears to be useful for the study of physiological and local ATP behavior.
5
Figure 1-1. Cross correlation analysis between Rac1 activity and change in cellular area.
(a, b) Pseudo-color visualization of (a) Rac1 activity and (b) change in cellular area. (c, d) Corresponding heat maps for (c) panel a and (d) panel b. (e) Cross correlation between Rac1 activity and change in area. Source: © 2008 Tsukada et al., adapted.
Figure 1-2. Cross correlation analysis between RhoA activity and protrusion velocity.
(a) Pseudo-color visualization of RhoA activity. (b) Protrusion velocities of cell edges represented by green lines. (c) Cross correlation between RhoA activity and protrusion velocity. Black: 0–0.9 µm, blue: 0.9–1.9 µm, green: 1.9–2.8 µm, pink: 2.8–3.7 µm, brown: 3.7–4.6 µm from the cell edge. A similar analysis was also conducted for RhoC. Source: © 2013 Zawistowski et al., adapted.
6
1.2 Purpose of this study
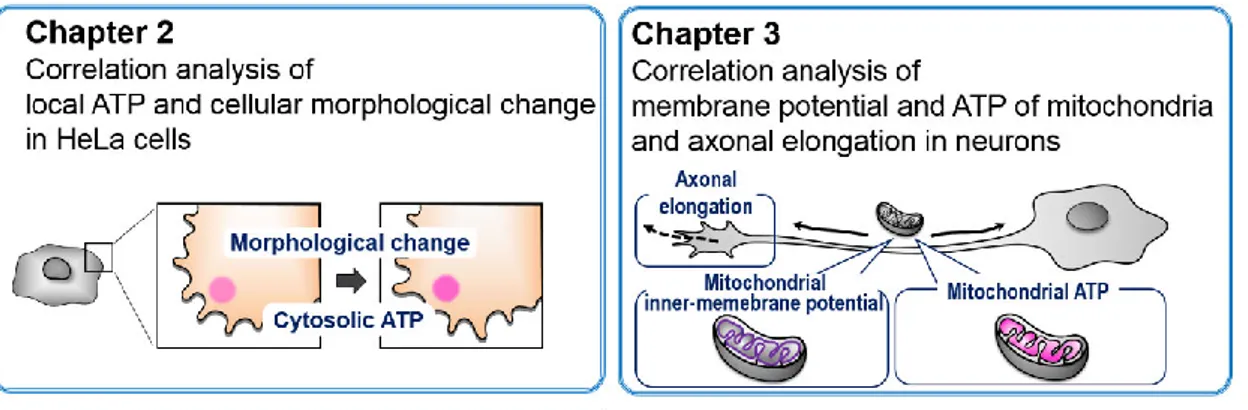
As mentioned above, although local cellular ATP dynamics seem to be important and related to local morphological changes, no studies have yet demonstrated this under physiological conditions. However, I hypothesized that this could be done by combining the genetic ATP sensor with image processing and correlation analysis. In this context, the purpose of this study is to visualize physiological ATP dynamics and to explore how these relate to cellular morphological change in HeLa cells (Chapter 2) and in neurons (Chapter 3), using ATP imaging, image processing, and correlation analysis (Fig. 1-3).
Figure 1-3. Overview of this study.
(left) Chapter 2 reports on a cross correlation analysis between cytosolic ATP dynamics and cellular morphological change in HeLa cells. (right) Chapter 3 reports on a cross correlation analysis between mitochondrial activity (inner-membrane potential and ATP levels in the mitochondrial matrix) and axonal elongation in neurons.
7
2. Chapter 2
Correlation analysis between local ATP dynamics and cellular
morphological change
2.1 Introduction
Adenosine triphosphate (ATP) is a major energy source for cells, and is used in muscle contraction (Cain and Davies, 1962), neuronal activity (Harris et al., 2012), organ development (Massé et al., 2007), and many other physiological phenomena.
Investigations into intracellular ATP levels have been limited, mostly centered on how they change in responses to 2-deoxyglucose (2-DG) or glucose, which perturb energy metabolism (Ainscow and Rutter, 2002; Surin et al., 2012; Tanaka et al., 2014), and during hypoxia or excitotoxicity (Connolly et al., 2014; Kioka et al., 2014; Toloe et al., 2014). The nature of ATP fluctuation in living cells under normal and physiological conditions is still largely unknown.
ATP-related cellular and subcellular phenomena include cytoskeletal dynamics (Bernstein and Bamburg, 2003) and cellular morphological changes (De Bock et al., 2013; Oruganty-Das et al., 2012; Rangaraju et al., 2014). In chick ciliary neurons, ATP depletion suppresses actin turn-over and long-term ATP depletion causes changes in cellular shape (Bernstein and Bamburg, 2003). Hippocampal neurons lacking
cytoplasmic polyadenylation element binding protein 1 (CPEB1) have brain-specific dysfunctional mitochondria and reduced ATP levels, which result in defective dendrite morphogenesis (Oruganty-Das et al., 2012). Also, in neuronal spines, neuronal activity increases ATP consumption. Synaptic vesicle recycling presents a large ATP burden, which may be because of dynamin that mediates membrane fission (Rangaraju et al., 2014). These previous reports indicate that variation in ATP levels is related to cellular morphological changes and cytoskeletal dynamics.
8
To demonstrate the presence of a direct relationship under physiological conditions, precise and simultaneous observation of ATP levels and either cellular morphology or cytoskeletal dynamics is necessary. This has been difficult because conventional ATP quantification methods do not allow for high-resolution observation (Imamura et al., 2009). Although the technical development of the novel genetic ATP sensor ATeam enabled such observations (Imamura et al., 2009), finding the relationships is still not easy, because, in general, fluctuation in biological signals without extensive stimulation is subtle and occurs over a narrow range. Despite this technical challenge, we recently successfully investigated the relationship between the motility of the growth cone and the crosstalk of second messengers through a combination of simultaneous imaging with spatiotemporal image processing analysis (Kobayashi et al., 2013).
In this study, we combined simultaneous imaging with detailed analysis to reveal the relationships between cytoskeletal dynamics, morphological change, and ATP level change. We conducted several kinds of simultaneous imaging using ATeam, an indicator for microtubule dynamics that used fluorescent-labeled EB3 (end-binding protein 3) (Matov et al., 2010; Morrison et al., 2002; Stepanova et al., 2003),
fluorescent-labeled actin, and fluorescent dye for the plasma membrane (FM4-64) in HeLa cells. We quantified the spatiotemporal behavior of the cells using our original image processing software, and revealed that cytoskeletal dynamics at the cell edge are related to cellular morphology and intracellular ATP levels, and that actin and
9
2.2 Results
Inhibition of cytoskeletal dynamics increases local ATP
Our goal was to reveal the relationships between change in intracellular ATP levels, cytoskeletal dynamics, and morphological change in HeLa cells under physiological conditions. To verify whether these relationships exist, we first examined if the inhibition of cytoskeletal dynamics affect intracellular ATP levels. HeLa cells expressing ATeam were imaged under physiological conditions for 10 min, and
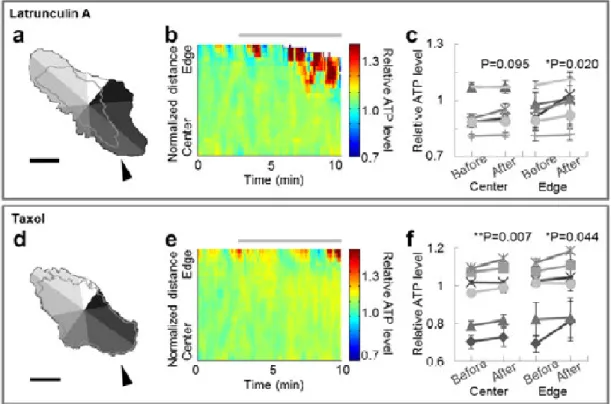
cytoskeletal dynamics were modulated by 100 nM Latrunculin A or 200 nM Taxol at 3 min. Latrunculin A binds with 1:1 stoichiometry to monomeric actin (Spector et al., 1999), sequesters monomers, and prevents their reassembly (Morton et al., 2000). Latrunculin A-treated cells are known to lose their focal adhesions and retract (Wang et al., 2005). Taxol specifically binds to and stabilizes microtubules (Downing, 2000). Application of Taxol completely abolishes the binding of microtubule-associated proteins to the ends of growing microtubules (Stepanova et al., 2003), therefore disrupting microtubule dynamics (Matov et al., 2010). As expected, Latrunculin A caused retraction in 8/8 cells (Fig. 2-1a). 6/7 Taxol-treated cells also showed
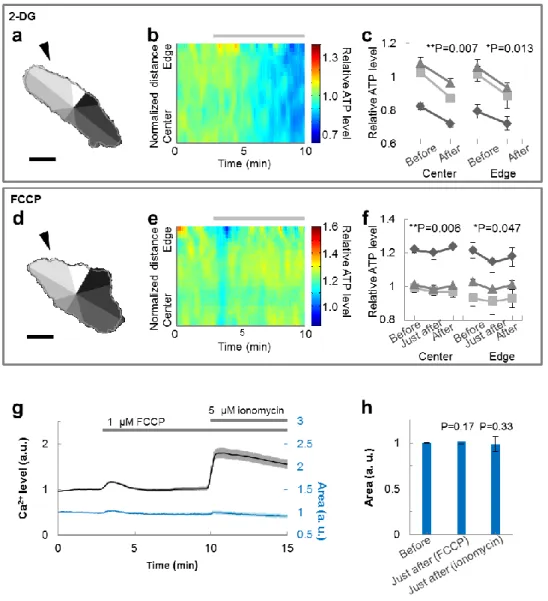
morphological change (Fig. 2-1d). Because the degree of retraction differed by location, we separated each cell into 8 compartments (Fig. 2-1a, d), and quantified spatiotemporal ATP levels and cellular morphology within each compartment (Fig. 2-1b, e). Statistical analysis revealed that cells treated with Latrunculin A showed ATP levels that were increased only at the edge part, while Taxol-treated cells exhibited increased ATP levels at both the central and the edge parts (Fig. 2-1c, f). On the other hand, 10 mM 2-DG (in 3/3 cells) and 1 µM FCCP (carbonyl cyanide-p-trifluoromethoxyphenylhydrazone, in 3/3 cells), which suppress ATP production, lowered relative ATP levels throughout the cell without any place dependency (Fig. 2-2). FCCP is a protonophore, which is known to cause calcium leak from mitochondria, so the leaked calcium might have influences on the cytoskeleton or ATP levels. We also confirmed that FCCP increased calcium levels (Fig. 2-2g), although neither FCCP nor ionomycin, which causes a larger calcium leak than FCCP, induced significant changes in morphology in the cellular areas
examined (Fig. 2-2g, h). From the above, the results suggest cytoskeletal dynamics are related to change in ATP levels, especially at the cell edge. Moreover, the influence
10
upon cellular morphology and ATP levels differs depending on whether actin or microtubule dynamics are involved.
Figure 2-1.Inhibition of cytoskeletal dynamics induces an increase in local ATP.
(a, d) Typical images of the cellular morphology at the beginning of the observation. The gray-shaded regions represent 8 automatically divided compartments, while the gray line depicts the cellular morphology at the end of the observation. Scale bar represents 30 µm. (b, e) Typical image of the spatiotemporal behavior of intracellular relative ATP levels in the compartment indicated by the arrowhead in the left figure. The horizontal axis indicates time, the vertical axis indicates position, and pseudo color indicates relative ATP level. Each color lookup table is linear and covers the full range of the data. The gray bar indicates the duration of inhibition. (c, f) Comparisons of relative ATP level before and after inhibition at the central and edge parts. When cells were treated with Latrunculin A, relative ATP level increased only at the edge (n = 6). On the other hand, Taxol-treated cells showed an increase in relative ATP level at both the central and the edge parts (n = 6). Error bar represents standard deviation (SD).
11
Figure 2-2. Reduction of ATP levels throughout the cell from the inhibition of ATP synthesis.
(a, d) Typical images of the cellular morphology at the beginning of the observation. The gray-shaded regions represent 8 automatically divided compartments, while the gray line depicts the cellular morphology at the end of the observation. Scale bar represents 30 µm. (b, e) Typical images of the spatiotemporal behavior of intracellular relative ATP levels in the compartment indicated by the arrowhead in the left figure. The horizontal axis indicates time, the vertical axis indicates position, and the pseudo color indicates the ATP level. Each color lookup table is linear and covers the full range of the data. The gray bar indicates the duration of inhibition. (c, f) Comparisons of ATP levels before and after the inhibition at the central and edge parts. When cells were treated with glycolysis inhibitor 2-DG, ATP levels decreased throughout the cell (n = 3). Mitochondria uncoupler carbonyl cyanide-p-trifluoromethoxyphenylhydrazone (FCCP)-treated cells showed reduced ATP levels just after inhibition but then
12
(g) Changes in cytosolic calcium levels (black, left axis) and cell area (blue, right axis). Cells were loaded with Fluo-4 AM by incubation with 10 µM Fluo-4 AM with 0.02 w/v% F-127 for 30 min followed by a 15 min de-esterification period. FCCP (final 1 µM) was applied at 3 min and ionomycin (final 5 µM) was added at 10 min during the 15 min imaging. FCCP caused a slight transient increase in calcium levels (30 cells from 5 dishes). Error bar represents standard error of the mean (SEM). (h) Statistical evaluation of changes in cell area. Application of neither FCCP nor ionomycin induced a significant change in cell area (30 cells from 5 dishes). Error bar represents SEM.
13
Cell edge has two marginal structures
Cytoskeletal-dynamics-related changes in morphology and intracellular ATP levels were remarkable at the cell edge. We therefore focused the next stages of our research on the cell edge. We considered it necessary to visualize actin and microtubule
separately because their influence upon ATP levels and cell morphology were different. We first observed HeLa cells expressing EB3-Venus. EB3 is a protein which binds to the plus end of a microtubule during elongation growth, and fluorescent-labeled EB3 acts as an indicator for microtubule dynamics (Matov et al., 2010; Morrison et al., 2002; Stepanova et al., 2003). EB3-Venus was found not only at the plus ends of
microtubules, but also diffused throughout the cytosol (Fig. 2-3a). However, the fluorescent dye for the lipid bilayer, FM4-64, revealed that there is also the peripheral structure consisted of actin, which was not visualized by EB3-Venus (Fig. 2-3a, b). The region EB3-Venus diffused into is called the ‘lamella’ and the peripheral structures outside the lamella are called ‘fillopodia’ or ‘lamellipodia’ (Ladoux and Nicolas, 2012; Machacek and Danuser, 2006). Up to here, we have conceptually grouped these regions by the term ‘edge’, but we will now begin to consider them separately, calling them ‘lamella’ and ‘peripheral structure’, respectively.
14
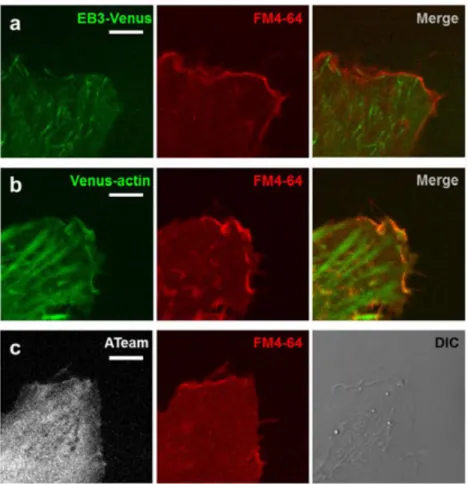
Figure 2-3. Structure at the cell edge: the lamella and the peripheral structure are distinguished.
(a) Typical EB3-Venus (left), FM4-64 (middle), and merged (right) images at the edge of a HeLa cell. EB3 probe diffused throughout the cytosol. (b) Typical Venus-actin (left), FM4-64 (middle), and merged (right) images at the edge of a HeLa cell. The peripheral structure of the cell edge is constructed of actin filaments. (c) Typical images of (mseCFP+mVenus) fluoresce of ATeam (left), FM4-64 (middle), and differential interference contrast (DIC; right) at the edge of a HeLa cell. The peripheral structure at the cell edge was detectable from the (mseCFP+mVenus) signal. Scale bar represents 5 µm.
15
Cell shape change by microtubule accompanying ATP increase
We explored whether these two layers were related through simultaneous observation of EB3-labeled microtubules and the peripheral structure visualized by FM4-64. These observations revealed that the peripheral structure showed high motility where the dynamics of EB3-labeled microtubule were active. This peripheral movement was suppressed by Taxol-induced inhibition of microtubule dynamics. As mentioned in many previous reports, disturbance of microtubule dynamics negatively affects actin dynamics and cellular morphology, which could be rescued by actin stabilization (Jaworski et al., 2009; Swiech et al., 2011), suggesting that microtubule dynamics are upstream of actin dynamics. Indeed, we found no obvious effects on microtubule dynamics in Latrunculin-A treated cells (Fig. 2-4). So, we focused on microtubule dynamics first, examining the relationships between microtubule dynamics and change in cellular morphology or ATP levels. In EB3-mCherry expressing cells under
physiological conditions, microtubules rushed into and touched the lamella boundary, changing the lamella shape (Fig. 2-5). Next, we observed HeLa cells co-expressing EB3-mCherry and ATeam to explore how these microtubule dynamics affect intracellular ATP levels. We chose the region of interest (ROI) at the cell edge, and acquired time-series data of EB3 density, the number of newly generated lamella areas, and relative ATP levels (Fig. 2-6a). We constructed a cross correlation function between newly generated lamella areas and EB3 density (Fig. 2-6b). Since a negative peak at 0 min is a result of parameter properties (as EB3 density is defined as the value of (EB3 positive pixel) / (cell area positive pixel), it decreases when the newly generated lamella area increases), we focused only on the positive peaks. There were three positive peaks at -7 min, -2.5 min and 3 min, suggesting that cross correlation analysis would be
required within 5 min. Then, we averaged the waveforms in the duration between before and after two minutes the timing of a peak in the number of newly generated lamella areas. This analysis showed that EB3 density increases about 1 min before the peak in newly generated lamella areas and that this area growth accompanies an increase in the relative ATP level (Fig. 2-6c, solid line). This increase was not obvious in the
calculations using randomly shuffled datasets (Fig. 2-6c, broken line). Moreover, inhibition of microtubule dynamics by Taxol reduced the number of EB3 particles and
16
EB3 contacts with the lamella boundary, therefore suppressing cellular morphological change that was obvious under physiological conditions (Fig. 2-4). From the above findings, microtubule rush appear to increase the lamella area at the cell edge and this increase involves a rise in ATP levels.
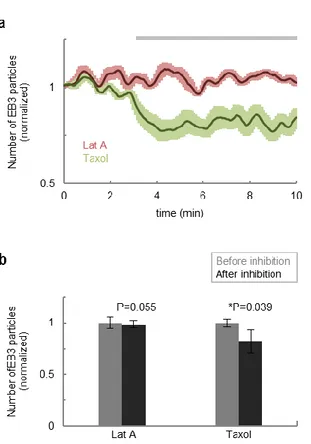
Figure 2-4. Taxolreduced the number of EB3 particles.
(a) Averaged time-course of the number of EB3 particles at the cell edge when cells were treated with Latrunculin A (n = 5) or Taxol (n = 5). The gray bar indicates the duration of inhibition. (b) Statistical analysis revealed the number of EB3 particles was reduced by Taxol, but not by Latrunculin A. Error bar represents SEM.
17
Figure 2-5. Microtubule dynamics cause HeLa cells to change shape.
(a) A typical image of the edge of a HeLa cell expressing EB3-mCherry. (b) Detected EB3 particles. Scale bar represents 5 µm. (c) Overlapped image of Fig. 5a and Fig. 2-5b. (d) Time-differential image of cell morphology. Red-colored pixels represent newly generated pixels. (e) Typical time courses of EB3 density (green) and the number of newly generated lamella areas (orange) within an ROI. (f) Cross correlation function between the number of newly generated lamella areas vs. EB3 density. Positive correlation was observed every 5 min (11 ROIs from 8 cells). (g) An average of waveforms in duration between before and after the timing when the number of newly generated lamella areas show peak (8 events from 8 cells). EB3 density increases about 1 to 2 min before the peak. No apparent peak was observed in the average of waveforms from randomly shuffled datasets (broken lines). Error bar represents SEM.
18
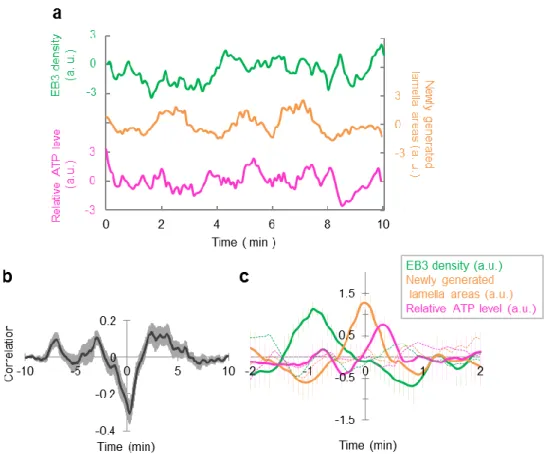
Figure 2-6. Microtubule dynamics cause a change in cell shape, which is accompanied by an increase in the ATP level at the cell edge.
(a) Typical time courses of EB3 density (green), the number of newly generated lamella areas (orange), and the relative ATP level (pink) within an ROI. (b) Cross correlation function between newly generated lamella areas vs. EB3 density. Positive correlations were observed at -7 min, -2.5 min, and 3 min (12 ROIs from 6 cells). (c) An average of waveforms in the duration between before and after the timing of a peak in the number of newly generated lamella areas (solid line, 9 ROIs from 6 cells). EB3 density
increased about 1 min before the peak and this increase in the lamella area accompanied an increase in the relative ATP level. No apparent peak was observed in the average of waveforms from randomly shuffled sequences (broken lines). Error bar represents SEM.
19
Cytoskeletons participate in change in morphology and ATP
We revealed that microtubule dynamics are not only associated with change in morphology and ATP levels at the lamella, but to motility of peripheral structure
consisting of actin. Actin requires ATP for polymerization, so we posited that ATP level changes observed in the lamella that is related to microtubule dynamics could be linked to the morphological change of the peripheral structure. We observed HeLa cells expressing ATeam with high spatial resolution, which enabled us to collect data on not only ATP levels but also the appearance of the peripheral structure (Fig. 2-3c). The lamella was assumed to correspond to the region 1–2 µm interior from the cell edge (Fig. 2-3), and exterior to this lamella region was defined as the peripheral structure. We set a small ROI at the cell edge where morphology dynamically changed, then estimated protrusion length of the peripheral region by measuring distance from the tip of the peripheral structure to the lamella. In addition, we calculated relative ATP level near the protrusion within the lamella and then plotted the time change of relative ATP level and protrusion length. The plot continuously varied within the range of ~0.7 relative ATP level and ~3 µm of protrusion length over 25 min (Fig. 2-7a, h), visualizing very intricate tracks. To investigate the origin of these complicated tracks, we applied Latrunculin A, Taxol, or 2-DG at 5 min and conducted the imaging for 15 min. Since the inhibitory effects of Latrunculin A, Taxol and 2-DG did not appear immediately after their application, and the time lags differed among cells, we analyzed the effect of the inhibitors on protrusion length and relative ATP levels in the last 5 min (pink-colored time period in Fig. 2-7a–d). We calculated the range of relative ATP levels and the protrusion length within the last 5 min as percentages of the total 15 min (Fig. 2-7e– j). In Latrunculin A-treated cells, the dynamic range of track distance was extremely narrow in the last 5 min. The tracks also converged at the point of a short protrusion length and a high relative ATP level (Fig. 2-7b, e, i, j). Time-lapse fluorescent imaging also showed that Latrunculin A treatment diminished the peripheral structural area. Therefore, Latrunculin A reduces the area of the actin-based structure, which could increase ATP levels. The dynamic range of relative ATP levels and the protrusion length of the tracks in the last 5 min decreased when cells were treated with Taxol (Fig. 2-7c, f, i, j). Time-lapse fluorescent imaging demonstrated that not only the peripheral
20
structure but also the lamella retracted, which is different from the morphological change caused by Latrunculin A. These observations suggest that Taxol treatment deprived cells of the changes in morphology and the ATP levels observed within the lamella, which resulted in a decrease in protrusion length. On the other hand, in cells treated with 2-DG, tracks in the last 5 min showed a drastic decrease in relative ATP levels as well as scanty cell edge motility (Fig. 2-7d, g, i, j). This suggests that ATP would be required for morphological changes. Taken together, these findings indicate that morphological change in the peripheral structure is associated with ATP level change, and while actin dynamics play a great role, microtubule dynamics are also related. We reasoned that these two kinds of influences upon ATP levels and cellular morphology could explain the complexity of the tracks. The tracks showed both right-handed and left-right-handed rotations and shifted between both rotations sequentially, indicating that ATP level is not always preferentially controlled over the protrusion length, nor vice versa. It could be reasonable to consider the complexity of the tracks is a consequence of the complex mixture of these two effects on ATP levels and
protrusion length. In summary, at the cell edge, morphological change in peripheral structure and ATP levels are affected primarily by actin dynamics, but also, weakly, by microtubule dynamics.
21
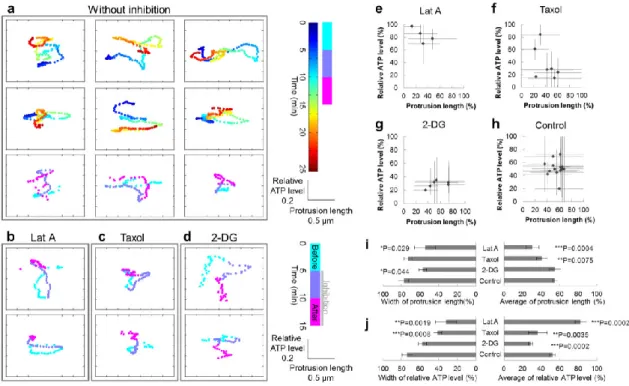
Figure 2-7. Both actin and microtubule dynamics affect cellular ATP levels at the cell edge.
(a) Typical tracks of protrusion length and ATP levels at the edges of HeLa cells under physiological conditions (9 examples from 5 cells). The horizontal axis indicates protrusion length, the vertical axis indicates relative ATP levels, and the pseudo color indicates time. (b–d) Typical tracks of HeLa cells treated with (b) Latrunculin A (left, 2 examples from 2 cells), (c) Taxol (middle, 2 examples from 2 cells), or (d) 2-DG (right, 2 examples from 2 cells). During the last 5 min of observation (pink), the tracks of Latrunculin A-treated cells lost their movement, while a reduced range of variation in relative ATP levels was observed in the tracks of Taxol-treated cells. Cells treated with 2-DG showed decreased motility as well as ATP levels. (e–h) Ranges of measured values in the last 5 min as percentages of the total timeframe. Markers indicate the mean values, while bars indicate the ranges. (i, j) Statistical analysis of (left) width and (right) average values of the ranges of (i) protrusion length and (j) relative ATP levels (4 ROIs from 2 cells for Latrunculin A, 7 ROIs from 3 cells for Taxol, 6 ROIs from 2 cells for 2-DG, and 15 ROIs from 6 cells for control).
22
2.3 Discussion
We conducted various simultaneous imaging and spatiotemporal analyses of
intracellular ATP levels, cytoskeletal dynamics, and cellular morphological change, and revealed striking correlations among them.
Actin dynamics are reportedly related to ATP levels (Bernstein and Bamburg, 2003) and we confirmed this assertion through experiments with Latrunculin A (Fig. 2-1a–c and Fig. 2-7b, e, i, j). Our results indicated that intracellular ATP level at the cell edge is influenced by not only actin dynamics but also microtubule dynamics. Although the effect of microtubule dynamics seemed less distinct than that of actin (Fig. 2-7b, c, e, f, i, j), a combination of simultaneous imaging and image processing analyses enabled us to demonstrate its presence.
Cultured hippocampal neurons derived from CPEB1 knock out (KO) mice showed a decrease in ATP production and fewer dendrite branches (Oruganty-Das et al., 2012). When these CPEB1 KO neurons were cultured in medium containing phosphocreatine for 4 days in vitro, ATP levels recovered to nearly wild type levels, as did dendritic branches. Although these results suggest ATP is important for neurite outgrowth and morphogenesis, the relevance between them were not asserted. This is because intracellular ATP levels and cell morphology were observed in different cells: that is, not coincidently. Our simultaneous imaging conducted here succeeded in directly showing that cytoskeletal dynamics induce changes in intracellular ATP levels and cellular morphology.
Several cellular mechanisms can produce spatiotemporal heterogeneity in ATP
distribution. The first mechanism is the localization and the level of production of ATP in mitochondria. In islet β cells, glucose treatment produces the microdomain of ATP beneath the plasma membrane, which is guessed because peripherally located
23
(Kennedy et al., 1999). Mitochondria were confirmed at the lamella in our experiments; hence, these peripheral mitochondria would produce spatiotemporal heterogeneity of ATP in HeLa cells. Another possible mechanism is the consumption of ATP by ATPase or cytoskeleton during morphological changes. As shown in Fig. 2-1b, c and Fig. 2-7b, e, i, j, ATP is consumed during actin polymerization. Additionally, since cellular morphological change accompanies the morphological change of cellular membrane, ATPase function during this process should be considered as well. For example, dynamin, known to be mainly active in membrane fission, has been discovered in various dynamic membrane structures, such as lamellipodia at the leading edge of moving cells (Buccione et al., 2004; Kruchten and McNiven, 2006). Besides dynamin, soluble N-ethylmaleimide-sensitive factor attached protein receptor (SNARE)-related proteins such as vesicle-associated membrane proteins (VAMPs) are also associated with cellular morphology in epithelial cells (Gierke and Wittmann, 2012). Being active events at the cell edge, actin dynamics and membrane morphological change could also result in ATP heterogeneity.
In summary, we explored the spatiotemporal behavior of HeLa cells in terms of ATP level change, cellular morphological change, and cytoskeletal dynamics under
physiological conditions. Simultaneous imaging and detailed image processing revealed that, at the cell edge, both actin dynamics and microtubule dynamics are inextricably tied to changes in intracellular ATP levels and cellular morphology.
24
2.4 Materials and Methods
Materials
FM4-64 was purchased from Invitrogen, Latrunculin A was from TOCRIS, and Taxol and 2-DG was from Sigma-Aldrich.
Plasmid construction
The ATeam 1.03 plasmid was kindly provided by Dr. Imamura (Kyoto University, Kyoto, Japan). EB3-mCherry and EB3-Venus were constructed in our laboratory. EB3 was derived from Human cDNA library and amplified using PCR. PCR products were digested with BamHI and NotI, and cloned into a pcDNA3.1(+) vector inserted into mCherry or Venus at NotI and XhoI sites.
Cell culture
HeLa cells were cultured in Dulbecco’s modified Eagle’s medium (DMEM, Invitrogen) supplemented with 10% FBS (NICHIREI BIOSCIENCE INC) and 1%
penicillin/streptomycin (Nacalai Tesque). Cells were maintained at 37 °C in a humidified atmosphere of 5% CO2. One to two days before transfection, cells were
plated at 1~2 ×10⁴ cells /cm3 onto a glass-based dish (IWAKI).
Transient transfection
Cells were transfected using lipofectamine LTX (Invitrogen), provided that construct concentrations were 1 µg/dish for ATeam, 0.5 µg/dish for EB3 probes, and 2 µg/dish for Venus-actin. After the transfection, medium was changed to Phenol red-free culture medium. Imaging was conducted 12–36 h after transfection.
Fluorescence microscopy
All fluorescent imaging experiments were performed using a confocal laser-scanning microscope (FV1000 IX81, OLYMPUS) with a ×100 oil immersion objective lens.
25
Furthermore, ×5 optical zoom was used to focus on the cell edge. FM4-64 (200 µg/mL) was applied 50–100 µL/dish before acquisition of the images.
In whole cell imaging, ATeam was excited by a diode laser (440 nm) through a dichroic mirror 405–440/515. The emitted fluorescence was separated by a 510 nm dichroic mirror, and signals from mseCFP and mVenus were observed at 460–500 nm and 515– 545 nm, respectively.
For simultaneous imaging of ATeam and EB3-mCherry, ATeam and mCherry were excited by the diode laser (440 nm) and a helium-neon laser (559 nm), respectively, through a beam splitter 20/80. The fluorescence was separated by dichroic mirrors (510 nm and 560 nm), and signals from mseCFP, mVenus, and mCherry were observed at 475–500 nm, 510–530 nm, and 575–675 nm, respectively.
In simultaneous imaging of EB3-Venus or actin-Venus and 64, Venus and FM4-64 were simultaneously excited by an argon (Ar) laser (515 nm) through a beam splitter 20/80. The emitted fluorescence was separated by a 560 nm dichroic mirror and signals from Venus and FM4-64 were observed at 535–545 nm and 620–720 nm, respectively. Images were acquired with a resolution of 640×640 pixels (actual size: 0.039 µm/pixel).
For simultaneous imaging of ATeam and FM4-64, these probes were excited by the diode laser (440 nm) and the Ar laser (515 nm), respectively, through the beam splitter 20/80. The emitted fluorescence was separated by dichroic mirrors (510 nm and 560 nm) and signals from mseCFP, mVenus, and FM4-64 were observed at 460–500 nm, 535–560 nm, and 610–710 nm, respectively. Images were acquired with a resolution of 640×640 pixels (actual size: 0.039 µm/pixel).
26
In whole-cell ATeam imaging and simultaneous imaging, images were acquired with a resolution of 320×320 pixels (actual size: 0.397 µm/pixel) every 5 sec. In
high-resolution ATeam imaging at the cell edge, images were acquired with a high-resolution of 640×640 pixels (actual size: 0.039 µm/pixel) every 10 sec. During imaging, cells were maintained at 37 °C using a stage heater (TOKAI HIT).
Image processing and analysis
Images were analyzed with our original software written and developed in Matlab (MathWorks). All images were median-filtered before the following steps:
Detection of cellular morphology: Median-filtered images were binarized and labeled.
Binarization was conducted by Otsu’s method using Matlab. The area with the largest number of pixels was determined to be the cell (pixels to be included in the cell are called ‘cell pixels’).
Relative ATP level calculation: Relative ATP level was determined by calculating pixel-by-pixel mVenus/mseCFP value (called ‘FRET value’ below). Outlier FRET values were removed.
EB3 particle detection: A kernel large enough to contain one EB3 particle was
prepared. The central pixel of the kernel was labeled 1 if the value of the pixel was more than (μ+σ), otherwise 0 (μ and σ refer to the average and the standard deviation of the intensities of the pixels within the kernel, respectively). Binarized images were labeled and the area with a sufficiently large size was designated as an EB3 particle. (Pixels included in an EB3 particle are called ‘EB3 pixels’ below.)
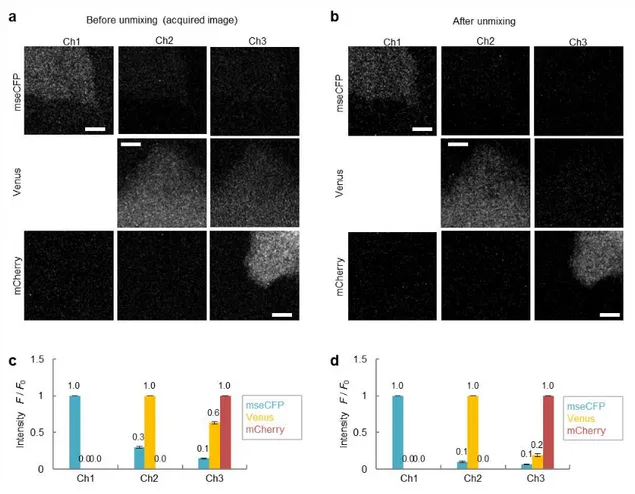
Unmixing processing: In analysis of simultaneous imaging, unmixing processing was conducted before calculating relative ATP levels or detecting EB3 particles. HeLa cells
27
expressing mseCFP, mVenus, or mCherry were prepared beforehand and any fluorescence leaked from one detection channel to another was measured for each permutation of channels under observation conditions. Then, a 3×3 matrix was derived by arranging the leakage values of each permutation. Intrinsic fluorescence was
calculated by multiplying observed fluorescence by the inverse matrix of the derived matrix (Fig. 2-8).
Figure 2-8. Unmixing processing.
(a, b) Typical fluorescent images of HeLa cells expressing mseCFP (upper), mVenus (middle), or mCherry (lower) acquired at Ch1 (475–500 nm), Ch2 (510–530 nm), and Ch3 (575–675 nm), before (a) and after (b) unmixing processing. Scale bar represents 5 µm. (c, d) The proportions of fluorescence consist each channels. Compared with before unmixing (c), leaked fluorescence was reduced after unmixing (d). Error bar represents SEM.
28
Whole cell analysis: The long axis, the short axis, and two straight lines 45 degrees to the long axis were set for cell morphology observed at t=0, by which the cell was sectioned into 8 compartments.
Analysis of the relationships among EB3 particle movements, cellular morphological changes, and relative ATP levels: Analysis was conducted within small, manually set ROIs at the cell edge where there are dynamic changes in morphology. EB3 density was calculated by dividing the number of EB3 pixels by the number of cell pixels. ATP level was the average of the FRET values of cell pixels. Cellular morphology at t=t was subtracted from that at t=t+1, and the remaining pixels were considered as a newly generated cell area. To analyze how relative ATP levels behave during microtubule-related increase in the lamella area, we drew Fig. 2-6c through the following steps. First, a time window (length: 4 min) was applied to a peak in the newly generated lamella area. Second, time periods that satisfied all of the following conditions were selected: i) the peak exceeds 𝜇+𝜎 (𝜇 and 𝜎 refer to the average and the standard deviation of the value within the time window, respectively); ii) the time window contains only one peak; iii) there is a peak in EB3 density before the peak in the newly generated lamella area; iv) the peak occurs 2 min after the start and 2 min before the end of the observation. The selected waveforms were normalized and then averaged.
Finally, Fig. 2-6c was generated by averaging the waveforms after applying 5 frames of moving average.
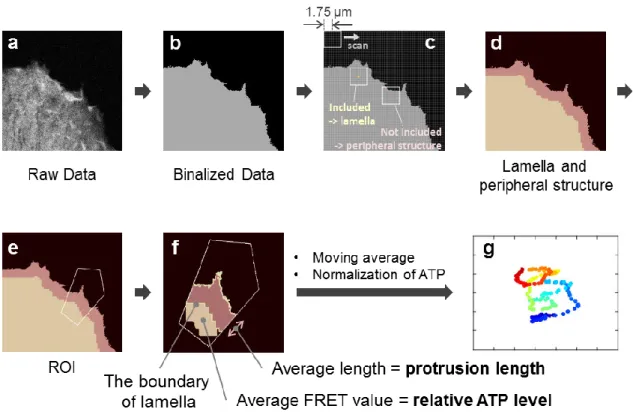
Evaluation of the relationship between protrusion length and relative ATP levels: Raw images were first processed with median filter and background subtraction. Next, we detected cell form from averaged images of mseCFP and mVenus. The lamella area was then determined by selecting a region where a square kernel (radius: 1.75 µm) could be completely contained, and the exterior region was defined as the peripheral structure (we selected 1.75 µm because the lamella appeared to be 2 µm inside of the boundary of the peripheral structure in our observation (Fig. 2-9c); although the peripheral structure estimated by this method appears larger than the real image (Fig. 2-3), we considered
29
that it would have no significant impact because the differences of protrusion length are presented in Fig. 2-7). We then set a small ROI (of the same size as was used in the analysis in Fig. 2-6) at the cell edge where there are dynamic changes in morphology. Protrusion length was estimated by averaging the length of the peripheral structure. Relative ATP levels were calculated by averaging the FRET value within the area that is 2 µm inside of the boundary of the lamella (Fig. 2-9f; we determined the region to be 2 µm inside of the boundary to avoid striking changes in the region size for calculating FRET values during changes in morphology). Finally, we applied moving average (3 min before and after for physiological conditions, and 1 min before and after for inhibitor-treated conditions) to the protrusion length and relative ATP levels, and plotted the values using pseudo color.
Random shuffling: Random sequences were generated by matlab function from acquired datasets. Order of each value was shuffled.
30
Figure 2-9.Evaluation of the relationship between protrusion length and relative ATP levels.
(a) Averaged image of mseCFP and mVenus. (b) Detected cell form. (c,d) Lamella area was determined by selecting a region where a square kernel (radius: 1.75 µm) could be completely contained, and exterior region was defined as the peripheral structure. (e) A small ROI was set at the cell edge where there are dynamic changes to morphology. (f) Protrusion length was estimated by averaging the length of the peripheral structure. Relative ATP levels were calculated by averaging the FRET value within the area that is 2 µm inside of the boundary of the lamella. (g) Moving averaged values of protrusion length and relative ATP levels were plotted with pseudo color.
31
Statistical Analysis
To compare the relative ATP levels from before and after inhibition of cytoskeletal dynamics at the center and edge parts of the cell, we averaged the values of the 3rd–23rd
pictures (15 seconds–115 seconds from the onset of observation) and that of the 97th–
117th pictures (365 seconds–465 seconds from the inhibition). In Fig. 2-1, ‘center’
means the area 10–20% from the center of the cell and ‘edge’ means the area 10–20% from the cell edge. Data were evaluated by Student’s t-test or Paired t-test.
32
3. Chapter 3
Correlation analysis between membrane potential and ATP of
mitochondria and axonal elongation
3.1 Introduction
Mitochondria are organelles that produce adenosine triphosphate (ATP), a major energy source for living bodies, and are known to be enriched in regions that have a high energy demand at both the organ and subcellular levels (Attwell and Laughlin, 2001; Lukic-Bilela et al., 2011; MacAskill and Kittler, 2010). This is especially true for neurons due to their highly polarized morphology, which is indispensable for proper neuronal activities, and local activity that requires in-place and highly effective energy production via mitochondria. In fact, neuronal mitochondria are enriched in specific cellular regions with large energy demands, such as synapses, nodes of Ranvier, and growth cones (GCs) (Harris et al., 2012; Saxton and Hollenbeck, 2012). Although action potential generation is known to be a major ATP consumer in neurons (Harris et al., 2012; Rangaraju et al., 2014; Sheng, 2014), morphological changes and neurite growth also require substantial amounts of energy, especially during developmental stages (Fukumitsu et al., 2015; Sheng and Cai, 2012; Spillane et al., 2013; Vaarmann et al., 2016).
Although mitochondria have a variety of roles, ATP production is considered a major function, because the inhibition of oxidative phosphorylation results in stalled
mitochondria and defective neuronal behavior (Nicholls and Budd, 2000; Oruganty-Das et al., 2012; Surin et al., 2012; Tao et al., 2014; Vaarmann et al., 2016). Therefore, ATP and mitochondria are frequently considered to be closely related to cellular viability or health. For example, many neurodegenerative diseases with a loss of neuronal function and morphology have accompanying mitochondrial dysfunctions (Plucińska et al., 2012; Takihara et al., 2015; Wang et al., 2016). Additionally, in some neuronal injury
33
models, unimpaired mitochondria are crucial for neuronal energy recovery and neuronal survive (Connolly et al., 2014; Wang et al., 2016). In this context, the existence of healthy mitochondria seems to be interpreted as sufficient ATP availability in neurons, although in most cases mitochondrial ATP (ATPmito) was not measured. There are some
studies showed mitochondrial activity; however, mitochondrial inner membrane
potential (IMPmito) was frequently investigated as surrogate measure of ATPmito, despite
no direct demonstration of correlation in physiological conditions between them.
Furthermore, previous findings regarding neuronal mitochondria were derived from experiments using artificial manipulation of mitochondrial functions, such as
knockdown of mitochondria-specific proteins required for docking to motor proteins or for fission/fusion (Hayashi et al., 2011; Vaarmann et al., 2016; Yu et al., 2016).
However, mitochondria in neurites are regulated by multiple, complex mechanisms and several properties exhibit large variety, such as transport (direction, velocity, proportion of moving mitochondria, and anchoring or docking), distribution, fission and fusion, and morphology (size or aspect ratio), other than functional aspects such as IMPmito and
ATPmito (Saxton and Hollenbeck, 2012; Sheng and Cai, 2012). Moreover, mutual
relationships between some of these properties have recently been revealed. For example, knockdown of the fusion-related protein, optic atrophy 1 (OPA1), resulted in changes to mitochondrial size and morphology, as well as transport velocity and
distribution (Yu et al., 2016). The dominant negative form of trafficking kinesin protein 2 (TRAK2), a kinesin adaptor protein, also caused defective mitochondrial transport, as well as reduced IMPmito (Fukumitsu et al., 2015). Furthermore, a consensus regarding a
mutual relationship between IMPmito and direction of transport has not been established.
Miller and Sheetz suggested that 90% of mitochondria with high IMPmito move
anterogradely, whereas 80% of those with low IMPmito move retrogradely (Miller and
Sheetz, 2004), while another study showed no correlation between IMPmito and the
direction of axonal transport (Verburg and Hollenbeck, 2008). Due to the mutual dependency and complexity of several mitochondrial properties, it is necessary to study
34
mitochondrial function without artificial interruption to clarify native mitochondrial behavior.
To clarify native mitochondrial behavior, especially regarding energy metabolism abilities, direct measurements of ATPmito, IMPmito and other properties such as transport,
morphology or distribution under physiological condition are necessary. Although mitochondrial isolation (Shibata et al., 2015) is one of effective methods for
characterization of a mitochondrion, some property such as transport or distribution need to be measured within cells. However, little research has been conducted investigating ATPmito measurements under physiological conditions or with other
mitochondrial parameters in living cells. There are several reasons for this: 1) there are limited methods to directly measure ATPmito with high spatiotemporal resolution
(Imamura et al., 2009; Nakano et al., 2011); 2) in general, change in ATP levels without extensive stimulation is subtle, and therefore hard to evaluate; and 3) assessing a variety of properties simultaneously requires elaborate and careful preparation, conditioning and treatment in both experimentation and analysis. However, we recently used spatiotemporal image processing analysis to overcome such problems and have demonstrated relationships between biological signals collected from simultaneous fluorescent imaging under physiological conditions (Kobayashi et al., 2013; Suzuki et al., 2015).
With this background, we conducted simultaneous fluorescent imaging of ATPmito,
IMPmito, and other mitochondrial or neuronal properties in neurons using mitAT1.03
(Imamura et al., 2009; Kioka et al., 2014; Yoshida et al., 2017), an ATPmito indicator,
and tetramethylrhodamine ethyl ester (TMRE) (O’Reilly et al., 2003; Zhou et al., 2014), an IMPmito indicator, in this present study. Detailed analysis of the relationships
revealed that not all ATPmito and IMPmito correlated accurately, and as for axonal
35
3.2 Results
IMPmito and ATPmito in transport
Firstly, to investigate ATPmito or IMPmito dependency on transportation, we compared
ATPmitoor IMPmito among anterogradely transported, stationary and retrogradely
transported mitochondria within axonal processes using kymographs (Figs. 1, 2, 3-3). Mitochondria that moved anterogradely had relatively higher levels of ATPmito;
however, the difference was not significant. IMPmito was relatively depolarized in
retrogradely transported mitochondria compared to anterogradely transported mitochondria. However, there was no significant difference between the IMPmito of
anterogradely transported mitochondria and stationary mitochondria. No ATPmitoor
IMPmito dependence on mitochondrial velocity and transported distance was found (Fig.
3-4). Results of ATPmito and IMPmito were expected to be similar; however, our result
36
Figure 3-1.Experimental procedure of this study.
We dissociated and cultured dorsal root ganglion neurons from day 18 rat embryos and observed their mitochondrial dynamics along with axonal elongation.
37
Figure 3-2. Mitochondrial ATP and inner-membrane potential dependency on the transport direction of mitochondria.
A typical image of a nerite visualized for (a) mseCFP + mVenus fluorescence (mitAT1.03) or (b) TMRE. Acquired kymograph from a (c) and b (d). (e) Manually identified mitochondrial tracks. Here, the growth cone area was excluded from
kymograph. (f) Mitochondrial ATP or (g) TMRE intensity visualized in pseudo color. Each color table is linear and covers the full range of the data. Relative (h)
mitochondrial ATP and (i) TMRE intensity levels for 33 retrograde, 78 stationary and 27 anterograde mitochondria from 50 axonal processes. Error bars represent the standard error of the mean (SEM).
38
Figure 3-3.Detail characterization of mitochondria.
Average mitochondrial (a) proportions, and (b) velocity for 33 retrograde, 78 stationary, and 27 anterograde mitochondria from 50 neurons. Error bars represent SEM.
39
Figure 3-4. Correlation between parameters characterizing mitochondria.
Correlations of mitochondrial velocity, displacement, relative mitochondrial ATP, and relative TMRE intensity were investigated. No obvious correlation was found except the natural correlation between velocity and displacement.
40
IMPmito and ATPmito in fission/fusion
In addition to transported mitochondria, some mitochondria underwent fusion or fission events during observations. Using kymograph, we explored ATPmito and IMPmito
behavior during fusion or fission events. During fusion events, IMPmito more polarized
in a post-fusion mitochondrion compared to the average of the two pre-fusion mitochondria (Fig. 3-5, left). Likewise, ATPmito in a post-fusion mitochondrion were
higher than the average of the two pre-fusion mitochondria (Fig. 3-5, left). During fission events, there was a difference in IMPmito between the two post-fission
mitochondria. Then, we compared the changes in IMPmito and ATPmito in both of the two
post-fission mitochondria, respectively: one with a relatively highly polarized and the other with a relatively less polarized IMPmito (named Post-1 and Post-2 in Fig. 3-5, right,
respectively). During fission events, the IMPmito of Post-2 was less polarized than that of
the pre-fission mitochondrion as previously reported (Twig et al., 2008), while that of Post-1 was the same as that of a pre-fission mitochondrion (Fig. 3-5, right); however, no ATPmito changes were observed. This result also indicated that ATPmito and IMPmito are
41
Figure 3-5. Change in mitochondrial ATP and inner-membrane potential during fission or fusion events.
Typical kymograph showing the change in mitochondrial ATP and TMRE intensity during a mitochondrial (upper, left) fusion or (upper, right) fission event. Each color table is linear and covers the full range of the data. Typical mitochondrial ATP levels or TMRE intensity behavior (middle, left and right) visualized in the upper panels is demonstrated. Comparison of change in mitochondrial ATP levels and TMRE intensity just before (-1 to 0 min) and just after (0 to 1 min) or after (1 to 2 min) 20 fission and 20 fusion events (lower, left and right). Error bars represent SEM.
42
IMPmito and ATPmito in distribution
We next assessed mitochondrial density using still images (Fig. 3-6). Mitochondrial density was defined as: (sum of area dominated by all mitochondria) / (area size of GC or axonal process). We confirmed that mitochondrial density was higher in the GCs compared to the axonal process (Fig. 3-7a). Although average ATPmito were slightly
lower in the GCs compared to the axonal process, integrated ATPmito signals (calculated
by multiplying average ATPmito and mitochondrial density) were high in the GCs due to
the high mitochondrial density (Fig. 3-7b, c). Average IMPmito relatively hyperpolarized
in the GCs than in the axonal process (Fig. 3-7d).
ATPmito in GCs and axonal elongation have a positive correlation
Because GC is a structure related to axonal elongation, we quantified the distance of axonal elongation, and examined the role of mitochondrial dynamics in elongation. Among neurons grown during 10 min observation, the distance of axonal elongation and ATPmito or integrated ATPmito signals in the GCs showed a positive correlation (Fig.
3-7e, f). This correlation was stronger in GCs than in axonal processes (Fig. 3-7h, i, k, l). Furthermore, no correlation was found between elongation and IMPmito for both GCs
and axonal processes (Fig. 3-7g, j, m). These results suggest that ATPmito in GCs, but
43
Figure 3-6. Comparison of mitochondrial properties between GC and axonal process using still images.
(a) Differential interference contrast (DIC) image of a typical neuron. (b) Red line indicates detected morphology of growth conal central (C-) domain and axonal process. A neck of GC represented by a red point was manually defined. Pseudo color image of (c) mitochondrial ATP levels and (d) TMRE intensity. (e) Detected mitochondria. Morphology of the area and mitochondrial location within the area indicated for both (f) GC and (g) axonal process.
44
Figure 3-7.Mitochondria in GCs and axonal processes show different correlations between axonal elongation and mitochondrial ATP or inner- membrane potential.
Average (a) density, (b) mitochondrial ATP levels, (c) integrated mitochondrial ATP signals (density × mitochondrial ATP levels), and (d) TMRE intensity of growth cones (GC; blue), axonal processes near GCs (0–20 µm from GC; grey) and axonal processes relatively far from GCs (20–40 µm from GC; light grey). Correlations between the distance of axonal elongation with (e, h, k) mitochondrial ATP, (f, i, l) integrated mitochondrial ATP signal or (g, j, m) TMRE intensity at (e–g) GCs, (h–j) axonal processes near GCs and (k–m) axonal processes relatively far from GCs. Data were taken from (a–d) 29 neurons or (e–m) a subset of 18 neurons grown from within those 29 neurons. In (e–m), each color represents each neuron. Error bars represent SEM.
45
ATPmito in GCs are involved in axonal elongation and GC morphological change
To verify the importance of ATPmito in GCs for elongation, we further examined the
effect of artificially disrupting IMPmito or ATPmito on axonal elongation using a
mitochondrial uncoupler, carbonyl cyanide-p-trifluoromethoxyphenylhydrazone (FCCP), or the ATP synthase inhibitor, Oligomycin A, respectively.
Both FCCP and Oligomycin A induced apparent drawing back of neurons compared to the control condition (i.e., neurons without drug treatment; Fig. 3-8a–c). However, the detail of change in IMPmito and ATPmito differed between FCCP and Oligomycin A, as
well as between GCs and axonal processes. In GCs treated with FCCP, IMPmito
depolarized and ATPmito decreased, and the declines correlated with axonal drawing
backs (Fig. 3-8d, upper). On the other hand, in axonal processes treated with FCCP, although IMPmito depolarized, ATPmito did not significantly change (Fig. 3-8d, lower).
As a result, no correlation was observed in axonal processes between the decrease in ATPmito and axonal drawing back. Although drawing back and depolarization of IMPmito
showed a correlation in axonal processes, the peak was lower than that in GCs. After treatment with Oligomycin A, ATPmito decreased both in GCs and in axonal processes;
however, IMPmito levels did not change for either GCs or axonal processes (Fig. 3-8e).
Therefore, no correlation was found between IMPmito and drawing back while there was
a correlation between the decrease in ATPmito and drawing back. Again, the correlation
was more remarkable in GCs.
Axons drew back even when IMPmito did not depolarized (Fig. 3-8c–e). Additionally,
axonal drawing back correlated more with the decrease in ATPmito than in IMPmito, and
this correlation was higher in GCs than in the axonal processes. These results again indicated that ATPmito, especially in GCs, are crucial for axonal elongation.
46
Figure 3-8. Mitochondrial ATP in GCs had a correlation with axonal dynamics.
Typical images of axons treated with (a) 5 µM FCCP or (b) 2 µM Oligomycin A. (c) Average distance of axonal drawing back after treatment of FCCP or Oligomycin A. Average changes and cross-correlation functions with drawing back of (left)
mitochondrial ATP levels or (right) TMRE intensities when axons were treated with (d) FCCP (7 axons) or (e) Oligomycin A (11 axons). In figures of average changes, error bars represent SEM. In figures showing cross-correlation functions, blue lines (in upper rows), grey lines (in lower rows), and dark-blue lines (in all figures) represent
correlations calculated in GCs, in axonal processes, and from random-shuffled datasets, respectively. Light-shaded bars attached to the lines represent SEM.
47
In addition to axonal process drawing back, GC collapse was observed. To examine this change quantitatively, we conducted additional analyses of the changes in GC
morphology, with a focus on the effect of Oligomycin A because it induced more drastic morphological changes than FCCP. The indices that we quantified were (i) area, (ii) newly appeared area, (iii) newly disappeared area, (iv) the sum of the newly
appeared area and the newly disappeared area, (v) edge length and (vi) the ratio of edge length to area of both the peripheral- (P-) and the central- (C-) domains of the GC (Fig. 3-9). The (ii) newly appeared area, (iii) newly disappeared area and (iv) their sum in the P-domain correlated positively with axonal drawing back after treatment with
Oligomycin A. This means that these indices decreased along with drawing back of the axonal process. The (i) area of the C-domain and the (v) edge length of both the P- and C-domains exhibited peaks before (negative time lag values) and after (positive time lag values) drawing back. This means that axonal drawing back occurred after the
C-domain area decreased (the positive peak at negative time lag), and that the C-C-domain area relatively increased after drawing back (the negative peak at positive time lag). Peaks in the (v) edge length and (vi) ratio of edge length to area of the P-domain shows that the P-domain attains a less protrusive morphology before axonal drawing back. The (v) edge length of the C-domain increases just after drawing back, which can be
48
Figure 3-9. Correlation between changes in GC morphology and axonal process dynamics.
Cross-correlation function between neck position drawing back and each index of GC morphology (black lines). Blue lines represent cross-correlation function derived from randomly shuffled datasets. Both the black and blue lines are the averaged results from 11 neurons. The horizontal axis represents time lag (min), and the vertical axis
49
Moreover, correlation analysis between these indices and ATPmito revealed that the (ii)
newly appeared area, (iii) the newly disappeared area and (iv) their sum in the P-domain correlated positively with ATPmito in the GC (Fig. 3-10). Importantly, none of these
indices correlated in the C-domain or the axonal process. These results indicate that although ATPmito decrease and axonal drawing back were positively correlated (Fig.
3-8e), analysis focused on GC morphology revealed that ATP downregulation manifested as less dynamic morphological changes in the P-domain of the GC. Because
morphological changes in the P-domain relies mainly on actin dynamics, these results suggest the importance of ATP in actin turnover in GCs.
50
Figure 3-10. Correlation between changes in GC morphology and mitochondrial ATP.
Cross-correlation function between changes in mitochondrial ATP and each index of GC morphology (black lines) in either GC mitochondria (upper) or axonal process mitochondria (lower). Blue lines represent cross-correlation function derived from randomly shuffled datasets. Both the black and blue lines are averaged results from 11 neurons. The horizontal axis represents time lag (min), and the vertical axis represents correlation. Light-shaded bars attached to the lines represent SEM.