ISSN 1330-9862 scientific note (FTB-2313)
Improvement of Folate Biosynthesis by Lactic Acid Bacteria
Using Response Surface Methodology
Norfarina Muhamad Nor
1, Rosfarizan Mohamad
1,2*, Hooi Ling Foo
1,2and Raha Abdul Rahim
2,3 1Department of Bioprocess Technology, Faculty of Biotechnology and Biomolecular Sciences, University of Putra Malaysia, 43400 UPM Serdang, Selangor Darul Ehsan, Malaysia 2Laboratory of Industrial Biotechnology, Institute of Bioscience, University of Putra Malaysia, 43400 UPM Serdang, Selangor Darul Ehsan, Malaysia 3Department of Cell and Molecular Biology, Faculty of Biotechnology and Biomolecular Sciences, University of Putra Malaysia, 43400 UPM Serdang, Selangor Darul Ehsan, Malaysia Received: July 8, 2009 Accepted: October 6, 2009
Summary
Lactic acid bacteria (Lactococcus lactisNZ9000, Lactococcus lactisMG1363, Lactobacillus plantarumI-UL4 andLactobacillus johnsoniiDSM 20553) have been screened for their ability to produce folate intracellularly and/or extracellularly.L. plantarum I-UL4 was shown to be superior producer of folate compared to other strains. Statistically based experimental designs were used to optimize the medium formulation for the growth of L. plantarum I-UL4 and folate biosynthesis. The optimal values of important factors were determined by response surface methodology (RSM). The effects of carbon sources, nitrogen sources andpara-aminobenzoic acid (PABA) concentrations on folate biosynthesis were determined prior to RSM study. The biosynthesis of folate byL. plantarumI-UL4 increased from 36.36 to 60.39mg/L using the optimized medium formulation compared to the selective Man de Rogosa Sharpe (MRS) medium. Conditions for the optimal growth of L. plantarum I-UL4 and folate biosynthesis as suggested by RSM were as follows: lactose 20 g/L, meat extract 16.57 g/L and PABA 10mM.
Key words:folate, lactic acid bacteria,Lactobacillus plantarumI-UL4, response surface method-ology
Introduction
Folate plays an important role in human life as one of the most important essential components for the syn-thesis of purine, guanine, adenine, pyrimidine and thy-mine. Sufficient daily doses of folate may prevent di-seases such as colon cancer, growth retardation, anaemia and neural tube defects in newborn. The human body needs 200 to 400 mg of folate per day. However, preg-nant women are advised to take double doses (1). Folate is mostly found in green, leafy vegetables, legumes, beans, citrus, and dairy products, but spinach and beans have been found to contain the highest amount of folate
*Corresponding author; Phone: ++603 8946 7518; Fax: ++603 8946 7510; E-mail: farizan@biotech.upm.edu.my
(2). Folic acid (also known as vitamin B9 or folacin), folate (the naturally occurring form), pteroyl-L-glutamic acid and pteroyl-L-glutamate are forms of the water--soluble vitamin B9. Folic acid is not biologically active but after the conversion of tetrahydrofolate and other derivatives into dihydrofolic acid in the liver, it becomes biologically important. Folic acid found in fortified foods such as vitamin supplements is the synthetic form of water-soluble vitamin B9 (3). Based on the bioavailabil-ity, folic acid is more stable than the natural form of folate because folic acid is more readily and quickly ab-sorbed into the human body.
On the other hand, a good selection of microbial spe-cies such as lactic acid bacteria (LAB) and cultural con-ditions could enhance the level of folate in the ferment-ed milk and dairy products (4). It has been reported that the folate levels in most of the products are low (5,6). Therefore, several researchers have focused on the bio-synthesis of folate using LAB strains (7). Large differ-ences in folate biosynthesis for different LAB strains and different growth conditions have been reported in liter-ature.Lactococcus lactis,as claimed by Sybesmaet al.(8), has a great potential to produce high amount of folate and its metabolism was further explored to maximize folate biosynthesis. Other researchers have also reported that many strains of bifidobacterium were able to pro-duce folate (5). Among theLactobacillus species, onlyL. plantarumcan produce folate, whereas other species were shown to consume folate during growth (7).
The introduction of response surface methodology (RSM) by Box and Wilson (9) gives an alternative tech-nique to analyze the optimized culture conditions, thus enabling the researcher to design the experiment, build the blocks, and evaluate the effects of different growth factors and responses. This approach allows the searchers to design experiments based on the RSM re-sults and produce maximum yield of desired products (10). Furthermore, one of the major constraints involved in designing new cultivation media is the high number of experiments involved. RSM, a combination of good experimental design, regression modelling techniques and optimization, is a useful tool for process improve-ment. Therefore, RSM is a valuable tool used prior to industrial level production (11). Most of the researches on the optimization of medium formulation and cultural conditions for biosynthesis of products by LAB were focused on the conventional method rather than RSM approach (5,7,12,13).
The present work has been conducted to identify folate producers amongst our laboratory collection of LAB using microbiological assay. Folate in a biological extract is usually determined by a microbiological assay and this method is highly sensitive and ideal for routine assaying. The optimization of medium formulation for the growth and folate biosynthesis by the selected strains was then investigated through a conventional method and statistical approach of RSM.
Materials and Methods
Bacterial strains and maintenance
LAB strains were maintained in 5 % (by volume) glycerol at –80 °C.L. lactisNZ9000 andL. lactisMG1363 were kind gifts of Kees Leenhouts, the Netherlands.L. plantarumI-UL4 was isolated from local fermented food (14,15) andL. johnsonii DSM 20553 was purchased from DSMZ (German Collection of Microorganisms and Cell Cultures), Braunschweig, Germany.
Growth of LAB cultures
L. lactis NZ9000 and MG1363 were cultivated in folate-free M17 medium (16) supplemented with 0.5 % (m/V) glucose.L. plantarumI-UL4 andL. johnsoniiDSM 20553 were cultivated in de Man-Rogosa-Sharpe (MRS) medium (17). All cultivations were carried out in a 250-mL
Erlenmeyer flask containing 100 mL of medium at pH=7. The LAB strains were incubated at 30 °C at the agitation speed of 100 rpm for 24 h. The strains were cultivated in modified MRS medium containing (in g/L): glucose 10, peptone 10, yeast extract 5, meat extract 5, potassium hydrogen phosphate 2, sodium acetate 5, triammonium citrate 2, magnesium sulphate 0.2, manganese sulphate 0.2 and Tween 80 1 mL/L with the addition ofpara -ami-nobenzoic acid (PABA, 0.01 mM). All cultivations were seeded with 5 % (by volume) inoculum. Inocula were prepared by inoculating a colony of the strains grown on an M17 or MRS agar plate into 5 mL of M17 or MRS broth in a 10-mL test tube with continuous shaking (100 rpm) in a water bath at 30oC for 12 h.
Central composite design
Three variables and five levels were used in this study. The three variables used were lactose, meat ex-tract and PABA concentration. The experimental design for central composite design (CCD) is shown in Table 1.
The results of the CCD were statistically evaluated and the data were analyzed by Design Expert v. 6.0.6 (Stat-Ease Inc., MN, USA). Each variable was investigat-ed as the independent and dependent variable. Each in-dependent variable indicates high level (+1) and low level (–1). An axial distance±awas chosen to be 1.4 to make the design rotatable, which means that the value is at the same distance from the design centre. The centre point, or typically known as dependent variable, was in-dicated as 0 and maintained at constant value, which provided an unbiased estimate of the process error vari-ance. This centre point was set at middle point value, and six centres of this experiment were included to avoid the missing of a non-linear relationship (18). The response of folate concentration was subjected to quad-ratic regression model and expressed by the second--order polynomial:
Y=bo+Sbjxj+Sbjjxj2+Sbjkxjxk /1/ whereYis the folate concentration, andbj,bjjandbjkare
linear, quadratic and interactive coefficient, respectively. The F-value was considered to be significant. The lack of fit should be non-significant and produce a good multi-ple correlation coefficient (R2).
Analytical determination Cell and substrate concentrations
A volume of 6 mL of the sample was withdrawn at 1-hour intervals for the analysis of folate, cell concen-tration and reducing sugar concenconcen-tration. A volume of 5 mL of the sample was used for the analysis of intra- and extracellular folate and 1-mL sample was used for sub-Table 1. Coded and real values of variables selected for CCD
Variable Unit Values of CCD variables
–a –1 0 +1 +a
A lactose g/L 1.89 5 12.5 20 23.11 B meat extract g/L 1.89 5 12.5 20 23.11 C PABA mM 1.56 3 6.5 10 11.45
strate (19) and cell concentration analysis. The 1-mL samples were centrifuged (10 000´g, 10 min, 4 oC) to separate the cell pellet from the supernatant. The super-natants were collected for substrate determination and the absorbance was measured at 540 nm, while the cell pellets were used for cell concentration determination. The cell pellets were transferred to a pre-weighed dry filter paper and dried for 24 h at 100oC. Dry cell mass (DCM) values were correlated with absorbance measure-ments at 600 nm to obtain a calibration standard ofA600 nm
vs.DCM.A600 nmreadings were subsequently used to
deter-mine DCM.
Folate concentration
Folate concentration was quantified using a Lacto-bacillus casei microbiological assay. Cells and supernat-ants recovered from a cell culture were used to measure both intra- and extracellular folate concentrations as de-scribed previously (20).L. caseiATCC 7469 was used for folate bioassay and stored at –80 °C in MRS medium sup-plemented with 15 % (by volume) of glycerol. In the assay, L. casei ATCC 7469 was pre-grown in Folic Acid Casei Medium (Difco Laboratories, Surrey, UK) supplemented with folate 0.3 mg/L and the culture was incubated for 18 h at 37 °C. Volumes of 1.5 mL of aliquots of the cul-ture were then stored in sterile tubes at –80 °C until use for folate determination. For measuring the intracellular and extracellular folate, a volume of 5 mL of cultivation broth was used and centrifuged (10 000´g, 10 min, at 20 °C) to separate the cell and the supernatant. The cells were washed with 0.1 M sodium acetate buffer (pH=4.8) and 1 % (by volume) of ascorbic acid and resuspended with the same buffer. The samples were then incubated at 100 °C for 5 min to release the folate from the cells. The supernatant was diluted 1:1 with 0.1 M sodium ace-tate buffer (pH=4.8) and 1 % (by volume) of ascorbic acid. The analysis of total folate concentration, including poly-glutamyl folate, was conducted after enzymatic deconju-gation of the folate samples with human plasma (Sigma--Aldrich, Malaysia) and incubated for 4 h at 37 °C. The microbiological assay was determined in 96-well micro-titer plates. The wells were filled by adding 8mL of work-ing buffer containwork-ing 0.1 M potassium phosphate buffer with sodium acetate buffer (pH=4.8) and 1 % (by vol-ume) of ascorbic acid to 122mL of samples or 60 mL of reference sample, and the volume was increased by ster-ile distilled H2O until it reached 150 mL and prior to
filling with 150mL of Folic Acid Casei Medium. The assay plate was covered and incubated at 37 °C for 18 h. For reference samples, folate was dissolved in the same buf-fer at a concentration ranging from 0 to 0.30mg/L. The growth of LAB strains in the 96-well microtiter plates was determined by measuring the absorbance at 620 nm using the Zenyth Microplate Reader (Biochrom Ltd, Cam-bridge, UK).
Results and Discussion
Selection of folate producer
The results obtained in this study showed that the growth performance of folate producer was strain-specific. All the strains grew well and produced comparable intra-and extracellular folate. About 7.67 g/L of maximum cell
concentration (Xmax) was achieved in the cultivation of
L. plantarumI-UL4 with a specific growth rate (m) of 0.39 h–1 after 18 h of cultivation using MRS medium. The
highest folate level was detected in L. plantarumI-UL4 (36.36mg/L).Lactobacillusspp. was able to grow well and produce substantially high folate using chemically de-fined or complex media, compared to other strains (7). However, 27.63mg/L of folate were obtained in the cul-tivation of L. johnsonii DSM 20553 with the maximum cell concentration of 7.73 g/L, which was the lowest, com-pared to the other strains.
Higher growth yield,Yx/s(1.69 g/g) and slightly lower
folate production (30.61mg/L) were obtained forL. lactis NZ9000 compared to L. plantarum I-UL4. These results suggest that the substrate was mainly consumed for the biomass build-up rather than the biosynthesis of folate. Furthermore, high cell concentration increased the visco-sity of the culture, which could reduce the mixing effi-ciency and hence limit the substrate availability for fo-late biosynthesis (21,22).
The highest efficiency of cells to produce folate (Yp/x)
was observed in the cultivation ofL. lactisMG1363 (6.31
mg/g). It was shown that this species has maximum effi-ciency in producing folate compared to other strains. From the results, it can be suggested that the biosynthesis of folate was non-growth associated process since good growth was unable to promote higher folate biosynthe-sis as observed in the cultivation ofL. lactisNZ9000 and L. johnsoniiDSM 20553. The highest productivity was ob-served in the cultivation ofL. plantarumI-UL4 (3.71mg/ (L·h)). Hence,L. plantarumI-UL4 was selected as the su-perior folate producer and used for further optimization studies on medium composition via conventional and RSM approaches.
Effect of carbon sources on folate production
Preliminary optimization study on medium compo-sition was conducted to determine important factors that could enhance the biosynthesis of folate. Three dif-ferent carbon sources (lactose, maltose and glucose) were selected in this study andL. plantarumI-UL4 grew well on all of them. The highest biosynthesis of folate (36.19
mg/L) was obtained when lactose was used as the car-bon source, compared to maltose and glucose. The strain also showed high efficiency when using lactose as a car-bon source to produce folate (data not shown). The high-est productivity of folate was obtained in the cultivation process using lactose (1.97mg/(L·h)) compared to glu-cose (1.53mg/(L·h)) and maltose (1.13mg/(L·h)). Lactose is normally found in milk and it is the preferred carbon source for the growth of LAB (23).
Effect of nitrogen sources on folate production
The maximum cell concentration (Xmax) was obtained
when yeast extract was used as a nitrogen source (data not shown). Yeast extract, which consists of nitrogenous compounds and growth factors, stimulates cell growth (24,25). However, the best nitrogen source for the high-est biosynthesis of folate (47.01mg/L) was obtained when using meat extract. Slightly lower folate concentration was obtained when using yeast extract (42.83mg/L) and
pep-tone (43.71mg/L) as nitrogen sources (data not shown). Even though the cell efficiency of folate biosynthesis (Yp/x)
was the highest on peptone compared to meat extract and yeast extract, the highest productivity of folate (1.56
mg/(L·h)) was found on meat extract (data not shown). Therefore, meat extract is the most suitable nitrogen source for folate biosynthesis although it is quite an expensive source of nitrogen, especially for industrial application. Hence, a precise concentration of meat extract needed in a medium for higher folate biosynthesis should be fur-ther investigated.
Optimization of lactose concentration for folate production
Generally, a higher concentration of lactose in the medium exhibits an increased cell concentration. In this study, approx. 7.07 g/L of maximum cell concentration (Xmax) was achieved using 20 g/L of lactose (Table 2).
However, slightly lower folate concentration was obtained when more lactose was added to the medium. This in-dicated that the carbon flux in cells favoured more the build-up of cell biomass or biosynthesis of by-products rather than the folate biosynthesis. Excessive carbon source in the culture broth reduces biomass yield and growth efficiency due to metabolism overflow. Lactose concentration of 10 g/L was optimal for the strain to pro-duce the highest folate concentration (35.94mg/L) (Table 2). As shown earlier, the biosynthesis of folate was a non--growth associated process, therefore the balanced car-bon flux in cells is required through the folate pathway and other metabolite pathways (5,7,12).
Optimization of meat extract concentration for folate production
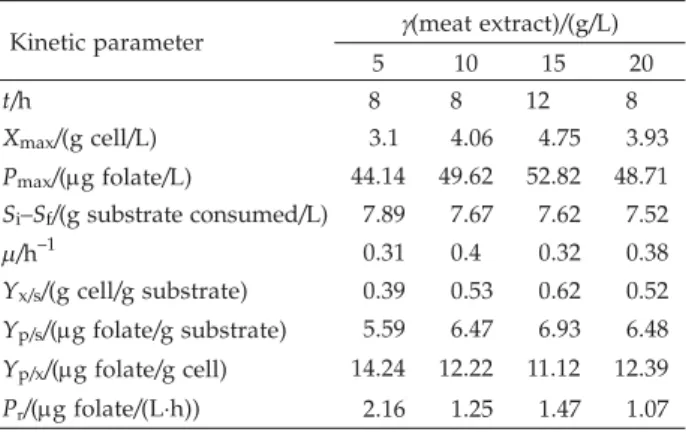
The growth performance and the kinetic parameter values of L. plantarumI-UL4 cultivation using meat ex-tract as a nitrogen source are shown in Table 3. When 15 g/L of meat extract were used, maximum cell concen-tration (Xmax) of 4.75 g/L and the highest folate
biosyn-thesis (52.82mg/L) were obtained. The growth ofL. plan-tarumI-UL4 and folate biosynthesis were reduced with meat extract concentration above 15 g/L in the medium.
Further increment of nitrogen source in the medium showed an inhibitive effect on the growth performance of the strain and folate biosynthesis. This finding is not in agreement with previous studies (7,8) where batch cultures ofL. lactisMG1363 supplemented with growth--inhibiting substances increased the folate biosynthesis. Such discrepancies may be due to the use of meat ex-tract in the medium, which consists of nitrogenous com-pounds and growth factor.
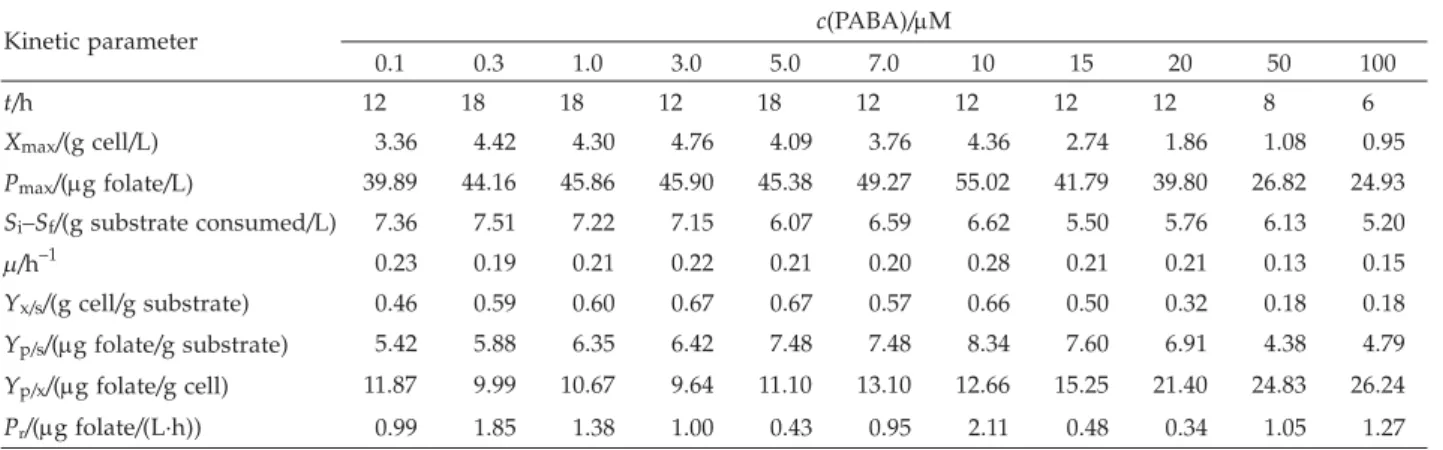
Optimization of PABA concentration for folate production
The addition of PABA into the medium promoted good growth of L. plantarum I-UL4 and folate biosyn-thesis. PABA concentration of 0.1 to 10mM significantly increased the biosynthesis of folate (Table 4). However, an addition of above 15mM of PABA caused cell inhibi-tion and decreased biosynthesis of folate. At the concen-tration of 50 to 100mM of PABA, the growth was signifi-cantly inhibited and the substrate was not fully utilized by L. plantarum I-UL4. The strain efficiently produced high amount of folate (55.02mg/L) at 10 mM of PABA. This result suggested that the biosynthesis of folate byL. plantarumI-UL4 was enhanced by the addition of PABA to the medium. In the absence of PABA, low folate lev-els were found to be produced byL. lactisstrain (7) and PABA is an important precursor of folate biosynthesis (5).
Optimization of lactose, meat extract, and PABA by central composite design
A second experiment was conducted as a result of the aforementioned findings, in an attempt to further optimize the independent levels of lactose, meat extract and PABA with a face-centred central composite design (CCD) using Design Expert software. The results of 20 experiments to evaluate the effect of three factors of me-dium composition that influenced folate biosynthesis are shown in Table 5. Centre points with a coded value (0) were repeated six times in order to estimate pure error for the lack of fit test. Models with a significant lack of fit should not be used for predictions. The insignificant lack of fit is most desirable at p>0.1.
Table 2. The performance and kinetic parameter values of folate biosynthesis by L. plantarum I-UL4 using different concentra-tions of lactose
Kinetic parameter g(lactose)/(g/L)
5 10 15 20 t/h 18 18 12 12 Xmax/(g cell/L) 5.75 5.92 7.00 7.07 Pmax/(mg folate/L) 34.22 35.94 31.10 30.47 Si–Sf/(g substrate consumed/L) 3.89 6.84 12.11 15.24 m/h–1 0.37 0.39 0.39 0.34 Yx/s/(g cell/g substrate) 1.48 0.87 0.58 0.46 Yp/s/(mg folate/g substrate) 8.80 5.25 2.57 2.00 Yp/x/(mg folate/g cell) 5.95 6.07 4.44 4.31 Pr/(mg folate/(L·h)) 0.90 1.01 1.12 0.92
Table 3. The performance and kinetic parameter values of folate biosynthesis by L. plantarum I-UL4 using different concentra-tions of meat extract
Kinetic parameter g(meat extract)/(g/L)
5 10 15 20 t/h 8 8 12 8 Xmax/(g cell/L) 3.1 4.06 4.75 3.93 Pmax/(mg folate/L) 44.14 49.62 52.82 48.71 Si–Sf/(g substrate consumed/L) 7.89 7.67 7.62 7.52 m/h–1 0.31 0.4 0.32 0.38 Yx/s/(g cell/g substrate) 0.39 0.53 0.62 0.52 Yp/s/(mg folate/g substrate) 5.59 6.47 6.93 6.48 Yp/x/(mg folate/g cell) 14.24 12.22 11.12 12.39 Pr/(mg folate/(L·h)) 2.16 1.25 1.47 1.07
The results from the CCD showed that the optimal concentrations of lactose, meat extract and PABA for fo-late biosynthesis were 20 g/L, 20 g/L and 10 mM, re-spectively. The Design Expert software uses an optimi-zation method that allows the criteria for all variables and responses to be set. This optimization method takes into consideration a combination of criteria in the cal-culation of the optimum points. Therefore, based on the setting for criteria of lactose (in range), meat extract (in range), PABA (in range) and response (maximize), the optimum point of lactose (20 g/L), meat extract (16.57 g/L) and PABA (10mM) was suggested.
The maximum response predicted from the model was 58.51mg/L. Repeated experiments were performed to verify the predicted optimum value. A maximum fo-late concentration (60.39 mg/L) was obtained from run no. 8. Although the actual experimental response value at the optimum point was slightly higher than the pre-dicted value, statistically, there was no significant differ-ence. The maximum folate concentration obtained from the optimized medium composition was compared with the MRS standard medium, and it was apparent that the optimized medium formulation significantly improved folate biosynthesis by about twofold. It is interesting to note thatL. plantarumhas an ability to produce about 45
mg/L of folate (4) as well as other beneficial metabolites including bacteriocin (26). In this study, even higher pro-duction of folate byL. plantarum I-UL4 was obtained.
Regression analysis was performed to fit the response function with the experimental data. The data obtained (Table 6) were fitted to a quadratic polynomial model, and the obtained full actual model is shown in Eq. 2:
Y=52.42+3.93A+2.74B+2.19C–0.22A2–2.78B2+ +0.36C2+0.73AB–0.43AC–0.42BC /2/ where Y represents the predicted responses; A, B and C are coded values of lactose, meat extract and PABA con-centration, respectively.
Table 4. The performance and kinetic parameter values of folate biosynthesis byL. plantarumI-UL4 using different concentrations of PABA
Kinetic parameter c(PABA)/mM
0.1 0.3 1.0 3.0 5.0 7.0 10 15 20 50 100 t/h 12 18 18 12 18 12 12 12 12 8 6 Xmax/(g cell/L) 3.36 4.42 4.30 4.76 4.09 3.76 4.36 2.74 1.86 1.08 0.95 Pmax/(mg folate/L) 39.89 44.16 45.86 45.90 45.38 49.27 55.02 41.79 39.80 26.82 24.93 Si–Sf/(g substrate consumed/L) 7.36 7.51 7.22 7.15 6.07 6.59 6.62 5.50 5.76 6.13 5.20 m/h–1 0.23 0.19 0.21 0.22 0.21 0.20 0.28 0.21 0.21 0.13 0.15 Yx/s/(g cell/g substrate) 0.46 0.59 0.60 0.67 0.67 0.57 0.66 0.50 0.32 0.18 0.18 Yp/s/(mg folate/g substrate) 5.42 5.88 6.35 6.42 7.48 7.48 8.34 7.60 6.91 4.38 4.79 Yp/x/(mg folate/g cell) 11.87 9.99 10.67 9.64 11.10 13.10 12.66 15.25 21.40 24.83 26.24 Pr/(mg folate/(L·h)) 0.99 1.85 1.38 1.00 0.43 0.95 2.11 0.48 0.34 1.05 1.27
Table 5. Central composite design with a real value and response to folate concentration (actual and predicted values)
Run g(A)/(g/L) g(B)/(g/L) c(C)/mM g(folate)/(mg/L) Obtained value Predicted value 1 5 5 3 38.70 40.80 2 20 5 3 50.11 48.06 3 5 20 3 47.94 45.66 4 20 20 3 54.86 55.84 5 5 5 10 47.64 46.88 6 20 5 10 49.91 52.41 7 5 20 10 47.80 50.07 8 20 20 10 60.39 58.51 9 12.5 12.5 6.5 53.00 52.43 10 12.5 12.5 6.5 52.73 52.43 11 12.5 12.5 6.5 51.09 52.41 12 12.5 12.5 6.5 52.73 52.41 13 1.90 12.5 6.5 47.27 46.42 14 23.11 12.5 6.5 57.11 57.52 15 12.5 1.90 6.5 44.14 42.97 16 12.5 23.11 6.5 49.99 50.72 17 12.5 12.5 1.55 49.05 50.03 18 12.5 12.5 11.45 57.64 56.22 19 12.5 12.5 6.5 50.97 52.41 20 12.5 12.5 6.5 53.56 52.41 A – lactose, B – meat extract, C – PABA
Table 6. Regression coefficient and the significance for the re-sponse of folate biosynthesis
Factor Degree of freedom Coeffi-cient estimate Standard error Computed t -distri-bution p>|t| Intercept 1 52.42 0.93 56.37 0.0012 A 1 3.93 0.62 6.34 0.0011 B 1 2.74 0.62 4.42 0.0017 C 1 2.19 0.62 3.53 0.0065 A2 1 –0.22 0.76 –0.29 0.7775 B2 1 –2.78 0.76 –3.66 0.0052 C2 1 0.36 0.76 0.47 0.6511 AB 1 0.73 0.76 0.96 0.3632 AC 1 –0.43 0.76 –0.57 0.5826 BC 1 –0.42 0.76 –0.55 0.5955
The student's t-distribution and the corresponding p-values along with the second order coefficient are shown in Table 6. p-Value is used as a tool to determine the significance of each coefficient and higher p-value indicated higher significance of corresponding coeffi-cient (10). The parameter was estimated and the corre-sponding p-values showed that A (lactose), B (meat extract) and C (PABA) had significant effect on the biosynthesis of folate. Positive coefficient for A, B and C was indicat-ed as a linear effect to the response. Table 6 shows some of the model terms of response of folate biosynthesis (A2,
C2, AB, AC and BC), which had p-value>0.05. Therefore,
they were eliminated from the model and simplified quadratic model equation most suitably described the folate biosynthesis as follows:
Y=52.42+3.93A+2.74B+2.19C–2.78B2 /3/ The independent variables were fitted to the second order. Table 7 shows the results of the analysis of vari-ance (ANOVA) to indicate the adequacy of the fitted model. The low p-value (p<0.001) indicated that the ob-tained equation was appropriate and suitable after mod-el reduction. The determination of R2 coefficient,
cor-relation and model significance (F-value) were used to analyze the adequacy of the model. The quality of fit of the equation was expressed by the determination
coeffi-cient, R2. Common study showed that a good R2should
be at least 80 %. The value of coefficient R2=0.9063
in-dicated that the model could explain about 91 % of the variability and it was attributed to the independent ables. Model significance (F-value) is a measure of vari-ation of the data around the mean. Also, the F-value indicates that the present model can serve as a good prediction of the experimental results. Central composite rotatable design (CCRD) analysis was unable to support a full cubic model; the results from the model were ac-companied by aliased statement, which indicated that not all parameters could be uniquely estimated.
Fig. 1 depicts the three-dimensional plot showing the effect of lactose (A) and meat extract (B) as responses to folate biosynthesis. Based on the p-value derived from the CCD analysis (Table 6), it shows no interactions be-tween these two variables. Biosynthesis of folate was in-creased when high concentration of meat extract was added to the medium, while keeping lactose at low con-centration.
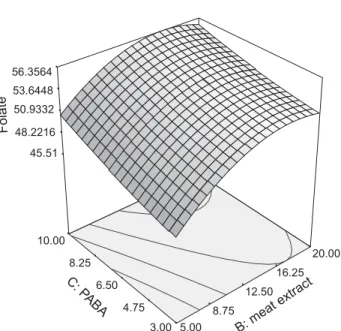
Fig. 2 shows the combined effects of meat extract (B) and PABA (C) as response to folate biosynthesis. From the analysis, the independent variables affect the biosyn-thesis, but there were no interactions between meat ex-tract and PABA, based on p-value results. This indicates that all independent variables cannot be interacting due
Table 7. Analysis of variance (ANOVA) for the quadratic model of folate biosynthesis
Source Sum of squares Degree of freedom Mean F-value Prob>F
Linear 332.68 3.00 14.82 <0.0001 Cross product 7.16 3.00 0.27 0.8442 Quadratic 63.42 3.00 4.56 0.0331 Cubic 35.64 4.00 7.36 0.0252 Total 52127.26 13.00 2606.36 Pure error 4.86 4.00 1.22 R2=0.9063 43.476 46.9084 50.3409 53.7733 57.2057 Fola te 5.00 8.75 12.50 16.25 20.00 5.00 8.75 12.50 16.25 20.00 A:lacto se B:m ea t ext rac t
Fig. 1.Response surface plot of folate biosynthesis as a function of lactose and meat extract concentrations
45.51 48.2216 50.9332 53.6448 56.3564 Fola te 5.00 8.75 12.50 16.25 20.00 3.00 4.75 6.50 8.25 10.00 B:mea t extr act C: PABA
Fig. 2.Response surface plot of folate biosynthesis as a function of meat extract and PABA concentrations
to the insignificant model of p-value test. Low concen-tration of meat extract and the addition of high con-centration of PABA to the medium induced high biosyn-thesis of folate. The addition of PABA stimulated the biosynthesis of folate. In L. plantarumI-UL4, folate bio-synthesis was shown to be dependent on the concentra-tion of PABA in the medium. Generally, with the addi-tion of PABA, the biosynthesis of folate was increased by about twofold compared to the standard MRS me-dium.
Conclusion
Biosynthesis of folate was strain-dependent and all investigated LAB strains were able to grow well and pro-duce folate. The highest folate biosynthesis was obtained in L. plantarum I-UL4 culture using standard MRS me-dium. A better understanding of the relationship among lactose, meat extract and PABA was obtained by RSM, which was used as a statistical tool to improve the folate biosynthesis ofL. plantarumI-UL4. RSM analyses demon-strated that optimum biosynthesis of folate can be success-fully predicted and the combination of lactose (20 g/L), meat extract (16.57 g/L) and PABA (10mM) significantly improved folate biosynthesis. The optimized medium formulation could be used for the cultivation process of L. plantarumI-UL4 for folate biosynthesis in a bioreactor system associated with a process control strategy.
Nomenclature
t: time at maximum cell concentration Xmax: maximum cell concentration (g cell/L)
Pmax: maximum folate concentration (mg folate/L)
Si–Sf: substrate consumed (g substrate/L)
Si: initial substrate concentration (g substrate/L)
Sf: final substrate concentration (g substrate/L)
m: specific growth rate (h–1)
Yx/s: growth yield coefficient (g cell/g substrate)
Yp/s: folate yield based on substrate utilized
(mg folate/g substrate)
Yp/x: folate biosynthesis per cell (mg folate/g cell)
Pr: folate productivity (mg folate/(L·h))
Acknowledgements
We would like to acknowledge the financial support from Science Fund, the Ministry of Science, Technology and Innovation of Malaysia, Project reference: 02-01-04-SF0330 and Graduate Research Scheme Fellowship (GRF) from the University of Putra Malaysia for Norfarina Muhamad Nor.
References
1. K.M. Forssén, M.I. Jägerstad, K. Wigertz, C.M. Witthöft, Folates and dairy products: A critical update, J.Am.Coll. Nutr. (Suppl. 2),19(2000) 100–110.
2. R.R. Eitenmiller, W.O. Landen: Vitamin Analysis for the Health and Food Sciences, CRC Press LLC, New York, USA (1999).
3. R. Póo-Prieto, D.B. Haytowitz, J.M. Holden, G. Rogers, S.F. Choumenkovitch, P.F. Jacques, J. Selhub, Use of the affi-nity/HPLC method for quantitative estimation of folic acid in enriched cereal-grain products,J.Nutr.136(2006) 3079– 3083.
4. J.G. Le Blanc, G. Savoy de Giori, E.J. Smid, J. Hugenholtz, F. Sesma: Folate Production by Lactic Acid Bacteria and Other Food-Grade Microorganisms. In: Communicating Current Research and Educational Topics and Trends in Applied Microbiology, A. Méndez-Vilas (Ed.), Formatex, Badajoz, Spain (2007) pp. 239–339.
5. A. Pompei, L. Cordisco, A. Amaretti, S. Zanoni, D. Matte-uzzi, M. Rossi, Folate production by bifidobacteria as a po-tential probiotic property,Appl.Environ.Microbiol.73(2007) 179–185.
6. R.G. Crittenden, N.Z. Martinez, M.J. Playne, Synthesis and utilization of folate by yogurt starter cultures and probiot-ic bacteria,Int.J.Food Microbiol.80(2003) 217–222. 7. W. Sybesma, M. Starrenburg, L. Tijsseling, M.H.N.
Hoefna-gal, J. Hugenholtz, Effects of cultivation conditions on fo-late production by lactic acid bacteria,Appl.Environ. Mi-crobiol.69(2003) 4542–4548.
8. W. Sybesma, M. Starrenburg, M. Kleerebezem, I. Mierau, W.M. de Vos, J. Hugenholtz, Increased production of folate by metabolic engineering of Lactococcus lactis, Appl. Envi-ron.Microbiol.69(2003) 3069–3076.
9. G.E.P. Box, K.B. Wilson, On the experimental attainment of optimum conditions,J.Roy. Stat.Soc.B,1(1951) 1–45. 10. D.C. Montgomery, R.H. Myers: Response Surface
Methodo-logy: Process and Product Optimization Using Designed Expe-riments, John Wiley & Sons, Inc, New York, USA (1997) pp. 427–510.
11. N.N. Nawani, B.P. Kapadnis, Optimization of chitinase pro-duction using statistics based experimental designs, Pro-cess Biochem.40(2005) 651–660.
12. M.Y. Lin, C.M. Young, Folate levels in cultures of lactic acid bacteria,Int.Dairy J.10(2000) 409–413.
13. S. Sirisansaneeyakul, T. Luangipat, W. Vanichsriratana, T. Srinophakun, H.H.H. Chen, Y. Chisti, Optimization of lac-tic acid production by immobilizedLactococcus lactisIO-1, J.Ind.Microbiol.Biotechnol.34(2007) 381–391.
14. H.L. Foo, T.C. Loh, F.L. Law, Y.Z. Lim, C.N. Kufli, G. Ru-sul, Effects of feedingLactobacillus plantarumI-UL4 isolat-ed from Malaysian tempeh on growth performance, faecal flora and lactic acid bacteria and plasma cholesterol con-centrations in post-weaning rats,Food Sci.Biotechnol.12(2003) 403–408.
15. H.L. Foo, T.C. Loh, P.W. Lai, Y.Z. Lim, C.N. Kufli, G. Ru-sul, Effects of adding Lactobacillus plantarumI-UL4 meta-bolites in drinking water of rats,Pak. J.Nutr.2(2003) 283– 288.
16. B.E. Terzaghi, W.E. Sandine, Improved medium for lactic streptococci and their bacteriophages,Appl.Environ. Micro-biol.29(1975) 807–813.
17. J.C. De Man, M. Rogosa, M.E. Sharpe, Cultivation medium for lactobacilli,J.Appl.Biotechnol.21(1977) 130–135. 18. L. Rodrigues, J. Teixeira, R. Oliveira, H.C. van der Mei,
Response surface optimization of the medium components for the production of biosurfactants by probiotic bacteria, Process Biochem.41(2006) 1–10.
19. G.L. Miller, Use of dinitrosalycilic acid reagent for deter-mination of reducing sugar,Anal.Chem.31(1959) 426–428. 20. D.W. Horne, D. Patterson,Lactobacillus casei
microbiologi-cal assay of folic acid derivatives in 96-well microtiter pla-tes,Clin.Chem.34(1988) 2357–2359.
21. A.R. Berry, C.M.M. Franco, W. Zhang, A.P.J. Middelberg, Growth and lactic acid production in batch culture of Lac-tobacillus rhamnosusin a defined medium,Biotechnol.Lett. 21(1999) 163–167.
22. M. Rosfarizan, A.B. Ariff, M.A. Hassan, M.I.A. Karim, Kojic acid production byAspergillus flavususing gelatinized and hydrolyzed sago starch as carbon sources,Folia Microbiol. 43(1998) 459–464.
23. B. Bibal, G. Goma, Y. Vayssier, A. Pareilleux, Influence of pH, lactose and lactic acid on the growth ofStreptococcus cremoris: A kinetic study,Appl.Microbiol.Biotechnol.28(1988) 340–344.
24. M.S. Kalil, H.S. Alshiyab, W.M.W. Yusoff, Effect of nitro-gen source and carbon to nitronitro-gen ratio on hydronitro-gen
pro-duction usingC. acetobutylicum,Am.J.Biochem.Biotechnol. 4(2008) 393–401.
25. V.M.G. Lima, N. Krieger, M.I.M. Sarquis, D.A. Mitchell, L.P. Ramos, J.D. Fontana, Effect of nitrogen and carbon sources on lipase production by Penicillium aurantiogriseum, Food Technol.Biotechnol.41(2003) 105–110.
26. S.D. Todorov, L.M.T. Dicks, Effect of growth medium on bacteriocin production byLactobacillus plantarumST194BZ, a strain isolated from boza,Food Technol.Biotechnol.43(2005) 165–173.