Original scientific paper UDC: 339.137.2:519.85>(4-67 EU) doi: 10.18045/zbefri.2017.1.123
Contemporary approaches to measuring
competitiveness – the case of EU member states
*Alemka Šegota
1, Marko Tomljanović
2, Ivona Huđek
3 AbstractCompetitiveness represents a concept that has occupied a great deal of the economic theorists’ attention for decades. Due to its complexity and different perceptions, it has not been uniquely defined yet and neither has its measurement system been completely developed. The problem of the conducted research arises from the fact that the countries mostly due to structural and other constraints in the economy (or in cases where they have high levels of GDP) do not use the available inputs in the best way, i.e. they do not achieve a satisfactory level of economic efficiency, which is then reflected on the competitiveness of their economies. The aim of the research paper is to demonstrate how a combination of using Data Envelopment Analysis Method (DEA) and the Global Competitiveness Index (GCI) in ranking the countries according to the macroeconomic competitiveness is more realistic than it is in the case of using the traditional indicators. In the paper, in evaluating the competitiveness of selected EU Member States the Data Envelopment Analysis Method (DEA) is used. Based on the previous researches and our research results it is found that the traditional indicators of competitiveness are incomplete because they do not consider the macroeconomic efficiency of the country. Therefore, we propose to apply a combination of GCI and the efficiency results obtained by DEA in order to achieve a more realistic evaluation of macroeconomic competitiveness. As a key outcome of the research, the new measure of competitiveness is proposed: a combination of traditional competitiveness indicator and the results of the evaluation of countries’ macroeconomic efficiency obtained by applying BCC model of DEA method. Key words: Data Envelopment Analysis (DEA), EU, efficiency, inefficiency, macro-economic competitiveness
JEL classification: F00, F6
* Received: 26-03-2017; accepted: 31-05-2017
1 Associate professor, University of Rijeka, Faculty of Economics, Ivana Filipovića 4, 51000
Rijeka, Croatia. Scientific affiliation: mathematics, decision theory. Phone: +385 51 355 161. E-mail: alemka.segota@efri.hr.
2 Assistant, University of Rijeka, Faculty of Economics, Ivana Filipovića 4, 51000 Rijeka, Croatia.
Scientific affiliation: competitiveness, research and development, EU policy, international economy. Phone: +385 51 355 130. E-mail: marko.tomljanovic@efri.hr.
3 Student, University of Rijeka, Faculty of Economics, Ivana Filipovića 4, 51000 Rijeka, Croatia.
1. Introduction
Economic efficiency usually implies the realization of a higher level of output in the economy using existing and available levels of inputs. Therefore, as the most important output, the gross domestic product (GDP) is generally determined. The most common definition determines GDP as the value of final goods and services produced in the economy during a given period (Blanchard, 2005). The movement of the overall level of output in the economy is related to the movement of other key macroeconomic variables, where is necessary to stick out unemployment, wages and net public debt. According to Okun’s law, increasing of GDP growth is related to a reduction in the unemployment rate and vice versa, accordingly, it is possible to assess whether the economy functioning “under” or “over” their possibilities. In the case of economic expansion, unemployment decreases, while the growth of prices and wages starts (Samuelson and Nordhaus, 2011). The very sensitive area in the current post-crisis times represents the problem of public debt, which impacts on GDP, and it is analyzed in a number of papers. Thus, it is necessary to point out Stiglitz (2000) according to whom the increase in public debt tends to decrease total output and wages and Novotny (2008) who points out that countries with high levels of public debt have a weak competitive advantage in the international market. Furthermore, Braeuninger (2002) confirms that the increase in public debt slows economic growth. Aizenman et al. (2007) point out that in countries with high levels of public debt and GDP ratio, there is a slowdown in the activity of the national economy and the weakening of international competitiveness.
Modern business conditions have put great emphasis on investment in research and development and their products as one of the key factors to increase economic activity, efficiency and competitiveness of the national economy. Considerations about investments in research and development as a factor of economic growth began in ‘50s of the 20th century in the papers of neoclassical economists (Solow, 1956) and continued through considerations of the endogenous theory representatives (Romer (1986), Lucas (1988) Grossman and Helpman (1991), Aghion and Howitt (1992), etc.). A common feature of the overall development of scientific thought in this area comes from the “escalation of the fundamental ideas” according to which the investment in research and development in the very beginning was perceived as a “coincidence” i.e. by-product of corporate investments in physical capital. Further development of scientific thought “led” to the situation in which need of “conscious” investment in research and development was identified and actualized. That way of investment will ultimately resulted in new products and innovation and whose market commercialization will contribute to the achievement of economic growth and competitiveness, what is represented in the research of modern theorists.
According to Aghion et al. (2005), increased investment in research and development represents a factor of socioeconomic changes and response to globalization processes through the creation of science and technology policy in order to ensure
the competitiveness and efficiency of the economy. Also, Karaman Aksentijević and Ježić (2009), Švarc (2014), Bezić and Karanikić (2014) represent similar conclusions, where investments in research and development, the effectiveness of technology and innovation, foreign direct investment and the opening of the market, which is determined primarily by increasing the share of high technology products in total exports, are identified as key factors to achieve economic growth.
The research problem in this paper arises from the fact that the countries, mostly due to structural and other constraints in the economy, as well as in cases where they have high levels of GDP, do not use their available inputs in the “best way”, i.e. they do not achieve satisfactory level of economic efficiency, which reflects to the their competitiveness. In addition, the competitiveness of the economy is determined by the level of GDP per capita, wages, investment in research and development, unemployment, and public debt levels. The aim of this paper is to examine the possibility of using Data Envelopment Analysis (DEA) by evaluating the macroeconomic competitiveness of the EU member states. Therefore, this research paper intends to prove the main research hypothesis: EU countries which are ranked high by GCI are also those with the best DEA result of efficiency. Namely, the traditional indicators of competitiveness suggest that the level of macroeconomic competitiveness in the long term increases if the level of productivity increases. However, in the short term, it may not be valid. Furthermore, the level of GDP that each state has to realize as their potential is not always used efficiently, which ultimately affects the level of competitiveness. Therefore, in this paper, the new measure of competitiveness is proposed: a combination of traditional competitiveness indicators and the results of the macroeconomic efficiency of the states obtained by applying DEA. Furthermore, DEA allows projections of inefficient states on the efficient frontier which represents the potential changes that EU member states should implement in order to achieve relative efficiency, which should lead to greater competitiveness.
The paper consists of six interconnected parts. After introductory considerations, the overview of the theoretical and empirical aspects is provided and the key elements of competitiveness are identified. The research is continued by a detailed elaboration of the methodology and implementation of data envelopment method. In the fifth part of the paper, the results of the evaluation of competitiveness using the data envelopment method are presented. The paper ends with a conclusion in which the key findings of the research are presented.
2. Literature review
Competitiveness, in the last thirty years, has become one of the most frequently analyzed economic terms. Considering the complexity of the term, there is no unique definition and the attitudes about competition. Its fundamental characteristics
vary among authors. The competitiveness in the long term implies an increase in the level of economic efficiency and quality of production and services which is a key determinant of the long-term increase in living standards. However, the competitiveness depends on the costs and capabilities of enterprises to compete in the international and domestic market. In the short term, price trends, costs, wages and exchange rates significantly affect the level of productivity. As a key requirement of long-term increase in the competitiveness, many authors emphasize close cooperation between community, government, and society (Segler, 1986).
Fagerberg (1988) points out that in “competitive” countries the increase of living standards does not occur only as the result of an increase in real income, but also as the result of creating new jobs. Accordingly, the author defines competitiveness as the ability to achieve the main economic objectives, including growth in income and employment, but with the restriction or prevention of a current account deficit. According to Porter (1990), the international competitiveness of the country can be assessed based on two sets of indicators: the existence of a significant and lasting export in a number of different countries and significant investment in other markets which are based on the capabilities and resources created in their own country. Furthermore, the contemporary global economy is too complex and thus it is not explicable using traditional theories. New Porter’s theory of competitiveness is based on the assumption that national prosperity is created by the strategic choices, not inherited (Porter, 1990). According to Velloso (1991), the international competitiveness considers the ability of the country to maintain and increase the share of the national economy in the global market and, in the same time, to reach international standards of efficiency, successful exploitation of natural resources and adequate product quality. Moreover, the author considers that the international competitiveness of the country depends on its ability to export its products, efficiently exploits the natural resources and increases productivity, which ultimately affects the improvement of living standards. World Economic Forum
(2015)identifieson the macro level, such factors as export, government, financial, infrastructure, technology, labor and institutions, as key elements of the national competitiveness. Vedriš (2005) states that the achieved results in exports, as a rarely other indicator, determine the competitive ability of the national economy and emphasize that the ability to profitably export shows what the state of affairs is, and who in the area of competitiveness succeeds and who does not. Similar conclusions are also present in the paper of Taner et al. (2010).
Competitiveness can be defined at micro and macro level. Competitiveness at the micro level is usually equated with market success, i.e. with dynamics of the market share and its positioning on the quality scale. On the other hand, competitiveness at the macro level is a wider term that includes growth, quality of life and productivity. Some theorists (Krugman 1996, 1994) represent the extreme “view” according to which competitiveness is not applicable to countries’ level, but only
at the enterprise level. However, significant differences in economic developments across countries at a similar stage of economic development clearly indicate the existence of successful and less successful countries. However, the most important Krugman’s contribution to the competitiveness is the view that competitiveness considers the ability of the country to maintain the balance of payments in equilibrium while improving living standards.
Lane (1998) points out that international competitiveness is primarily explained by international trade theories (Adam Smith), therefore, the classical theory of global competitiveness is built on free trade. Arguments for free trade derive from comparative advantages (Ricardo) where the market, open to foreign suppliers strengthens the competition. However, as a continuation to previous researchers, Porter (1998) identifies the crucial importance of the efficiency of the national economy as the fundamental determinants of competitiveness presenting the starting point for the World Economic Forum, which definition is based on 11 factors of productivity.
Leko-Šimić (1999) differentiates international competitiveness in a broader and narrower sense. International competitiveness in the broader sense is based on the measurement and comparison of macroeconomic indicators and living standards with particular emphasis on productivity. On the other hand, international competitiveness in the narrower sense is defined as a country’s ability to export its products to the world market. In this case, companies from different countries should have the opportunity to participate in the global market on equal (fair) conditions in which their success or failure will determine the particular country as a competitive or non-competitive (Neslihan and Huseyin, 2012). However, Salvatore (2009) points out that, despite the best efforts of the World Trade Organization (WTO), the assumption of free and fair trade and equal position of all participants in the global marketplace is unrealistic.
Bienkowski (2008) defines competitiveness as the countries’ ability to achieve economic growth faster than other countries and to increase prosperity in a way that its economic structure is changing and effectively adapts to movement of
international trade.
In the past, countries’ development was based on comparative advantages, for example low labour cost and natural resources. However, in the modern business environment, international competitiveness stems from advanced factor conditions based on knowledge and “modern” infrastructure, high technology and innovation. Further, Lovrinčević et al. (2008) stand out that competitiveness determination in the modern business environment is heavily influenced by globalization. Consequently, competitiveness, according to its definition and characteristic, increasingly requires implementation of a global “world view” which arises from the need to compete with competitors from any part of the world. In such conditions, a focus on the sectors and
production of high added value is necessary. Therefore, Aiginger et al. (2013) point out that competitiveness considers the ability of a country or region to create high added value, ensure high levels of employment and improve the standard of living. Croatian National Competitiveness Council defines competitiveness as “country’s ability to achieve success on the international market, which enables a better standard of living for the entire population”. Competitiveness is the result of many factors, among which the competitiveness at the enterprise level and a favourable business environment that enables the introduction of new products, processes and investment, are found to be most important. Interaction of these factors provides productivity growth, higher income and sustainable development (www. konkurentnost.hr, 2015). Most frequent definition of international competitiveness is OECD’s according to which competitiveness is an ability of the country to, in free and equal market conditions, produce goods and services that previously pass the test of international markets, ensuring retention and long-term increase in the real income of the population (www.oecd.org, 2015).
The latest approach to competitiveness is provided by Djogo and Stanišić (2016) according to whom competitiveness means the ability of the country to maintain the balance of trade in free and fair market conditions, create jobs and provide an increase in income of the population. In doing so, the great emphasis have been put on satisfactory investment levels without increasing the levels of public debt and taking into account environmental objectives.
Competitiveness measuring methods as the theoretical approaches differ among authors. Trabold (1995) provides a detailed overview of the most important elements of competitiveness, with special emphasis on achievement and increasing disposable income usually measured by GDP growth. Furthermore, the author emphasizes the importance of the movement of exports and inflows of foreign direct investment (FDI). Taking into account current trends in a globalized society, Trabold (1995) points out that the ability of the economy to adapt, which reflects in the rapidity how the economy responds to the changing market conditions and recognizes new opportunities, cannot be covered just by one macroeconomic indicator. In the analysis that “ability”, is represented by data on the levels of investment in research and development. These indicators are integrated into a common category of “hard” indicators since they are available from the statistical surveys carried out in all countries. On the other hand, Lovrinčević et al. (2008) point out to the existence of so-called “soft” data based on the specially designed surveys. Such surveys measure factors of competitiveness that are not available from the standard statistical base, particularly the effectiveness and independence of the judiciary, the tendency to innovation, quality of corporate governance, corruption and the influence of the state on business in a particular country. These indicators are the result of the perception of the interviewed subjects on the current state of the economy. Research of Djogo and Stanišić (2016) was based on the
previous mentioned classification of competitiveness factors. Authors evaluate the competitiveness of European countries based on six key indicators, namely: the state of the balance of payments, unemployment rate, labour costs, external debt, the growth rate of GDP and the rate of investment.
Competitiveness rankings issued by international organizations causes the positions of the countries that change every year. As the most important competitiveness indicators stand out (Bezić, 2008): Global Competitiveness Index (GCI), World Competitiveness Index (IMD), World Bank’s Doing Business Index, Index of Economic Freedom (HF), Business Competitiveness Index and Export competitiveness indicators. Lovrinčević et al. (2008) point out that the researches of international institutions on the level of competitiveness according to use of access can be classified into two groups. The first group includes researches of World Economic Forum (WEF) and the International Institute for Management Development (IMD). In their analyses, the level of competitiveness of a country is ranked by the economic system (social and international relations), the role of state and institutional framework. The second group of researches (World Bank and Heritage) is focused on the features of the regulations related to business activities.
Based on previously analysed theoretical aspects of competitiveness, it is possible to perceive the complexity of this concept and the non-ability to provide unique and comprehensive definitions. Specifically, the long-term competitiveness of national economies affects a large number of economic and non-economic factors which varies in time and space. Consequently, the authors of this study perceive competitiveness as a country’s ability to realize continued economic growth, which ultimately contributes to increasing the well-being of the population assuming increasing employment and reducing and/or maintaining a stable level of public debt. Furthermore, in need of increasing exports, the country needs to adapt to the globalization trends placing more emphasis on the investments in research and development, increasing exports of high technology products and creating a favourable environment for the inflow of foreign direct investment.In the field of analysis of regional competitiveness using DEA method there are some very interesting papers. Charles and Zegarra (2014) proposed methodology based on DEA to measure and rank the competitiveness of all regions of Peru. They pointed out the versatility of the DEA method through advantages, which DEA has over other approaches as an extreme-point method, which does not require any assumption of a functional relation between inputs and outputs. Using BCC model they came to the results, which confirmed that the most competitive regions are those with the highest level of economic development.
Guan et al. (2006) examined the relationship between technological innovation capability and competitiveness using DEA. The traditional DEA model was employed and the results showed that only 16% of the enterprises operated on the –practice frontier. They also find some inconsistencies between organizational
innovation capability and competitiveness in many enterprises. Furthermore, a multi-objective DEA projection model provided a benchmark for auditing competitiveness. Research results indicate that there is much room for enterprises to improve competitiveness.
Halkos and Tzeremes (2007) using DEA investigated the effect of global strategies of the top 50 ICT multinationals and they established benchmarks, performances and key characteristics of multinational strategic behaviour in the ICT industry. The research results shows that there is higher rivalry among the competitors in communication and electronic/equipment segments. Furthermore, they found that the most efficient global strategies are adopted from the US and Japanese multinationals. Wei-Wen (2011) proposed solution of the competitiveness-ranking problem in travel and tourism by applying combination of DEA method, Grey system theory and artificial neural network as well as employing Borda count methodology to merge these rankings. He concluded that policy makers and stakeholders could arrive at better decisions than in the situation with just original rankings.
Staničkova and Skokan (2011) analysed the competitive potential of the EU countries through Data Envelopment Analysis (DEA) and found that this method is suitable for the evaluation of national competitiveness because it simultaneously evaluates a number of factors that determine the level of economic development. They used gross domestic expenditure on R&D, employment rate, gross fixed capital formation and the number of students of tertiary education as inputs, while GDP in purchasing power standards and labour productivity per person employed as outputs. In evaluating the efficiency of the countries, the basic models CCR and BCC were used and the following conclusion is drawn: the countries evaluated as inefficient according to the method are also, at the same time, those with less competitive potential. Staničkova and Skokan (2012) also evaluated numerical grades of efficiency of economical processes within 27 EU Member States during the period of time 2000-2010. They used the same four inputs and two outputs as in (2012) with CCR model and they concluded that applying DEA method presented a convenient way of comparing competitiveness on national level. They pointed out that EU made an effort to renew the foundations of its competitiveness through increasing its growth potential, productivity and efficiency. They concluded that EU must mobilize all its resources in order to achieve these objectives.
Melecky (2013) evaluated efficiency trend in the “old” 15 EU countries by DEA in reference years 2000-2011 by the Malmquist index. He pointed out that “The economy may be competitive but if the society and the environment suffer too much the country will face major difficulties. Therefore governments in the long run period cannot focus alone on the economic competitiveness of their country; instead they need an integrated approach to govern the country and focus on the broadest aspects affecting efficiency”. He concluded that competitiveness and
efficiency are complementary objectives and cannot be avoided in economic theory and practice.
Staničkova (2013) measured EU Member States efficiency changes over reference years 2000-2011 by CCR model and Malmquist Index. Based on factor analysis and DEA method she concluded that in evaluated countries there was a distinct gap between economic and social standards and that the most countries experienced decline in their performance because of economic crisis.
Stanković et al. (2014) applied DEA in determination of efficiencies of Serbian cities. Authors pointed out that effective and transparent local administration could be realized through the certification of the cities and that certification assumes the assessment of service and information quality for investors. The research results should indicate to authorities of cities possible ways of improving their position at the list of business environment.
Dzemydaite et al. (2016) evaluated Eastern and Central EU regions according to the efficiency level of innovation system by DEA. They used two outputs: gross domestic product in purchasing power parity per inhabitant and number of patents per inhabitant. The inputs were cumulative expenditures for research and development in purchasing power standard per inhabitant, human resources in science and technology and human capital employed in high technology and knowledge-intensive sectors. The analysis revealed different levels of innovation system efficiency in EU regions and they concluded that even regions spent a lot on R and D and have a lot of human capital it does not guarantee innovative products with higher value added.
3. Methodology
Data envelopment analysis (DEA) is a method based on linear programming. It measures the relative efficiency within a set of peer entities (decision making units, DMUs), which operate under similar conditions, converting multiple inputs into multiple outputs. The efficiency is defined as the ratio between the weighted sum of outputs and the weighted sum of inputs. If the ratio is equal to 1, then the DMU is relatively efficient (100%), otherwise its value is between 0 and 1 and represents inefficiency. Weights are not predetermined, but are assigned to each DMU by a method in a way that shows them in the best light to maximize the output and input ratio. Whereas the weights are not known in advance, DEA is appropriate in all situations when it is impossible or very difficult to determine their values. When evaluating efficiency, the possibility of considering multiple inputs and outputs as well as the fact that they do not have to be expressed in the same units of measurement is a significant advantage compared to parametric methods, which has resulted in a wide and varied application of DEA (Liu J.S. et al., 2013). It is
important to note that the efficiency of each DMU is calculated in relation to the other DMU within the set of all DMU and therefore it is a relative, not an absolute efficiency. Furthermore, DEA does not presume any functional form of converting inputs into outputs, which is an important advantage comparing to parametric methods, although it is assumed that the change in input affects the change in output.
In addition to the selection of inputs, outputs and set of DMUs to be evaluated, it is possible to choose the orientation of the model that will evaluate the effectiveness of each DMU in the direction of the input or output. More specifically, if the selected model is input orientated, then for each inefficient DMU it is necessary to establish to what extent and which of the inputs should be reduced in order to achieve a present level of outputs and relative efficiency. In the opposite orientation, it is necessary to establish for how much and which output should be increased at a given level of inputs to achieve a relative efficiency. This enables the projection on the efficient frontier of relatively inefficient DMUs which are under the frontier, while relatively efficient DMUs are on the efficient frontier. (Šegota, 2008). So, DEA allows us the identification of the amount and sources of inefficiency or distance from the frontier of efficiency for each inefficient DMU. If the projection of the inefficient DMU on efficient frontier is far from the actual or observed values, then the difficulties arise in terms of overcoming such a big difference. In this case, it would be desirable to make a projection on the efficient point that has inputs and outputs as close as possible to the observed values. Therefore, the reference set is used and it consists of those efficient DMUs, which inefficient DMUs should follow. Namely, in the reference set are those DMUs, which achieved the relative efficiency and because of similar values of inputs and outputs of relatively inefficient DMU, they could be compared. In addition, the most used, basic models of Data Envelopment Analysis will be represented: CCR and BCC model.
3.1. CCR model
As it has already been mentioned, one of the basic models of DEA, is CCR model, named after the initials of its authors: Charnes A., W. W. Cooper and E. Rhodes. Theoretical background of DEA that follows presents the cited review of basic definitions, theorems and procedures, without evidence. (Cooper et al., 2000: 23–50). The authors of the model indicate that the basic idea of the model lies in the facts that, after the formation of virtual inputs and outputs with the help of their respective weight, determine the weights that maximize their ratio. More specific: suppose we have the data on the n decision makers (DMU) which use the same m inputs xi (i = 1, 2, 3, ..., m) in order to realize the same s outputs yj (j =1, 2, 3, ..., s). The values of the weights of inputs (vi) (i = 1,..., m) and outputs ur (r = 1, ..., s) are not predetermined and it is necessary to solve the following problem fractional programming to obtain
max 0 20 2 10 1 0 20 2 10 1 ... ... m m s s x v x v x v y u y u y u + + + + + + = θ (1) (FP0) s.t. mj m j sj s j x v x v y u y u + + + + ... ... 1 1 1 1 ≤ 1 (j = 1,...,n) v1, v2, ..., vm ≥ 0 u1, u2, ..., us ≥ 0
The constraints mean that the ratio of virtual output vs. virtual input should be less than or equal 1 for every DMU. If the optimal value is θ* = max θ = 1, the DMU
being evaluated is efficient. Otherwise DMU is inefficient compared to the others
DMUs.
The above fractional program can be replaced with following linear program: (Cooper et al., 2000: 23–24.) max θ = μ1y10 + ... + μsys0 (2) s.t. υ1x10 + ... + υmxm0 = 1 (LP0) μ1y1j + ... + μsyjs ≤ vx1j + ... + vmxmj (j = 1,...,n) υ1 + ... + υm ≥ 0 μ1, μ2, ..., μs ≥ 0 Definition 1 (CCR- efficiency)
1. DMO0 is CCR-efficient if θ*= 1 and there exists at least one optimal (v*, u*) with v* > 0 and u* > 0.
2. Otherwise, DMO0 is CCR-inefficient.
Now, it is possible to conclude that θ* < 1 or θ* = 1 and in every optimal solution of
linear program LP0 there is at least one element of (v*, u*) equal to 0. It means that every DMU reaches efficiency score between 0 and 100%. The set of CCR-efficient DMUs is the reference set to the DMU0 and the set spanned by reference set is the efficient frontier of DMUo.
One of DEA advantages, comparing to the traditional methods, is that inputs and outputs do not have to be expressed in same kind of units. This is about in following theorem (Cooper et al., 2000: 24).
Theorem 1
The optimal values of max θ= θ* are independent of the units in which the inputs
CCR model can be expressed as linear program model in model in vector-matrix notation (Cooper et al., 2000: 43):
(LP0) max uy0 (3)
s.t. vx0 = 1 –vX + uY ≤ 0
v ≥ 0, u ≥ 0
The dual problem of (LP0) is:
(DLP0) min θ (4)
s.t. θx0 – Xλ ≥ 0 Yλ ≥ y0
λ ≥ 0
(DLP0) has a feasible solution θ =1, λ0 =1, λj =0 (j ≠ 0) and we can conclude that
0< θ* ≤ 1. The input excesses s– ∈Rm and the output shortfalls s+ ∈Rs are defined as
“slack” variables by: s– = θx0 – Xλ, s+ = Yλ – y
0 with s– ≥ 0, s+ ≥ 0 for any feasible solution (θ, λ) of (DLP0).
To discover possible input excesses and output shortfalls two-phase LP problem should be solved (Cooper et al, 2000: 44–47).
max ω = es– + es+ (5) s.t. s– = θ*x 0 – Xλ s+ = Yλ – y 0 λ ≥ 0, s– ≥ 0, s+ ≥ 0 where e = (1,...,1) so that e s– = Σm i=1s–i and e s+ = Σsr=1s+r . Definition 2 (Cooper et al., 2000: 45)
If optimal solution (θ*, λ*, s–*, s+*) of above LP satisfies θ* = 1 and slacks are zero,
then the DMU0 is CCR-efficient and θ* = 1, while all slacks are zero. Otherwise, the
DMU0 is inefficient.
Definition 3 (Cooper et al., 2000: 45)
DMU is fully efficient if and only if it is not possible to improve any input or output without worsening some other input or output.
Definition 4 (Cooper et al., 2000: 47)
For an inefficient DMU0 we define its referent set E0, by:
E0 = {j|λ*j > 0}, j ∈{1, ..., n}) (6)
And optimal solutions are now expressed as: θ*x0 = Σx
jλ*j + s–*, y0 = Σj∈E
0
yjλ*j – s+* (7)
The gross input improvement Δx0 and output improvement Δy0 can be calculated as Δx0 = x0 – (θ*x0 – s–*) = (1 – θ*)x0 + s–*, Δy
0 = s+* (8)
while the formula for improvement, called the CCR-projection follows as (Cooper et al, 2000:47):
xˆ0 = x0 – Δx0 = θ*x0 – s–* ≤ x
0, yˆ0 = y0 + Δy0 = y0 + s+* ≥ y0 (9)
3.2. BCC model
Banker-Charnes-Cooper model (BCC model) represents one of several variations of CCR model. It presumes variable returns-to-scale and its frontier has piece-wise linear and concave characteristics. Banker, Charnes and Cooper are 1984 presented in their paper model with production possibility set PB by (Cooper et al., 2000: 90):
PB = {(x, y)|x ≥ Xλ, y ≤ Yλ, eλ = 1, λ ≥ 0} (10)
where X = (xj) ∈Rm×n and Y = (yj) ∈Rs×n are the sets of input and output data,
λ ∈ Rn and e is row-vector with all elements 1. The BCC model differs from the
CCR model just in additional condition eλ = Σn
j=1λj = 1. Input-oriented BCC model evaluates efficiency of DO0 by solving LP: (Cooper et al., 2000: 91).
(BCC0) min θB (11)
s.t. θBx0 – Xλ ≥ 0
Yλ ≥ y0 eλ = 1
λ ≥ 0
where θB is scalar. The dual program is:
max z = uy0 – u0 (12)
(DBCC0) s.t. vx0 = 1
–vX + uY – u0e ≤ 0
where scalars z and u0 may be positive, negative or zero. The results of BCC model efficiency are higher than the results of CCR model because the difference in their efficiency frontiers. If we are not sure if it is a constant or variable returns-to-scale then it is recommended to estimate DMU by both models. If the results differ a lot we can conclude that BCC model is convenient because of variable-returns-to-scale. Otherwise, CCR model is recommended. We will continue with citation of definition about BCC-efficiency (Cooper et al., 2000: 92).
Definition 6
If an optimal solution (θB*, λ*, s–*, s+*) for (BCC0) satisfies θB* =1 and has no slack
(s–* = 0, s+*= 0), then the DMU0 is called efficient, otherwise it is BCC-inefficient.
4. Empirical data and analysis
This research paper is focused on the Global Competitiveness Index (GCI) which is the most used competitiveness indicator and which covers 138 countries. It is published in the Global Competitiveness Report (GCR) every year. This indicator of competitiveness is based on a number of indicators, wherein the survey indicators occupy about 2/3 of the total shares and statistical indicators occupy 1/3. GCI is based on three basic factors and 9 indicators. The calculation of the GCI includes the key factors: fundamental factors, factors of efficiency4
and innovation factors. Each of these factors has a number of relevant indicators which evaluation affects the determination of the final ranking of global competitiveness of individual countries (Tomljanović et. al, 2015). In addition, the competitiveness of the observed countries is more thoroughly evaluated, taking into account current researches, through a number of macroeconomic data: GDP per capita (US$), the growth rate of GDP (%), annual net earnings of workers (US$), the level of public debt (% of GDP), foreign direct investment (% of GDP), investment in research and development (% of GDP), unemployment rate (% of total population), exports of goods and services (% of GDP) and exports of high technology (% of total exports). Information on the competitive positions of individual countries are collected from reports on pages of World Economic Forum and the key macroeconomic data are collected from statistical base of the World Bank, Eurostat and AMECO’s.
Measuring the competitiveness of countries represents a challenging task, not only because the competition is still universally undefined term, but also because it takes into accounts the large number of indicators, which are, at the 4 Higher education, market efficiency and technological readiness
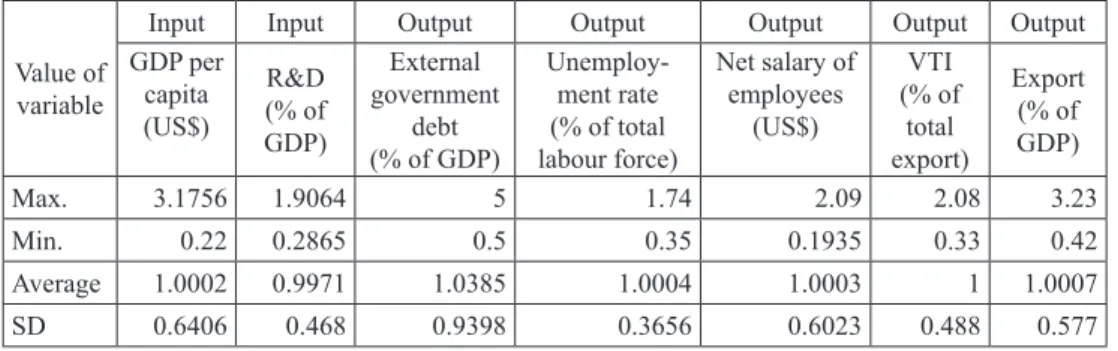
final evaluation, difficult to compare. Namely, a country can be highly ranked according to certain indicators, while according to the other can be ranked lower, and therefore the final evaluation in such cases is questionable. As previously stated, DEA provides the possibility to compare the units operating under similar conditions and takes into account the multiple inputs and multiple outputs, without presuming any functional form of converting inputs into outputs. An additional advantage of using DEA is that the inputs and outputs can be expressed in different units of measurement, which lead to the summary measure of efficiency that is appropriate when evaluating the competitiveness of countries. The first step in this study represented is the selection of a set of units or countries to be included in the analysis. Since the objective of this paper suggests a more realistic evaluation of Member States, the analysis included 26 of the 28 member states (since Cyprus and Malta did not have the relevant data) with the data for 2015. The next important step was a selection of inputs that each country should use in order to achieve the appropriate outputs. The use of the inputs forms the outputs, while it is important to achieve as much as possible economic effects (outputs) by using less inputs. The choice of used inputs and outputs was based on the previously mentioned research (for example: Vedriš (2005), Taner et al. (2010), Aizenman et al. (2007), Obadić (2005) and Rančić and Durbić (2016). Our assumption was that a country, which achieves greater efficiency, is also the one that is more competitive. For the inputs the amount of GDP per capita (in US$) and investments in research and development (% of GDP) are selected, while for the outputs are determined: the net salary of the employee (in US$), the share of high technology products in total exports (%), public debt (% of GDP), export (% of GDP) and unemployment rate (%). Namely, in the context of the application of DEA, GDP per capita of a country represents its potential. If it is efficiently used, a reduction in the unemployment rate and the level of public debt can be expected, while the salaries of employees and high-tech exports should grow. By increasing the investments in research and development, it can be expected the salary increase and exports of high technology products as well, while the unemployment rate and public debt should be reduced.
The increase in unemployment significantly slows the economic growth of the country and limits its competitive potential. Obadić (2005) states how unemployment as a limiting variable for achieving national competitiveness should be systematically reduced by increasing the quality of human resources, which was also highlighted in Rančić and Durbić’s work (2016). Since the DEA assumes that the increase of inputs increases the outputs, the unemployment rate and public debt of the countries are undesirable outputs. Namely, undesirable outputs should be as small as possible, and they (as shown in the case of Greece) are important indicators of the actual situation of the country, that is, the indicators of its competitiveness.
Table 1: Statistic on input and output variables in 2015 Value of
variable
Input Input Output Output Output Output Output
GDP per capita (US$) R&D (% of GDP) External government debt (% of GDP) Unemploy-ment rate (% of total labour force) Net salary of employees (US$) VTI (% of total export) Export (% of GDP) Max. 3.1756 1.9064 5 1.74 2.09 2.08 3.23 Min. 0.22 0.2865 0.5 0.35 0.1935 0.33 0.42 Average 1.0002 0.9971 1.0385 1.0004 1.0003 1 1.0007 SD 0.6406 0.468 0.9398 0.3656 0.6023 0.488 0.577
Source: Authors’ calculation
Table 1 presents the summary statistics of the inputs and outputs, while the correlation matrix is shown in Table 2. Variables used for inputs and outputs are prepared for application of DEA because of disparities between the countries especially GDP per capita and Net salary. The problem is solved by data standardization with procedure
of mean normalization.
Table 2: Correlation coefficients of input and output variables Variable
Input Input Output Output Output Output Output
GDP per capita (US$) R&D (% of GDP) External govern-ment debt (% of GDP) Unemploy-ment rate (% of total labour force) Net salary of employees (US$) VTI (%of total export) Export (%of GDP) GDP per capita (US$) 1 0.522 0.896 0.443 0.896 0.569 0.511 R&D (of GDP) 0.522 1 -0.192 0.544 0.657 0.308 -0.104 External government debt (% of GDP) -0.004 -0.192 1 0.175 -0.164 0.129 0.355 Unemploy-ment rate (% of total labour force) 0.443 0.544 0.175 1 0.424 0.526 0.243 Net salary of employees (US$) 0.896 0.657 -0.164 0.424 1 0.527 0.151 VTI (% of total export) 0.569 0.308 0.129 0.526 0.527 1 0.466 Export (% of GDP) 0.511 -0.104 0.355 0.242 0.151 0.466 1
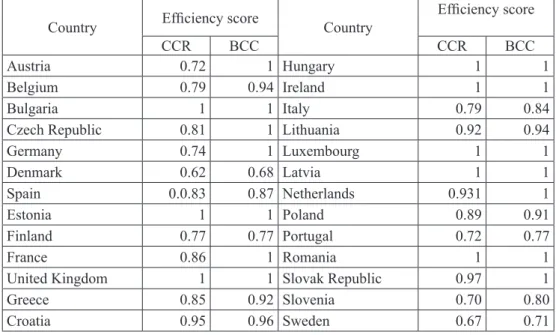
As shown in Table 3, the results of the relative efficiency of the countries using the CCR and BCC models are not similar. According to the CCR model, 8 countries are efficient, 18 countries are inefficient, while according to the BCC model, 14 countries are efficient and 12 countries are inefficient. It is possible to conclude that the BCC model is more representative than CCR model due to influence of variable returns to scale. In addition, the result of the efficiency of the EU member states will be examined according to the BCC model.
Table 3: Relative efficiency by CCR and BCC Model
Country Efficiency score Country Efficiency score
CCR BCC CCR BCC
Austria 0.72 1 Hungary 1 1
Belgium 0.79 0.94 Ireland 1 1
Bulgaria 1 1 Italy 0.79 0.84
Czech Republic 0.81 1 Lithuania 0.92 0.94
Germany 0.74 1 Luxembourg 1 1 Denmark 0.62 0.68 Latvia 1 1 Spain 0.0.83 0.87 Netherlands 0.931 1 Estonia 1 1 Poland 0.89 0.91 Finland 0.77 0.77 Portugal 0.72 0.77 France 0.86 1 Romania 1 1
United Kingdom 1 1 Slovak Republic 0.97 1
Greece 0.85 0.92 Slovenia 0.70 0.80
Croatia 0.95 0.96 Sweden 0.67 0.71
Source: Authors’ calculation
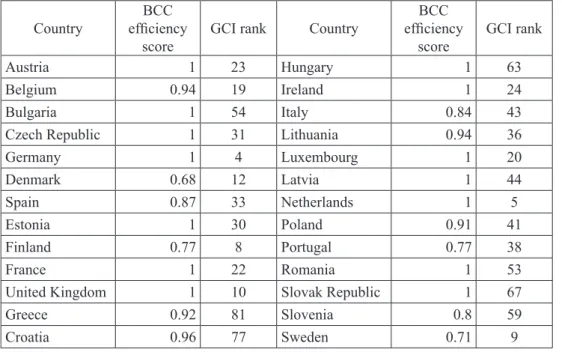
If we compare the results of the relative efficiency with the competitiveness index for 2015 (Table 4), it is possible to conclude that 14 of 26 observed countries is rated relatively efficient. Then, 4 countries which are evaluated as efficient are also relatively highly ranked by the competitiveness rankings and occupy the top 10 positions: Germany, United Kingdom, Netherlands and Sweden.
Table 4: Efficiency results for countries and indices of competitiveness
Country efficiency BCC
score GCI rank Country
BCC efficiency
score GCI rank
Austria 1 23 Hungary 1 63
Belgium 0.94 19 Ireland 1 24
Bulgaria 1 54 Italy 0.84 43
Czech Republic 1 31 Lithuania 0.94 36
Germany 1 4 Luxembourg 1 20 Denmark 0.68 12 Latvia 1 44 Spain 0.87 33 Netherlands 1 5 Estonia 1 30 Poland 0.91 41 Finland 0.77 8 Portugal 0.77 38 France 1 22 Romania 1 53
United Kingdom 1 10 Slovak Republic 1 67
Greece 0.92 81 Slovenia 0.8 59
Croatia 0.96 77 Sweden 0.71 9
Source: Authors’ calculation
Furthermore, among 26 countries 8 of them (Belgium, Finland, Germany, Denmark, UK, Luxembourg, Netherlands and Sweden) are identified as best-rated countries; they are in the top 20 according to GCI indicator of competitiveness. Of these 8 countries, just Belgium and Finland are evaluated as relatively inefficient by the Data Envelopment Analysis method which means approximately 75% efficient countries for this group of countries. In the second group of observed countries, which are ranked in the interval from 21st to 40th according to the GCI,
are 8 countries (Austria, Czech Republic, Estonia, France, Lithuania Ireland, Spain and Portugal). The inefficient countries are Spain, Lithuania and Portugal, while Austria, Ireland, Estonia France and the Czech Republic are relatively efficient. It can be concluded that for this group the share of efficient countries represents approximately 63% and suggests an expected decrease compared to the top 20 best-ranked countries. For the next group of countries best-ranked according to GCI indicator
from 41st to 60th place (Bulgaria, Italy, Latvia, Poland, Romania, Slovenia),
relatively efficient are rated 50%, Bulgaria, Latvia and Romania are relatively efficient. Remaining other four, observed countries ranked from 63rd to 87th place,
Greece and Croatia are evaluated as relatively inefficient, while Slovak Republic and Hungary are evaluated as efficient, which represents 50%.
DEA allows the determination of BCC projections on the efficient frontier in the case of inefficient countries. Data Envelopment Analysis allows also the
determination of the reference set for each inefficient country, which includes efficient countries that represent potential “models”.
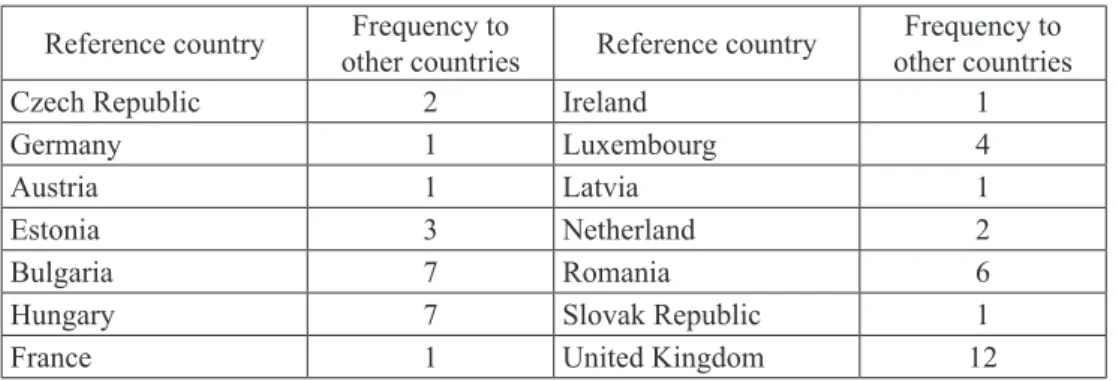
Furthermore, the evaluation of the relative efficient countries that are in the reference sets of individual inefficient countries is carried out (Table 5).
Table 5: Frequency of efficient countries in the reference set
Reference country other countriesFrequency to Reference country other countriesFrequency to
Czech Republic 2 Ireland 1
Germany 1 Luxembourg 4
Austria 1 Latvia 1
Estonia 3 Netherland 2
Bulgaria 7 Romania 6
Hungary 7 Slovak Republic 1
France 1 United Kingdom 12
Source: Authors’ calculation
Although the 14 countries are evaluated as efficient, United Kingdom is even 12 times in the reference set which indicates that the country is a leader of efficient countries. This is in line with its excellent position in the competitiveness rankings, which presents an additional motive for the inefficient countries for their efforts to improve their efficiency and thus achieve the macroeconomic competitiveness.
5. Results and discussion
Starting from Porter (1998) which argues that the country’s ability to achieve long-term economic growth and increase the standard of living depends on the level of efficiency in using available resources, this paper proposed the combination of the GCI and results of macroeconomic efficiency obtained by DEA methodology as a new measure of competitiveness.
Conducted research represents the upgrade on the findings of Djogo and Stanišić (2016) and it is based on assumptions of Stančikova and Skokan (2012) who analysed the potential competitiveness of the EU Member States using the DEA (CCR and BCC models). They determined that the inefficient countries are also those which have “lower” potential for achieving the competitiveness.
Djogo and Stanišić (2016) have already shown in their research that GCI is not reliable enough to measure the country’s competitiveness, because in the short-term
it is not certain whether the change in the production level through price competition will necessarily lead to the increase of the competitiveness. This conclusion comes from the time gap between the moment of change in the productivity and realization of macroeconomic effects that increase the competitiveness of countries. Furthermore, the authors have found out that a number of countries are overvaulted (Finland, Ireland, Iceland, Portugal, Spain) or undervalued (Russia, Turkey, Estonia, Moldova) according to the evaluation of macroeconomic competitiveness. Therefore, the authors suggest the application of their own 6 BIC model (together with GCI) in the evaluation of country’s competitiveness.
Since the above mentioned indicators do not consider the efficiency of using resources of the country, in this paper an additional indicator of the competitiveness is proposed and obtained by DEA method.
After the obtained results of the relative efficiency of countries according to the CCR (4) and BCC (12) models, it has been established that the BCC model is more suitable than CCR model since the number of efficient countries according to the both models is significantly different. Therefore, it is possible to conclude that variable returns to scale is present. By the insight into the previous research, it has been found out that in DEA applications in evaluating the macro efficiency of countries the undesirable outputs such as unemployment and public debt have not been considered so far. Namely, when evaluating the competitiveness of the country, special attention must be paid to the issue of public debt and unemployment which significantly “burden” the population and do not ensure an increase of living standard. The above mentioned can be seen in the example of Croatia. Although Croatia slowly comes out of the recession, it is still burdened by high levels of unemployment and public debt and low levels of salaries. Insufficiently competitive Croatia is according to the CCR model evaluated as inefficient macroeconomic country. Also, one of the unwanted consequences of this situation is the migration of young and educated labour force.
Based on theoretical and empirical research we proposed the way to improve the competitiveness ranking, as the step further comparing with estimating countries’ efficiency or productivity changes through Malmquist index as we found in several previous papers. Of the 26 observed countries, 14 countries were evaluated as relatively efficient (Austria, Bulgaria, Czech Republic, Germany, Estonia, France, United Kingdom, Hungary, Ireland, Luxembourg, Latvia, Netherlands, Romania and Slovak Republic) of which 8 countries are ranked among the top 30 according to the GCI (Austria, Germany, Estonia, France, United Kingdom, Ireland, Luxembourg and Netherlands). This case is about highly developed EU countries and such results have been expected. These are countries with high levels of inputs which these countries efficiently use in the realization of outputs (although some of them have above average unwanted output (public debt), for example Germany, Ireland, Hungary, and the United Kingdom and a lower unemployment rate, except Ireland).
Among the remaining efficient countries ranked above 30th place, Czech Republic is
ranked as 31st with below average levels of GDP per capita and only slightly above
the average investment in research and development. Czech Republic achieves a below-average level of net salaries of employees and above average export of high technology products, with below-average levels of public debt and relatively low unemployment rate. Hungary, in 63rd place, with below-average levels of inputs
achieves above-average results in exports of high technology products, but with a higher level of public debt, lower wages and a lower unemployment rate. Latvia,
in 44th place, with inputs of below-average levels achieves below-average outputs,
but with a lower level of public debt and unemployment rate. Romania, as well as Latvia, reaches efficiency with below-average levels of inputs, with lower public debt and unemployment rate and occupy53rd place. Besides the Czech Republic,
which has a slightly higher rate of investment in research and development, as well as GDP per capita, the other three countries are efficient due to lower levels of inputs used to achieve outputs. This means that for their better ranking it is necessary to raise the level of GDP per capita and the investments in research and development in order to achieve, with their efficient use, higher levels of net wages as well as the percentage of exports of high technology products.
On the other hand, 12 countries observed are rated inefficient, of which 4 (33%) are ranked in the positions higher from 30: Belgium, Denmark, Finland, and Sweden which according to the level of GDP per capita, investment in research and development and average wages of employees occupy outstanding positions and that is why the results of efficiency are surprising. Namely, it does not mean that these countries are not competitive but they could be more efficient in using their potentials. In general, the comparative analysis of 4 countries suggests that despite their great potential, the greatest limitations arise from the relatively high levels of public debt and below-average level of exports of high technology products, which should ultimately determine their efficiency and position in the global rankings of competitiveness. The obtained efficiency results (Table 3) indicate that the decision makers at the national level should pay special attention to raising the efficiency of using the resources of the country in order to reduce the unemployment rate, increase the salaries and reduce public debt. In addition, DEA allows the determination of efficient countries that may represent models for inefficient countries i.e. the reference set (Table 5). It means that the results of efficiency of some countries may represent the realistic goals for inefficient countries.
Based on the results of the research and regarding the contemporary trends in business and the necessity of achieving the knowledge economy, countries should consider and prioritize the providing of efficiency of exploitation of available resources (e.g. investment in research and development) in order to increase salaries and export competitiveness (primarily through the increased volume of high-technology products).
6. Conclusion
Based on the previous analysis, studies and results, it is possible to conclude that the ranking of countries on the scale of macroeconomic competitiveness according to the Global Competitiveness Index (GCI) is incomplete, because it does not consider the efficiency of the countries in using multiple inputs to achieve multiple outputs. Therefore, the paper recommends the application of Data Envelopment Analysis as suitable for evaluating the relative efficiency of the observed countries resulting in influencing the final ranking of countries. Namely, the efficiency of countries at the macro level influences their productivity and leads to an increase in their competitiveness in the long-term. Thus, main scientific contribution of this research derives from the fact that, with a combination of GCI indicators and the efficiency results obtained by DEA, the ranking of countries improves. Also, more realistic evaluations of macroeconomic competitiveness are expected, which represents a fundamental contribution to this research. Namely, the empirical results confirm that DEA scores including undesirable outputs as government debt and unemployment rate are more realistic because they calculate negative impact on the competitiveness. As we know, it is the first research in which undesirable outputs are included in analysis of competitiveness of EU member states. We found that not all developed and high ranked countries are also efficient in using their inputs as potentials. Furthermore, we found several less developed EU member countries relatively low ranked with the greatest efficiency score. In that way, the basic research hypothesis is partially proved. The justification for using this combination is in the fact that during the analysis the set of observed countries split into efficient, inefficient and those for which it is possible to conclude that they are “overvalued” or “undervalued”, and thus, their ranking should be further considered and analysed. This method of measuring the competitiveness may, in the perspective, be useful for decision makers at the country level in order to improve their position in the international “arena”. Furthermore, in view of increasing the competitiveness, decision makers should regularly evaluate the macroeconomic efficiency of their country by DEA to achieve and maintain its maximum level. In addition, this research has some shortcomings that are evident in the fact that the assessment of effectiveness performance is based on data from the past and that the evaluation of efficiency depends on a set of selected countries being evaluated. Moreover, it is about a relative, not an absolute efficiency. Another limitation of research is some highly correlated input/output data. Regardless of the restrictions, the advantages of using this method are numerous and thus justified. In the future researches, in the evaluation of the efficiency it would be useful to apply a categorical model of DEA, which would consider the differences among the EU countries and DEA window analysis through the period of time.
References
Aiginger, K., Barenthaler-Sieber, S. Vogel, J. (2013) Regional Competitiveness Under
New Perspectives, Brussels: European Commission, doi: 10.2139/ssrn.2685585.
Aghion, P., Howitt P. (1992) “A Model of Growth through Creative Destruction”,
Econometrica, Vol. 60, No. 2, pp. 323–351, doi: 10.2307/2951599.
Aghion, P., Bloom, N., Blundell, R., Griffith, R., Howitt, P. (2005) “Competition and Innovation: An Inverted-U Relationship”, The Quarterly Journal of
Economics, Vol. 120, No. 2, doi: 10.3386/w9269.
Aizenman J., Pinto, B., Radziwill, A. (2007) “Sources for financing domestic capital – is foreign saving a viable option for developing countries?”, Journal of International Money and Finance, Vol. 26, No. 5, pp. 682–702, doi: 10.2139/ ssrn.561045.
AMECO data site. Available at: http://ec.europa.eu/economy_finance/ameco/user/ serie/ResultSerie.cfm (Accessed: 21 January, 2017).
Banker R.D., Charnes A., Cooper W.W. (1984) “Some Models for Estimating Technical and Scale Inefficiencies in Data Envelopment Analysis”, Management
science, Vol. 30, No. 9, pp. 1078–1092, doi: 10.1287/mnsc.30.9.1078.
Braeuninger, M. (2002) “The Budget Deficit, Public Debt and Endogenous Growth”, Journal of Public Economic Theory, Vol. 7, No. 5, pp. 827–840, doi:
10.2139/ssrn.362940.
Blanchard, J.O. (2005) Makoekonomija/Macroeconomics, Zagreb: MATE.
Bezić, H. (2008) Tehnološka politika i konkurentnost/Technological Policy and
Competitiveness, Rijeka: University of Rijeka, Faculty of Economics.
Bezić, H., Karanikić, P. (2014) “Utjecaj inozemnih izravnih investicija i transfera tehnologije na gospodarski rast Republike Hrvatske”, Poslovna izvrsnost, Vol. 8, No. 1, pp. 27–48.
Bienkowski, W. (2008) “How much are studies of competitiveness worth? Some critical theoretical reflections on the issue”. In Papers from the Second Lancut Economic Forum, Lancut, Poland, doi: 10.4324/9780203892527.ch8.
Charles V., Zegarra L.F. (2014) “Measuring regional competitiveness through Data Envelopment Analysis: A Peruvian case”, Expert Systems with Applications, Vol. 41, No. 11, pp. 5371–5381, doi: 10.1016/j.eswa.2014. 03.003.
Charnes A., Cooper W.W., Rhodes E. (1978) “Measuring the Efficiency of Decision Making Units”, European Journal of Operational Research, Vol. 2, No. 6, pp. 429–444, doi: 10.1016/0377-2217(78)90138-8.
Cooper, W., Seiford, L., Tone, K. (2000) Data Envelopment Analysis, A Compre -hensive Text with Models, Applications, References and DEA-Solver Software, Kluwer Academic Publishers, Boston.
Djogo, M., Stanisic, N. (2016) “Is the Global Competitiveness Report the right measure of macroeconomic competitiveness”, Zbornik radova Ekonomskog
fakulteta u Rijeci: časopis za ekonomsku teoriju i praksu/Proceedings of Rijeka Faculty of Economics: Journal of Economics and Business, Vol. 34, No. 1, pp. 91–117, doi: 10.18045/zbefri.2016.1.91.
Dzemydaite G., Dzemyda I., Galiniene B. (2016) “The Efficiency of Regional Innovation Systems in New Member States of the European Union: A Nonparametric DEA Approach”, Economics and Business, Vol. 28, No. 1, pp. 83–89, doi: 10.1515/eb-2016-0012.
Halkos, G. E., Tzeremes, N.G. (2007) “International Competitiveness in the ICT Industry: Evaluating the performance of the top 50 Companies”, Global Economic Review, Perspectives on East Asian Economies and Industries. Vol. 36, No. 2, pp. 167–182, doi: 10.1080/12265080701374115.
Eurostat data site. Available at: http://ec.europa.eu/eurostat/tgm/table.do?tab=table &init=1&language=en&pcode=tin00140&plugin=1 (Accessed: 21 January, 2017), http://ec.europa.eu/eurostat/web/science-technology-innovation/data/database (Accessed: 21 January, 2017).
Fagerberg, J. (1988) “Industrial Competitiveness”, The Economic Journal, Vol. 98, No. 391, pp. 355–374, doi: 10.2307/2233728.
Grossman G.M., Helpman E. (1991) Innovation and Growth in the Global Economy, Cambridge: MIT Press.
Guan, J.C., Yam, R.C.M., Chiu, K.M., Ning, M. (2006) “A study of the relationship between competitiveness and technological innovation capability based on DEA models”, European Journal of Operational Research, Vol. 170, No. 3, pp. 971–986.
Karaman Aksentijević, N., Ježić, Z. (2009) “Human resources development and research capacity and their impact on economic growth”, Zbornik radova Ekonomskog fakulteta u Rijeci: časopis za ekonomsku teoriju i praksu/ Proceedings of Rijeka Faculty of Economics: Journal of Economics and Business, Vol. 27, No. 2, pp. 263–291.
Krugman, P. (1994) “Competitiveness: A Dangerous Obsession”, Foreign Affairs, Vol. 73, No. 2, pp. 28–44, doi: 10.2307/20045917.
Krugman, P. (1996) “Making Sense of the Competitiveness Debate, International Competitiveness”, Oxford Review of Economic Policy, Vol. 12, No. 3, pp. 17–25,
doi: 10.1093/oxrep/12.3.17.
Lane, P. (1998) “World trade survey: Why trade is good for you?”, The Economist, pp. 4.
Leko-Šimić, M. (1999) “Međunarodna konkurentnost hrvatskog gospodarstva u okruženju tranzicijskih zemalja srednje i istočne Europe”/“International Competi
-tiveness of the Croatian Economy in the Environment of Transition Countries of Central and Eastern Europe”, Market – Tržište, Vol. 11, No. 10, pp. 77.
Liu, J.S., Lu, L.Y.Y., Lu, W., Lin, B.J.Y. (2013) “A survey of DEA applications”,
Lovrinčević, Ž., Mikulić, D., Rajh, E. (2008) “Comparison of Methodologies for measuring National Competitiveness – Competitive Position of Croatian Economy”, Ekonomski pregled-Economic Review, Vol. 59, No. 11, pp. 603–645. Lucas R.E. (1988) “On the mechanics of economic development”, Journal of Monetary
Economics, Vol. 22, No. 1, pp. 3–42, doi: 10.1016/0304-3932(88)90168-7.
Melecky, L. (2013) “Use of DEA Approach to Measuring Efficiency Trend in old EU Member States”. In Proceedings of the 11th International conference
Liberec economic forum 2013, 16-19 September, Sychrov, Czech Republic, Liberec: Technical University of Liberec, pp. 381–391.
Neslihan, A., Hüseyin, T. (2012) “Defining and Measuring Competitiveness: A Comparative Analysis of Turkey with 11 Potential Rivals”, International Journal of Basic and Applied Sciences IJBAS-IJENS, Vol. 12, No. 2, pp. 31–43. National Competitiveness Council in Republic of Croatia (2015), Available at:
http://www.konkurentnost.hr/Default.aspx?sec=36 (Accessed: 21 May, 2017). Novotny, D. (2008) “Javni i vanjski dug RH: utjecaj na ekonomski rast, stvaranje
novih ekonomskih struktura i održivo upravljanje”/“Public and external debt of the Republic of Croatia: the impact on economic growth, the creation of new economic structures and sustainable management”, Ekonomija/Economics, Vol. 14, No. 2, pp. 365–378.
Obadić, A. (2005) “Koordinacija ekonomskih politika i fiskalni kriteriji konver-gencije u procesu proširenja EU”/Coordination of economic Policies and fiscal Convergence Criteria in EU Enlargement Process, Zbornik Ekonomskog fakulteta u Zagrebu/Proceedings of the Faculty of Economics and Business in
Zagreb, Vol. 3, No. 1, pp. 55–73.
OECD (2015), Available at: http://www.oecd.org/(Accessed: 21 May, 2017).
Porter, M.E. (1990) The Competitive Advantage of Nations, New York: The Free Press.
Porter, M.E. (1998) The Competitive Advantage: Creating and Sustaining Superior
Performance, New York: The Free Press.
Rančić, N., Durbić, J. (2016) “Uzroci nezaposlenosti i utjecaj na smanjenje neza-poslenosti kroz institucionalno-strukturne reforme u Republici Hrvatskoj”/
“Causes and measures for combating unemployment in Croatian labour market”, Pravnik – časopis za pravna i društvena pitanja, Vol. 50, No. 100, pp. 39–54. Romer, P.M. (1986) “Increasing Returns and Long-Run Growth”, The Journal of
Political Economy, Vol. 94, No. 5, pp. 1002–1037, doi: 10.1086/261420.
Samuelson, P.A., Nordhaus, W.A. (2011) Ekonomija, Zagreb: MATE.
Segler, K. (1986) Basis strategien in internationalen Marketing, Frankfurt: Campus Verlag.
Solow, R.M. (1956) “A contribution to the theory of economic growth”, Quarterly Journal of Economics, Vol. 70, No. 1, pp. 65–94, doi: 10.2307/1884513.