CHARACTERISTICS OF HELMET USE AND
Jln. Let.Jen. S. Parman No.1Jakarta 11440 Jln. Let.Jen. S. Parman No.1
Jakarta 11440 Telp:(021)5672548 ext 331
Abstract
In recent years the use of motorcycle increase drastically in Indonesia. Most of the accident in Indonesia was motorcycle related. Therefore the attention of protecting the riders through promoting compliance to the helmet use and the maximum number of riders per motorcycle is required. This present study is intended to observe the characteristics of helmet use and motorcycle occupancy in Jakarta. Data collection was made on Tuesday (representing normal working days) and Saturday (representing weekend). Each day the observation was carried out in three periods (morning, noon and afternoon) and each period consists of two hours. Traffic count for other vehicle types (light vehicle and heavy heavy vehicle) was also done to allow V/C analysis as a proxy of riders awareness of possible police enforcement. The result shows that about 85% of the riders and passengers wore helmet and less than 2% of motorcycle occupancy was exceeding maximum number of riders.
Key Words: mototcyele use, accident, helmet use, motorcycle occupancy, Jakarta
INTRODUCTION
PREVIOUS STUDIES
In terms of the relationship between red light violation rate and V/C as a proxy to riders awareness on police enforcement, Putranto and Sucipto (2007) found that the higher the V/C the lower the percentage of motorcycliests red light vioation by keep passing the stop line after red and the lower the V/C the higher the higher the percentage of motorcyclists red light violations by passing the stopline before green. As a consequences, motorcyclists red light violations by keep passing the stopline after red were more dominant in the early morning observation period, whilst motorcyclists red light violations by passing the stopline before green were more dominant in the other observation periods (morning, noon and afternoon).
In terms of the characteristics of helmet users, Putranto, Pramana and Kurniawan (2006) found that motorcylist who always use helmet in every ride, tend to be more careful in riding and felt annoyed by reckless riders. They also tend to always bring their riding license in every ride.
METHODOLOGY OF DATA COLLECTION
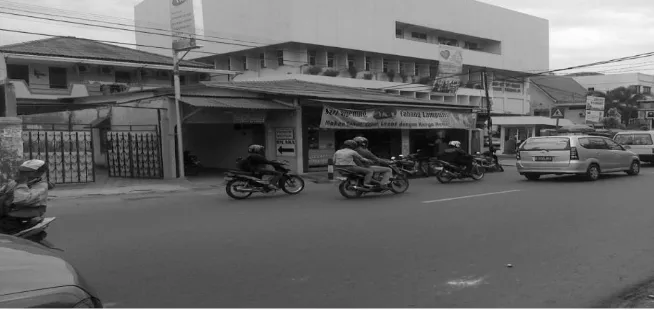
Data collection was made on Tuesday, 5 April 2011 (representing normal working days) and Saturday, 26 March 2011 (representing weekend) by video recording. The observation site is in two-lane two-way road in Rawa Belong, West Jakarta near a large private university campus shown in Figure 1. The choice to observe two-lane two-way road is to minimize the complication of video observation. The reason to choose the site was to ensure availability of moderate traffic flow with various travel purposes within reasonable distance from the surveyors residence.
Figure 1 Observation Site
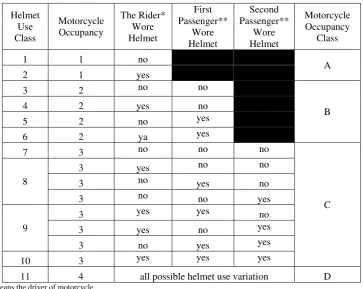
on-desk observation to allowed counting in 15 minutes period. For the purpose of helmet use and motorcycle occupancy classification following table was used:
Table 1 Classification of Helmet Use and Motorcycle Occupancy
Helmet
** In the case of motorcycle occupancy class B the first passenger was obviously the only passenger riding behind the rider. In the case of motorcycle occupancy class C, the first passenger was a little kid sat in front of the rider or a passenger riding behind the rider. The remaining passenger called the second passenger
Traffic count for overall traffic was also grouped into 15 minutes period of observation. This was to allow correlation analysis between helmet use, motorcycle occupancy and V/C.
METHODOLOGY OF DATA ANALYSIS
The analysis consists of the following:
T-test of difference between mean percentage per helmet use class based on days and based on periods of the day.
T-test of difference between mean percentage per motorcycle occupancy class based on days and based on periods of the day.
Pearson correlation analysis between V/C and percentage per helmet use class.
Pearson correlation analysis between V/C and percentage per motorcycle occupancy class.
RESULTS
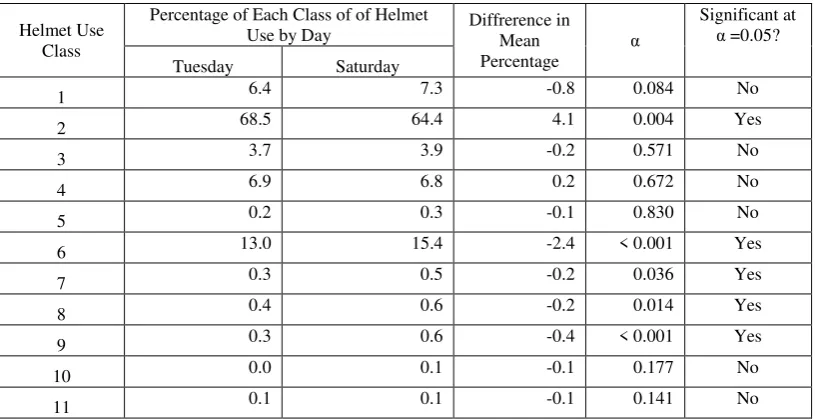
In general about 85% of the observed riders and passengers wore helmet and only less than 2% of observed motorcycles occupied by 3 or more riders/ passengers. Table 2 shows that mean percentages of helmet use class 6,7,8,9, on Tuesday were lower than on Saturday and significant at α=0.05 whilst mean percentage of helmet use class 2 on Tuesday was higher than on Saturday and significant at α=0.05.
Table 2 Comparison of Mean Percentage of Each Class of of Helmet Use between Tuesday and Saturday
Helmet Use Class
Percentage of Each Class of of Helmet
Use by Day Diffrerence in Mean higher than on Saturday and significant at α=0.05 whilst mean percentage of motorcycle occupancy classes B and C on Tuesday were lower than on Saturday and significant at
α=0.05.
Tabel 3 Comparison of Mean Percentage of Each Class of of Motorcycle Occupancy between Tuesday and Saturday
Motorcycle Occupancy
Class
Percentage of Each Class of of
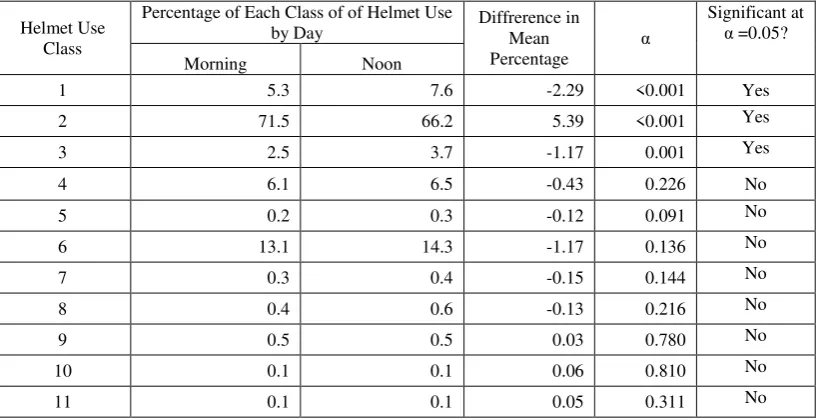
Table 4 Comparison of Mean Percentage of Each Class of of Helmet Use between Morning and Noon
Helmet Use Class
Percentage of Each Class of of Helmet Use
by Day Diffrerence in Mean
Table 5 shows that mean percentage of motorcycle occupancy class A, in the morning was
higher than at noon and significant at α=0.05 whilst mean percentage of motorcycle
occupancy class B, in the morning was lower than at noon and significant at α=0.05.
Tabel 5 Comparison of Mean Percentage of Each Class of of Motorcycle Occupancy Between Morning and Noon
Motorcycle Occupancy
Class
Percentage of Each Class of of Motorcycle
Occupancy by Day Diffrerence in Mean
Table 6 shows that mean percentages of helmet use class 1, 3, 4, 5, 6 and 7 in the morning were lower than in the afternoon whilst mean percentage of helmet use class 2 in the morning was higher than in the afternoon. All significant at α=0.05.
Table 7 shows that mean percentage of motorcycle occupancy class A, in the morning was higher than in the afternoon and significant at α=0.05 whilst mean percentage of motorcycle occupancy class B, in the morning was lower than in the afternoon and
significant at α=0.05.
Table 6 Comparison of Mean Percentage of Each Class of of Helmet Use between Morning and Afternoon
Helmet Use Class
Percentage of Each Class of of Helmet Use by Day
Tabel 7 Comparison of Mean Percentage of Each Class of of Motorcycle Occupancy Between Morning and Afternoon
Motorcycle Occupancy
Class
Percentage of Each Class of of Motorcycle
Occupancy by Day Diffrerence in Mean Percentage
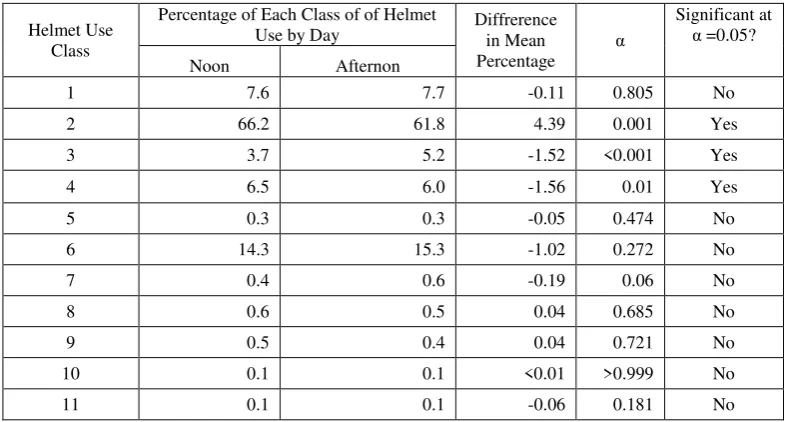
Table 8 Comparison of Mean Percentage of Each Class of of Helmet Use between Noon and Afternoon
Helmet Use Class
Percentage of Each Class of of Helmet
Table 9 shows that mean percentage of motorcycle occupancy class A, at noon was higher than in the afternoon and significant at α=0.05 whilst mean percentage of motorcycle occupancy class B, at noon was lower than in the afternoon and significant at α=0.05.
Tabel 9 Comparison of Mean Percentage of Each Class of of Motorcycle Occupancy Between Noon and Afternoon
Motorcycle Occupancy
Class
Percentage of Each Class of of
Motorcycle Occupancy by Day Diffrerence in Mean Percentage
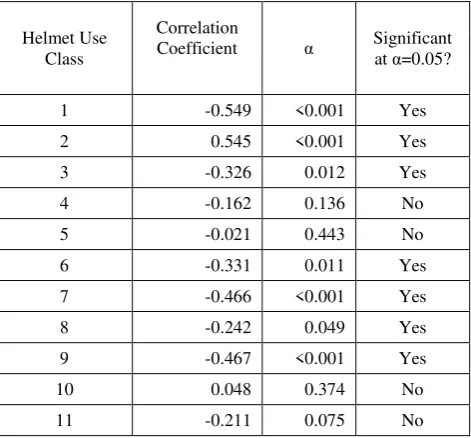
Table 10 shows that the higher the V/C the lower the percentages of helmet use class 1, 3, 6, 7, 8 and 9 and the higher the percentage of helmet use class 2. All significant at α=0.05.
Table 10 Pearson Correlation between Percentage of Helmet Use Class and V/C
Helmet Use Class
Correlation
Coefficient α Significant at α=0.05?
1 -0.549 <0.001 Yes
Table 11 shows that the higher the V/C the lower the percentages of motorcycle occupancy class B and C and the higher the percentage of motorcycle occupancy class A. All significant at α=0.05.
V/C
Motorcycle Occupancy
Class
Correlation
Coefficient α Significant at α=0.05?
A 0.452 0.001 Yes
B -0.386 0.003 Yes
C -0.543 <0.001 Yes
D -0.211 0.075 No
CONCLUSIONS
From the result in general most of the observed motorcycles (73.6%) were single occupancy. This implies that although its passenger car unit is small, as the general occupancy is less then two persons, this mode of transport is far from efficient in terms of effective use of road space due to its low occupancy rate. Moreover the higher the V/C the higher the perecentage of single occupancy motorcycle and the lower the percentages of multiple occupancy motorcycles and consequently percentage of single occupancy motorcycle was higher in weekday compare to weekend and morning period compare to other periods.
About 85% of the riders/ passengers in observed motorcycles wore helmet. Higher motorcycle occupancy decrease compliance to helmet use. For single occupancy the compliance rate was 91%, for dual occupancy the compliance rate was 71% and for motorcyle occupide by three riders/ passengers the compliance rate was 46%. This implies that multiple occupancy tend to decrease compliance to helmet use and should be the target of helmet use campaign. Regarding the use of V/C as a proxy to awareness of police enforcement, the only clear relationship is in single occupancy motorcycle. i.e. the higher the V/C, the higher the percentage of helmet use class 2 (the rider wore helmet) and the lower the percentage of helmet use class 1 (the rider did not wear helmet)
RECOMMENDATIONS
Further research is required to provide better understanding on the reason behind helmet use and choice of motorcycle occupancy. Interview based data collection would be needed.
REFERENCES
_____ (1997). Indonesian Highway Capacity Manual. Directorate General of Highways, Ministry of Public Work.
Putranto, L.S., Setyarini, N.L.P.S.E. (2011). Vehicle Composistion and Lane Distribution in Multilane Highways in Indonesian Cities. Proceeding of 6th International Symposium on Highway Capacity and Quality of Services. Stockholm: Elsevier. Putranto, L.S., Sucipto, R. (2007). Red Light Violation by Motorcyclist at a Signalized