Sugarcane Leaf Color Classification in Sa*b* Color
Element Composition
R V Hari Ginardi, Riyanarto Sarno, Tri Adhi Wijaya
Department of Informatics, Faculty of Information TechnologyInstitut Teknologi Sepuluh Nopember Surabaya, Indonesia
Abstract— This research introduces a new approach in a color management for leaf color assessment. Currently, a RGB, HSV or LAB is used as a 3-D color space where color similarity can be evaluated by examining the closest distance of two colors, where each color is composed by three color elements. Saturation (S) element from HSV color space is chosen, combined with a* and b* elements from La*b* color space to represent a new color combination named Sa*b*. This combination has a strong representation of color spectrum which is important for color assessment in various lighting condition or various sensor. A transformation from a RGB color space to Sa*b* is optimized with a Backpropagation Neural Netwok.
The proposed method is suitable for leaf color assessment with various lighting conditions and different camera specifications. It gives an accuracy of color determination as high as 92 percent. This leaf color assessment is introduced to sugarcane growth monitoring as a part of sugarcane precision agriculture. This method can also be used to initialize a lef color chart for each variety of sugarcane.
Keywords— sugarcane precision agriculture, leaf color assessment, color
I. INTRODUCTION
The increase of sugar production is needed to meet the more increasing consumption of sugar. One of the most important contributors of sugar production is the sugarcane agriculture. Therefore, strategic steps with incorporating new technologies in precision sugarcane agriculture are required. An accurate determination of harvesting and fertilizing time, for example, is considered as a key factor for production increase. This step can be conducted by determining the level of nutrition within the certain period during the crop growth of sugarcane. The concentration of chlorophyll and nitrogen in a sugarcane leaf can be used as an important indicator of the nutrition facts. Currently, it is measured using a chlorophyll meter, or estimated using satellite imagery approach. Both of those methods have their limitation since the implementation can be done by the researcher or laboratory only.
Determining the concentration of chlorophyll or nitrogen or other substances by examining leaf color has been introduced in rice agriculture with the implementation of a Leaf Color Chart (LCC), a standard of leaf color issued by International Rice Research Institute (IRRI). Farmers can easily assess their crop plantation by visually examining the leaf color using LCC. This approach is considered to be implemented also in sugarcane plantation.
The assessment of the sugarcane leaf color using above mentioned visual approach is not commonly applied since there are many sugarcane species and varieties with their own color specification. Each sugarcane variety required one specific Leaf Color Chart (LCC) and specific assessment rules depend on its growth model. A computer assisted system to assess leaf color and determine leaf color accurately is considered as a new approach to support farmers in maintaining their sugarcane production.
Smartphone is one of developments of cellular phones equipped with a better technology compared to the ordinary ones - for example by the existence of the camera features and computing capability. The acquisition of the sugarcane leaf color can be carried out using a smartphone camera. According to the Indonesian Statistics (locally called BPS or Badan Pusat Statistik) in the period of 2008 – 2011, the number of cellular-phone users is continually increasing. In 2008, the number of the cellular phone users reached 51.99% of the total population, and increased to 61.84% in 2009. Following this, the number is continuously increased to 72.01% in 2010 and 78.96% in 2011[1].
Usually, an image which is captured using a smartphone camera is saved in a JPEG formatted image file using RGB color space. This color space is suitable to be used on most cameras and computer monitors but it is not representing the response value of human sight [2]. Furthermore, the color differences cannot be compared directly in the RGB color space. For this reason, a transformation from RGB space, to a better color space is required. Two color space candidates which are commonly used in a comparison of colors are La*b*
and HSV [3].
La*b* color space, also known as CIELAB or CIE1976 was introduced in 1976, based on the color receptors to human sight [2]. It has been used in computerized colorimeter and spectrophotometer-two apparatus that have been commercially sold for years and evidently provide a constant analysis result but not correlated to the high accuracy [4]. In order to increase the accuracy in transformation of color space, various methods have been done. Leon et al. [5] conducted a research on the transformation of RGB color space to La*b* using a number of methods including linear, quadratic, gamma, direct and Artificial Neural Network. This research uses Artificial Neural Network to reduce the error of the transformation.
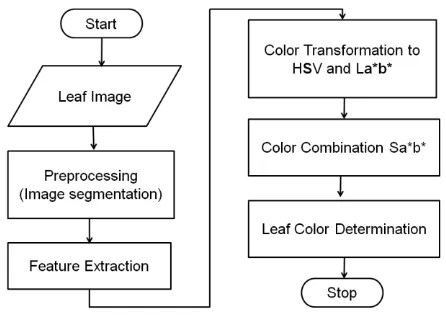
Fig. 1. System Diagram
Fig. 2. Sample of research dataset
color space [7]. This separation is used in the computer vision for many purposes, including the shadow removal.
In a research of Tam et al. [3], La*b* color space was combined into HSV color space resulting in a combination of
Sa*b* color elements. This combination, in turn, is used to match the color having shadow in the matching process of teeth color and it is proved that it is accurate. However, the combination of the elements is not tested for the domain of other researches and has no any detail explanation for the reasons of why the combination of Sa*b* elements could result an accuracy in color matching.
In this research, the combination of Sa*b* color elements which is optimized with back-propagation network in the determination of the level of the sugar cane leaf color is proposed. To evaluate the performance of the color analysis using this color elements combination, accuracy will be evaluated.
The following section 2 describes the design part of this new method in leaf color assessment, including the literature studies. Test scenario, dataset preparation, system testing, analysis, and evaluation are presented in section 3, while discussion about conclusions is given in section 4.
II. METHOD
A. System Flow
The following Figure 1 presents research steps in general. The proposed system consists of five core parts: image preprocessing, feature extraction, transformation of RGB to
HSV, transformation and optimization of RGB to La*b*, the formation of a combination of Sa*b* color elements and the determination of the leaf color level.
B. Dataset Collection
The image used in this research is a collection of the images of the sugarcane leaf color level taken from ten conditions of various image records. The creation of these conditions is aimed to test the reliability of determination towards the sugar cane color level using the combination of
Sa*b* color elements optimized with back-propagation
network. Figure 2 presents the dataset sample. The image was recorded using a 8-megapixel Android smartphone camera. The simulation of the proposed system was conducted using Matlab R2010a.
C. Image Preprocessing
Firstly, a manual cropping process was conducted for each captured image of sugar cane leaf. A further preprocessing step was the removal of over reflection in image using a thresholding. As commonly occurred in a captured image using a digital camera, the image of the sugar cane leaf may have a shading effect as a result of an over reflection for the use of flashlight or the difference in illumination. The value of the threshold in this experiment was set to 230. In this process, the image was initially changed into an 8-bit grayscale image. Pixels with the brightness value above this threshold is considered as over reflection, and they were not be used in further process.
D. Feature Extraction
The next preprocessing step was the examination of the color distribution in the image by to dividing the image into the several region blocks. Here, the image was divided into a number of m x n regions, where the value m and m wereset to 5 and 2 respectively. The feature extraction was conducted to acquire a single RGB color value of each region block by calculating the mean value of RGB colors from the image in each region block.
E. Transformation of RGB to HSV
This transformation is defined through the following equations [3]:
where:
R
G
B
L / a* / b*
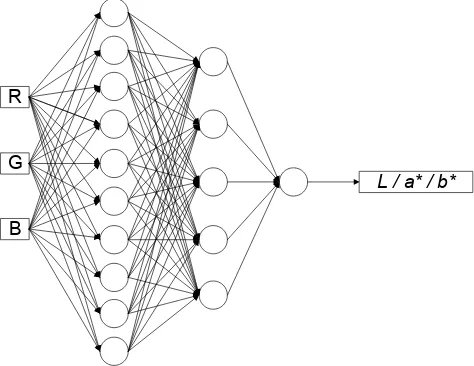
Fig. 3. The Architecture of back-propagation network in this research
F. Transformation and Optimization of RGB to La*b*
In this phase, back-propagation network was used to do the transformation and optimization of RGB to La*b*. Figure 3 shows the architecture of back-propagation features which are used in this research.
To form the target value of back-propagation network, the
La*b* values of the original and digital-formed leaf color level image were firstly calculated using direct model method. This was then followed by training the back-propagation network using the values of RGB of the sugarcane leaf color level image based on the recording result of the capturing in an ideal condition.
The transformation phase of RGB values to La*b* values using the direct model method was divided into two central phases: a transformation from RGB to XYZ and a transformation from XYZ to La*b*. The transformation phase from RGB to XYZ, in this case, uses the following equations [2].
The transformation phase from XYZ to La*b* uses the following equations [2]:
where:
Xw, Yw and Zw represent the standard references for the
tristimulus of white values from the illumination of standard
CIE D55, as defined by x = 0, 3324 and y = 0. 3474 at the chromatic coordinate CIE.
Having obtained the value of La*b* target, the back-propagation network was trained using the values of RGB of the sugar cane color level image resulted from an ideal condition. The artificial neural networks can be more effective if the input from the network and the output data previously are normalized. Prior to the training, the process of data normalization is needed to make the input values are always positioned at certain current. This was done for the distance [0….1] in line with:
where xi, xmin, xmax, represent the original, minimum and
maximum value, respectively from the input variables that would be normalized.
As seen in Figure 3, the input layer of this back-propagation network uses one neuron for each value of RGB. The back-propagation network is applied with two hidden layers, each of which consisted of 10 to 5 neurons. From the back-propagation network, one output was resulted, namely L,
a* or b*value unit. During the training period to back-propagation network, early stopping method was used to enable the error behavior to be observed and optimally stopped.
G. The Formation of the Combination of Sa*b* Color Elemets and the Determination of Leaf Color Level Sa*b* is a combination of HSV and La*b* color space which is optimized with a back-propagation network. The value of the S color element in the Sa*b* was taken from S value in HSV color space. Meanwhile, the value of a* and b*
color in the Sa*b* was taken from La*b* which is optimized with back-propagation network.
The combination of Sa*b* color element was then used in the process of determining the leaf color level. Each element of
Sa*b* in the region blocks was compared to the level of referencing Sa*b* value. The number of the region block closest to certain level of leaf color was chosen as the analysis result. Meanwhile, the accuracy value was obtained from the correct number of the analyses divided with the tested number of the images.
III. RESULT AND ANALYSIS
A. Test Scenario
This test was aimed to measure the accuracy in determining the leaf color using the combination of Sa*b* color elements level optimized with back-propagation network. This test scenario was conducted by initially dividing six images of the original leaf color elements into 5x2 region blocks. The value in the Sa*b* color element combination was used as the unit for referencing color.
back-propagation network. In this scenario, the image was taken using the smartphone camera at six various environments. Thus, 60 images were used.
From the result of the transformation, each of Sa*b* value unit in the region blocks was compared to the referencing
Sa*b* value units. The region block which is closest to the certain level, was taken as the analysis result. Furthermore, the accuracy value obtained from the correct analysis number was divided into the number of the tested images. Finally, the accuracy value in the use of the combination of Sa*b* color elements was compared to that of the analysis from the La*b*
and HSV color space separately.
B. Result and Discussion
The accuracy value of the use of Sa*b* color elements combination optimized with the back-propagation network reaches 92 percent. It is higher than the HSV color space and the La*b* color space optimized with back-propagation network which have a good accuracy value of 83 percent.
In this experiment, S value (saturation) has contributed a significant effect on the accuracy value of determining the sugar cane color level. The value of L unit in the La*b* color space optimized in this research, in fact, did not provide any significant contribution to the analysis result. This can be seen from the accuracy values relatively low at 50 percent.
The saturation value of the image color was determined by the combination of light intensity and the extent of the intensity distributed into all spectrums of various wavelengths. The saturation value reflects the color strength or color insity in an image. For the pastel colors, the saturation value tends to be low. This also occurs in the image of the leaf color level produced by smartphone camera.
In the HSV color space, the color level of a pixel is highly influenced by the saturation value S. Its value represents the strength of the selected color which is given by the hue level H. Similarly, the value of a* and b* represent the color values in each pixel of an image. The value of a* and b* are not much influenced by the light intensity (L) of the environment of data recording..
The importance of not being influenced by the light intensity has made the accuracy level of sugar cane leaf color using the combination of the Sa*b* color element optimized is better than two other methods. While a* and b* values are the reflection of the actual value of image color, an addition of an S
element increase the accuracy in determining the level of sugar cane color.
Due to the inter-dependence of S value and a*b* value, the combination of Sa*b* elements can not been called as a new color space. If S value is changed, a* value and b* value will
also be changed. Yet, if a* value and b* value are changed, it does not mean that S value will change. In the chromatic diagram, these colors are present in the most outer region of the diagram. Getting closer to the white color in the intersection region between a* line and b* line in the chromatic diagram, the saturation value will decrease until zero right at the intersection of line a* and line b*.
This inter-dependence also causes a failure to model the elements of Sa*b* in a three-dimensional area. The color coordinate of each Sa*b* elements can not be surely illustrated in XYZ axes.
Optimization of the combination of Sa*b* color elements also has a key role in increasing the accuracy result in determining the level of sugar cane leaf color. Through this optimization, the values of a* and b* units become closer to the actual ones; thus the distance between a* and b* of the reference image and the image of the recording result using smartphone camera become less.
IV. CONCLUSION
The testing result shows that the Sa*b* color element combination which is optimized with the back-propagation network produces a better level of accuracy in the determination of sugar cane leaf color compared to La*b*
color space optimized and HSV; with an accuracy of 92 percent. The combination of Sa*b* color element is a combination of the color elements having the strongest influence in determining the color resemblance.
REFERENCES
[1] BPS, Perkembangan Beberapa Indikator Utama Sosial-Ekonomi Indonesia, 2012.
[2] CIE (Commission Internationale de l’Eclairage), Recommendations on uniform color spaces, color difference equations, psychometric color terms. Supplement No.2 to CIE publication No.15 (E.-1.3.1) 1971/(TC-1.3), Bureau Central de la CIE, 4 Av. du Recteur Poincare´, 75782 Paris Cedex 16, Paris, France, 1978.
[3] Tam, W.K. Lee, H.J., Dental shade matching using a digital camera. Department of Medical Informatics, Tzu Chi University, No. 701, Sec. 3, Jhongyang Rd., Hualien City, Hualien County 97004, Taiwan, ROC, 2012.
[4] Johnston, WM. Kao, EC., Assessment of appearance match by visual observation and clinical colorimetry. Journal of Dental Research; 68:819–22, 1989.
[5] Leon, K. Mery, D. Pedreschi, F. Leon, J., Color measurement in La*b* units from RGB digital images. Universidad de Santiago de Chile (USACH), Avenida Ecuador 3659, Santiago, Chile, 2006.
[6] Sproull, RC., Color matching in dentistry. Journal of Prosthetic Dentistry; 29 (Pt 1): 416–24, 1973.