(ACDP
-
007)
SCHOOL AND MADRASAH
PRINCIPALS AND SUPERVISORS
COMPETENCIES BASELINE STUDY
REPORT OF THE FINDINGS OF THE PRINCIPAL AND
SUPERVISOR COMPETENCY BASELINE STUDY
MAIN REPORT
THEEDUCATIONSECTORANALYTICALANDCAPACITYDEVELOPMENTPARTNERSHIP(ACDP):
The Government of Indonesia (represented by the Ministry of Education and Culture, the Ministry of Religious Affairs and the Ministry of National Development Planning/BAPPENAS, the Australian Agency for International Development (AusAID), the European Union (EU) and the Asian Development Bank (ADB) have established the Analytical and Capacity Development Partnership (ACDP) as a facility to promote policy dialogue and institutional and organizational reform of the education sector to underpin policy implementation and help reduce disparities in provincial and district education performance. The facility is an integral part of the Education Sector Support Program (ESSP) which consists of EU sector budget support with agreed arrangements for results-led grant disbursement, and earmarked policy and program-led AusAID sector development grant support consisting of a school infrastructure program, a nationwide district and school management development program and a
program to accelerate the GoI’s accreditation of private Islamic schools. This report has been prepared
with grant support provided by AusAID and the EU through ACDP.
CONSULTING
FIRMS:
The two consulting firms responsible for preparation of this Phase 3: Vol 2 - Main Report (2013-03-02) are: PT. Trans Intra Asia (TIA), Indonesia and the Institute of Public Administration of Canada (IPAC). These firms are part of a consortium which includes five (5) associate partners - two (2) from Canada (Queens University and Dalhousie University) and three (3) from Indonesia (Bogor Agricultural University, Faculty of Law-University of Padjadjaran, and The Institution for Development of Economics and Finance).
THE
CONSULTANTS
WHO
PREPARED
THIS
REPORT
ARE:
1. Graham David Dawson, Team Leader
TABLE OF CONTENTS
Table Of Contents... I Abbreviations And Acronyms ... V Acknowledgements ... VI Foreword ... VII
1.5. Capacity Development ... 6
2. Research Strategy ... 7
2.1. Strategies To Address Study Objectives ... 7
2.1.1. Objective 1 – Assess Principal And Supervisor Competency ... 7
2.1.2. Objective 2 – Profile Of Attributes ... 8
2.1.3. Objective 3 – Analysis Of Future Cpd Needs ... 8
2.1.4. Objective 4 – Implementation Of 12/2007 And 13/2007 ... 8
2.1.5. Objective 5 – Impact Of Inpres 2010 And 2011 ... 8
2.2. Quantitative Data Collection ... 9
2.2.1. Survey Instruments ... 9
2.2.2. The Sample And Implementation Strategy ... 10
2.2.3. Data Collection Processes ... 13
2.2.4. Data Analysis ... 13
2.2.5. Limitations Of Survey Methodology And Responses To Limitations ... 14
2.3. Qualitative Data Collection ... 15
2.3.1. Methodology ... 15
2.3.2. Qualitative Sample ... 16
3. Introduction And Respondent Profiles ... 19
3.1. Introduction ... 19
3.2. The Samples ... 19
3.3. Implementation And Validity Issues ... 21
3.4. Profile Of Respondents ... 21
3.4.1. Supervisor Profile... 21
3.4.2. Principal Profile ... 27
3.4.3. School Data ... 31
3.4.4. Teacher Profile ... 34
3.4.5. Head Of District Education Office Profile ... 36
4. Findings For Supervisors ... 37
4.1. Introduction ... 37
4.2. Supervisor Competency... 37
4.2.1. Quantitative Surveys – Overview Of Supervisor Competency ... 37
4.2.2. Personality And Social Dimensions ... 40
4.2.3. Managerial Supervision ... 41
4.2.4. Academic Supervision ... 50
4.2.5. Educational Evaluation ... 53
4.3. Supervisor Cpd Priorities ... 63
4.4. Impact Of Inpres Training - Supervisors ... 70
5. Findings For Principals ... 72
5.1. Introduction ... 72
5.2. Principal Competency ... 72
5.2.1. Personality And Social Dimensions ... 74
5.2.2. Managerial Competency Dimension ... 75
5.2.3. Entrepreneurship ... 81
5.2.4. Supervision ... 84
5.2.5. Teaching And Counselling ... 87
5.2.6. Summary – Principal Competency ... 88
5.3. Principal Cpd Priorities ... 90
5.4. Impact Of Inpres Training - Principals ... 94
6. Implementation And Understanding Of Regulations 12/2007 And 13/2007 ... 96
6.1. Introduction ... 96
6.2. Heads Of Education In Districts ... 96
6.2.1. Level Of Understanding – District Education Heads ... 96
6.2.2. Implementation Of Regulation 12/2007 And 13/2007 By District Education Office ... 97
6.3. Supervisor Understanding And Use Of Regulations ... 101
6.4. Principal Understanding And Use Of Regulation 13/2007 ... 103
6.5. Summary ... 104
Section 3 ... 105
Findings From Qualitative Field Studies ... 105
7. Qualitative Sample Profile ... 1056
7.1. Supervisors ... 105
7.2. Principal Profile ... 107
8. Findings For Supervisors ... 109
8.1. Competency ... 109
8.1.1. Important Competencies For Supervisors ... 109
8.1.2. Strengths And Areas For Development ... 110
8.1.3. Conclusion ... 116
8.2. Supervisor INPRES And CPD ... 117
8.2.1 Inpres Training ... 117
8.2.2 Supervisor Cpd ... 118
9. Findings For Principals ... 122
9.1. Competency ... 122
9.2. Principal CPD ... 126
9.2.1 INPRES ... 126
9.2.3 CPD Priorities – Principals ... 127
9.3. Parents’ Perceptions Of Their Schools ... 129
Section 4 ... 132
Discussion Of Findings And Policy Options ... 132
10. Discussion Of Findings And Their Implications ... 133
10.1. Introduction ... 133
10.2. BSNP National Education Standards... 133
10.3. Principal And Supervisor Competency ... 134
10.4. Inpres And Cpd Priorities For Principals And Supervisors ... 137
10.4.1 CPD PRIORITIES ... 137
10.4.2 Targeting CPD ... 139
10.4.4 Inpres Training ... 141
10.5 Future Research And Evaluation Priorities ... 141
10.5.1 Principal And Supervisor Competency Data – Using The Instruments ... 141
10.5.2 Review Of The National Education Standards ... 142
10.5.3 Effective Cpd Models For Indonesia ... 142
10.5.4 Using Evaluation Data ... 143
10.5.5 Performance Management Systems ... 143
11 Summary Of Policy Options ... 144
APPENDICES
Appendix 1 Terms of Reference Appendix 2 Documents Reviewed Appendix 3 Data Collection Teams Appendix 4 Tables and Charts Appendix 5 Competency Indicators
Other Volumes of the Report Volume 1 Executive Summary
ABBREVIATIONS AND AC RONYMS
ACDP Analytical and Capacity Development Partnership
ADB Asian Development Bank
AIBEP Australia Indonesia Basic Education Program AusAID Australian Agency for International Development
BSNP Badan Standar Nasional Pendidikan (National Standards Board for Education)
CPD Continuing Professional Development
EU European Union
FGD Focus Group Discussion
GoI Government of Indonesia
IAIN Institut Agama Islam Negeri
INPRES Presidential Instruction (No.1 2010) (Instruksi Presiden)
KII Key Informant Interviews
LEMLIT Lembaga Penelitian (Research Institute)
LPPKS Lembaga Pengembangan and Pemberdayaan Kepala Sekolah (Principal Development and Empowerment Institute)
MoEC Ministry of Education and Culture
MoRA Ministry of Religious Affairs
NES National Education Standards
PPP Principal Preparation Program
PPPPTK (P4TK) Pusat Pengembangan dan Pemberdayaan Pendidik dan Tenaga Kependidikan (Centre for Development and Empowerment of Teachers and Education Personnel
Pusbang Tendik Pusat Pengembangan Tengara Kependidikan (MoEC) –(Centre for the Development of Educational Personnel)
SSO Structured School Observation
SSQ School Systems and Quality (AusAID Program)
STAIN Sekolah Tinggi Agama Islam Negeri
ToR Terms of Reference
ToT Training of Trainers
UNJ Universitas Negeri Jakarta (National University Jakarta) UNY Universitas Negeri Yogyakarta (National University Yogyakarta)
UNSYIAH Universitas Syiah Kuala
ACKNOWLEDGEMENTS
The ACDP 7 team would like to acknowledge the work of key groups and individuals that have contributed to the successful implementation of ACDP 7.
First, the data collectors and team leaders from the Research Institutes (Lembaga Penelitian – Lemlit) at:
IAIN Sunan Ampel, Surabaya (IAIN)
STAIN Syaikh Abdurrahman Siddik, Bangka Belitung (STAIN)
Universitas Negeri Jakarta (UNJ)
Universitas Negeri Yogyakarta (UNY)
Universitas Syiah Kuala (UNSYIAH), Aceh
Universitas Pendidikan Indonesia (UPI), Bandung
They were responsible for collecting, organising and returning the data to the national study team.
Second, to members of the study’s Advisory Group, who provided advice on the development and implementation of the research strategy and plan.
Dr. Edi Rahmat Widodo (UNJ – Pusbangtendik)
Nissa Afriliana (Pusbangtendik)
Nurul Islam, M.Ed (MoRA)
Dr. Sabar Budi Rahardjo (POKJA ACDP, Balitbang)
Dr. Suud Karim Alkarhami (Pusbangtendik)
FOREWORD
This document is Volume 2 of the Report of the Findings from the Supervisor and Principal Competency Baseline Study. The full report comprises four volumes:
Volume 1 – Executive Summary
Volume 2 – Main Report
Volume 3 – Tables and Charts (Electronic Document)
Volume 4 – Data Collection Instruments
The study was conducted over a one-year period commencing in December 2011 and was funded through the Analytical and Capacity Development Partnership, managed by the Asian Development Bank (ADB) on behalf of AusAID and the European Union.
This volume of the report provides detailed information about:
The purpose and objectives of the study
The research strategy and methodology
Links to related studies
Findings from the quantitative and qualitative components of the study
The implications and directions for future policy and practice in Indonesia
Policy options.
1. BACKGROUND TO THE STUDY
1.1. Introduction
The Ministry of National Education, now the Ministry of Education and Culture (MoEC), Strategic Plan 2010-2014 gives priority to the development of the professional competencies of school and madrasah principals and supervisors to ensure improved quality in the implementation of school education programs. Principal and supervisor competencies were defined and articulated in the National Education Standards (NES) and Ministerial Decrees 12/2007 and 13/2007.
International research findings indicate that the quality of educational leadership has an impact on the quality of educational outcomes. For this reason, during the current Strategic Plan period, the Ministry of Education and Culture and the Ministry of Religious Affairs (MoRA) have placed significant emphasis on building the competency and capacity of principals and supervisors through the development and implementation of new approaches to recruitment, appraisal and Continuing Professional Development (CPD).
These priorities were consistent with Presidential Instruction No. 1 of 2010 (INPRES), which focused on the empowerment of MoEC and MoRA school/madrasah principals and supervisors, through provision of professional development programs.
MoEC and MoRA required baseline data about the current competency levels of principals and supervisors to inform and guide future CPD programs. This information has been collected through the implementation of ACDP 7 – Principal and Supervisor Competency Baseline Study.
1.2. Purpose and Scope ofthe Study
The Terms of Reference (ToR) for the study (see Appendix 1) stated that the purpose of the study was to:
1. Assess the level of competence of school supervisors and school principals based on the competencies in Ministerial Decrees No. 12/2007 and 13/2007 and the distribution of their competencies against agreed variables
2. Develop a profile of the attributes of school supervisors and school principals to inform future CPD programs
3. Analyse the future CPD needs of school supervisors and school principals
4. Determine the extent to which Ministerial Decrees No. 12/2007 and 13/2007 have been implemented by districts
5. Assess the impact of the 2010 Interim Presidential Staff Strengthening Program (INPRES) on participating school supervisors and principals.
The ToRs required the study to collect quantitative and qualitative information to address these objectives from samples of MoEC and MoRA principals, school supervisors, teachers, parents and district office education heads in seven regions of Indonesia: Sumatra; Java; Kalimantan; Nusa Tenggara; Sulawesi; Maluku and Papua.
Findings from the study were analysed so that the implications for policy and practice are discussed in detail in this volume of the Final Report.
Diagrams 1 and 2 provide an overview of the study’s approach. More detailed information about the methodology and instruments is presented in the Chapter 2.
Diagram 1: Relationship between Quantitative and Qualitative Data Collection
Quantitative Survey
• Collect Quantitative Data
Analysis of Quantitative
Data
• Analyse quantitative data and identy issues for investigation in qualitative field visits
Qualitative Data Collection and
Analysis
Diagram 2: Framework for the Principal and Supervisor Competency Study
EDUCATIONAL AND
REGULATORY CONTEXT
•Government and Ministerial Regulations
•District and National level Policy and Practice
ESTABLISH LINKAGES
•Previous reports and studies
•Current intiatives in MoEC/MoRA •National and District
Programs
•Development agency initiatives
DESIGN
CONSULT
PILOT
TRAIN
QUANTITATIVE DATA COLLECTION
AND ANALYSIS
QUALITATIVE DATA COLLECTION AND
ANALYSIS
REVIEW
REPORT
1.3. Scope and Limitations of the Study
The main focus of the study is the collection of baseline data about principal and supervisor competence for CPD purposes. To achieve this the study ToRs specified the development and implementation of surveys as the main quantitative data collection strategy and field visits as the main qualitative methodology.
Surveys have many benefits, particularly their capacity to collect large amounts of data, from a large sample in a relatively short period of time. The surveys used in this study enabled the team to collect extensive data from a large sample of respondents (10,000) located in many different regions of Indonesia.
However, surveys provide data about the perceptions of respondents which can be affected by a wide range of individual contexts and issues. While this does not invalidate survey findings special actions were taken by the study team to improve validity and reliability of the findings. These actions are discussed in later in the report.
The study was not designed to collect formal performance appraisal data. This would have required the design and implementation of very different methodologies with particular emphasis placed on the collection and analysis of extensive observational data of the application of competencies in the workplace.
A second limitation relates to the collection of impact data about the 2010 and 2011 Presidential Staff Strengthening Program (INPRES). An impact study usually requires data to be available about respondents’ competencies before they undertake the intervention to be investigated. In this way post -intervention competency can be compared to pre--intervention competency. Pre-INPRES competency data about principals and supervisors were not available to the study team as it was not collected. This placed some limitations on the extent to which the study was able to provide findings about the impact of the intervention on the competency of participants.
The study methodology included a number of strategies to address this problem. The study used both the principal and supervisor surveys and the field studies to collect information about the effectiveness, appropriateness and impact of the Staff Strengthening Program and the delivery methods it used. In addition, during the analysis of the survey data, the team compared competency ratings of participants and non-participants in the Staff Strengthening Program to determine if there were significant differences between the competency ratings for the two groups of respondents. While this will not provide direct evidence of impact it provided correlational data which can be used as an indicator of impact.
These limitations have not seriously affected the outcomes of the study which provides important information for each of the objectives detailed in the ToRs. These data provide a baseline from which further research, evaluation and appraisal strategies can be developed to monitor principal and supervisor competency and development.
1.4. Related Studies
about achievement of the standards of competency. However, it had not collected any data relevant to this study at the time this report was prepared.
Data about principal and supervisor competency may be available at the provincial or district levels but this was not available to MoEC or the national study team. One of the gaps in the current educational quality assurance system is the lack of valid and reliable performance appraisal data about principals and supervisors, although MoEC has identified the implementation of a performance appraisal system as a priority for 2013.
The only relevant study available to the national study was the MoNE Review of the Capacity of Supervisors which was conducted as part of the AusAID funded Australia Indonesia Basic Education Program (AIBEP). This study was undertaken in 2007, just after the promulgation of Regulation 12/2007 and was designed to identify the competencies and professional development needs of school supervisors to meet the requirements of the regulation.
The study used survey methodology to collect data from 240 supervisors, 120 principals and teachers and 33 other key informants including district education heads and members of school committees. In addition, the study collected follow-up qualitative data through interviews and focus group discussions with a small sample of supervisors, district office and provincial officers, teachers, principals and members of school committees.
Regarding supervisor competency, the study found that all stakeholder groups believed the competence of supervisors to be well below the expectations of Regulation 12/2007. In particular, supervisors were weak in the areas of Academic Supervision, Managerial Supervision and Research and Development. Evaluation and personal skills were also rated low. Teachers stated that supervisors lacked the necessary subject expertise to be effective academic supervisors.
Supervisors themselves reported that they had limited access to professional development opportunities and as a consequence teachers and principals often had more information about the areas they were meant to be supervising than they did.
The study painted a very poor picture of supervisor competence and professionalism. Strong concerns were also expressed about the gender imbalance among supervisors (17% only were female), their academic qualifications and the methods used to select supervisors.
As the report used methodology and analysis similar to the current study, its findings have provided an important point of comparison to determine if there has been any significant improvement in these areas since 2007.
At the time the current study was collecting its quantitative data, Pusbang Tendik (Pusat Pengembangan Tengara Kependidkan), with the assistance of the AusAID funded School Systems and Quality Program (SSQ), was developing and piloting a pencil and paper competency assessment for principals and supervisors. The assessment was a cognitive assessment based on the competency dimensions of Regulations 12/2007 and 13/2007.
found that there were differences in the level of understanding based on the location of respondents. The effect of location was also examined in this study.
1.5. Capacity Development
The study was required to collect data from an extensive geographical area of Indonesia, including remote and border locations. To facilitate the collection of data from these areas in the time available the study sub-contracted the data collection to data collection teams from Research Institutes (Lemlit) in six universities. The national study team provided data collectors with training and support manuals to assist them in the data collection. The processes are described in the next section of the report.
A major benefit of this approach was that working partnerships were established with Research Institutes which could benefit the institutions, MoRA and MoEC for future studies. The model could be adapted for future ACDP studies or systemic research.
2. RESEARCH STRATEGY
2.1. Strategies to Address Study Objectives
The study used qualitative and quantitative methodologies to collect valid and reliable data to meet the objectives of the study. As specified by the ToRs quantitative data was collected through detailed and large-scale surveys of principals and supervisors. With the approval of the ACDP Secretariat, MoEC and MoRA, surveys were also developed and conducted for teachers and heads of district education offices.
Qualitative data was collected through one-day field visits to schools and district education offices. During the field visits data was collected through Key Informant Interviews (KII), Focus Group Discussions (FGD), Structured School Observation (SSO) and Document Analysis.
The field visits were limited to one-day because of budgetary constraints. 2.1.1. Objective 1 – Assess principal and supervisor competency
Data about principal and supervisor competency levels were collected using both quantitative and qualitative methods. The two approaches were closely aligned so that qualitative data collection methods were used to explore in greater depth the information gathered through the quantitative surveys.
Quantitative data about principal and supervisor competency was collected through detailed surveys (see Volume 4). In these surveys, principals and supervisors self-rated their level of competency on each of the competency indicators contained in Decrees 12/2007 and 13/2007. In addition, to cross-check respondent self-ratings, these surveys required:
Principals and supervisors to provide information about core documents and actions that are related closely to each of the competency dimensions
Principals to rate the competency level of their supervisors, and supervisors to rate the competency levels of their principals.
To enable further cross-checking of principal and supervisor self-ratings of competency a sample of teachers was asked complete a survey in which they rated the competency levels of their principals and supervisors.
A separate survey was developed for MoEC and MoRA heads of district education offices. In this survey district education heads were asked to identify the competency strengths and weaknesses of their supervisors, as well as the CPD needs of their principals and supervisors.
2.1.2. Objective 2 – Profile of attributes
The principal and supervisor surveys also collected extensive profile data about respondents. The profile data provided rich information about respondents including location, experience, qualifications, professional development experiences, job experience. This information was used in the analysis of the survey data but will also be useful to guide the development of CPD.
2.1.3. Objective 3 – Analysis of future CPD needs
A separate section of each of the surveys focused on gathering information about future CPD needs and priorities using a synthesised version of the competency dimensions and indicators. This information complemented and supplemented the information about development needs derived from ratings of competency provided by teachers, principals and supervisors. In addition, district education heads they were asked to identify the professional development priorities of their supervisors and principals.
CPD development needs were investigated further during the site visits to schools and districts. In particular, priority areas for CPD identified in the surveys were investigated more deeply in the field visits.
2.1.4. Objective 4 – Implementation of 12/2007 and 13/2007
Quantitative and qualitative data collection methods were used to gather information about district implementation of Ministerial Decrees 12/2007 and 13/2007. Specific questions were included in the principal, supervisor and district education head surveys about understanding of the decrees, their socialisation and their use by districts, supervisors and in schools.
In addition, the issues were investigated in interviews with supervisors, principals and district education heads during the field visits.
2.1.5. Objective 5 – Impact of INPRES 2010 and 2011
As discussed previously the team did not have access to information about principal and supervisor competency before they participated in the staff strengthening program. To address this limitation the study compared the competency ratings of participants in the program with competency ratings of non-participants. This provided a proxy indicator of the impact of the INPRES program.
The principal and supervisors surveys also collected data from principals and supervisors about the effectiveness and impact of the program.
The self-ratings of principals about the impact of INPRES training on the competency were compared with teacher ratings of the impact of the program on their principals.
2.2. Quantitative Data Collection 2.2.1. Survey Instruments
Extensive quantitative data was collected through the completion of paper and pencil questionnaires by samples of supervisors, principals, teachers and heads of district education offices. Copies of the surveys are provided in Volume 4 of the Final Report.
The principal and supervisor forms were structured similarly and comprised five sections:
Section A – Profile Data
Section B – Self-Rating of Personal Competency
Section C – Principal Ratings of their Supervisor’s Competency or Supervisor Ratings of their
Principals’ Competencies
Section D – Effectiveness and impact of INPRES content and delivery methods; Professional Development Experiences; Priorities for Future CPD
Section E – Implementation of decrees related to Principal and Supervisor Competency
The teacher form comprised three sections:
Section A – Teacher Profile Data
Section B –Teacher Rating of their Principal’s Competency
Section C –Teacher Rating of their Supervisor’s Competency
The district education office head form comprised five sections:
Section A – Profile Data
Section B – Rating of Supervisor Competency
Section C – Professional Development Priorities – Supervisors
Section D – Professional Development Priorities – Principals
Section E - District Implementation of Regulations 12/2007 and 13/2007
The surveys were developed by the study team and the study’s Advisory Group which comprised
representatives from MoEC and MoRA. The team used the study’s ToRs to guide the development of
the survey, taking onto account the local context and effective survey design.
The core of the surveys was based on the BSNP National Standards for Supervisors, Principals and Teachers and the Education Management Standard. These standards were used to design items related to competency and professional development priorities. Because the competency indicators in the National Standards often contained multiple concepts, each competency indicator was reviewed and simplified before it was included as an item in the survey. This process increased the length of the surveys but ensured that the items were meaningful.
Three formats of the draft surveys were prepared these were reviewed by MoEC and MoRA officers. The draft surveys were reviewed in more detail at a two-day consultative workshop conducted in January. Participants included:
Senior officers of MoEC and MoRA
Teachers, principals and supervisors
ACDP personnel
AusAID SSQ team members.
In addition, the survey methodology was discussed extensively with stakeholders at the Inception Workshop and the End of Phase 1 Workshop.
Two versions of the draft instruments were piloted by samples of principals, supervisors, teachers and heads of district education offices in four districts - Bekasi, Lebak, Bogor and Jakarta Selatan. The pilot program was conducted by a team from the National University, Jakarta (UNJ).
The instruments were revised using information gathered during the pilots. A final review of the draft instruments was undertaken by representatives of the universities that were contracted to collect the data during their training program for the conduct of the surveys.
The surveys for principals and supervisors were very detailed and longer than would usually be seen as best practice design. However, this was necessary given the complexity of the standards and the detailed information required under the ToRs. The implementation strategy used by the study, whereby respondents were transported to central locations to complete the surveys with the support of data collectors, was developed to help overcome possible problems caused by the length of the surveys. 2.2.2. The Sample and Implementation Strategy
The supervisor and principal samples for the quantitative study were selected from the relevant populations in seen regions of Indonesia: Sumatra; Java; Kalimantan; Nusa Tenggara; Sulawesi; Maluku and Papua.
Districts from these regions were selected randomly using four strata: urban, semi-urban, rural and remote. The sample also included districts located in border areas. Several sources of data were used to select the sample including PODES (BPS) and datafromthe education/religious education officein thedistrict/city.
From this sample of districts supervisors were selected based on the following strata: 1. The school/madrasah supervised: School, Madrasah
2. Participated in INPRES 2010/2011 Staff Strengthening Program: Yes, No 3. Sex of supervisor: Male, Female
The principal sample was drawn from the supervisor sample to ensure that there was a link between each supervisor and the principals they supervised. The reason for this is explained in the section addressing the issue of the validity of the questionnaire data. The selection of schools, and hence principals, was based on:
1. Principal of school/madrasah participated in INPRES 2010/2011 Staff Strengthening Program: Yes, No
Using this approach samples of 5,000 principals and 1,000 supervisors were drawn from 55 districts. This was a smaller sample than proposed in the ToRs. The reduction was necessitated to remain within the budget.
In addition to the principal and supervisor samples, a sample of 4,000 teachers was selected. This was achieved by selecting a sample of two teaches from each of a randomly selected set of 2,000 schools/madrasah. The sample was drawn to provide another layer of data validation.
An important feature of the sample was that supervisor, principal and teacher samples were linked so that direct comparisons could be made between the responses of supervisors and the principals they supervised; principals and their individual supervisors; teachers and their principals and supervisors. This approach was implemented to cross-check responses between the different groups for validation purposes.
Diagram 3 provides an overview of the sampling strategy.
Diagram 3: Sampling Process
Table 1 provides details of the full sample by district.
Table 1: Quantitative Sample
1 2 3 4 5 6 7 8 9 10 11
1 Sumatera Bangka Belitung BELITUNG STAIN Rural 7 35 28 2 72
2 Sumatera Bangka Belitung PANGKAL PINANG STAIN Urban 11 55 44 2 112
3 Sumatera Kepulauan Riau BINTAN STAIN Rural 7 35 28 2 72
4 Sumatera Kepulauan Riau TANJUNG PINANG STAIN Urban 7 35 28 2 72 5 Sumatera Nanggroe Aceh Darussalam ACEH SELATAN UNSYAH Rural 10 50 40 2 102 6 Sumatera Nanggroe Aceh Darussalam LHOKSEUMAWE UNSYAH Urban 7 35 28 2 72 7 Sumatera Nanggroe Aceh Darussalam PIDIE UNSYAH Rural 9 45 36 2 92 8 Sumatera Sumatera Barat LIMA PULUH KOTA UPI Semi Urban 9 45 36 2 92
9 Sumatera Sumatera Barat PADANG UPI Urban 16 80 64 2 162
10 Sumatera Sumatera Barat SOLOK SELATAN UPI Rural 8 40 32 2 82 11 Sumatera Sumatera Selatan BANYU ASIN STAIN Remote Areas 21 105 84 2 212 12 Sumatera Sumatera Utara DELI SERDANG UPI Semi Urban 42 210 168 2 422
13 Sumatera Sumatera Utara MEDAN UPI Urban 37 185 148 2 372
14 Sumatera Sumatera Utara PADANG LAWAS UPI Rural 6 30 24 2 62 15 Sumatera Sumatera Utara TAPANULI UTARA UPI Rural 14 70 56 1 141
16 Jawa Banten LEBAK UPI Rural 46 230 184 2 462
17 Jawa DI Yogyakarta BANTUL UNY Semi Urban 47 235 236 2 520
18 Jawa DKI Jakarta JAKARTA SELATAN UNJ Urban 52 260 208 2 522
19 Jawa Jawa Barat BANDUNG UPI Urban 79 395 316 2 792
20 Jawa Jawa Barat BEKASI UNJ Semi Urban 50 250 200 2 502
21 Jawa Jawa Barat INDRAMAYU UPI Semi Urban 49 245 196 2 492
22 Jawa Jawa Tengah KOTA SURAKARTA UNY Urban 25 125 100 2 252
23 Jawa Jawa Tengah REMBANG UNY Rural 30 150 120 2 302
24 Jawa Jawa Tengah SUKOHARJO UNY Semi Urban 28 140 112 2 282
25 Jawa Jawa Tengah WONOGIRI UNY Semi Urban 26 130 104 2 262
26 Jawa Jawa Timur JOMBANG UNY Semi Urban 46 230 184 2 462
27 Jawa Jawa Timur KEDIRI UNY Urban 12 60 48 2 122
28 Jawa Jawa Timur SUMENEP UNY Semi Urban 45 225 180 2 452
29 Nusa Tenggara Nusa Tenggara Barat KOTA BIMA UNY Urban 10 50 40 2 102 30 Nusa Tenggara Nusa Tenggara Barat LOMBOK BARAT UPI Semi Urban 21 105 84 2 212 31 Nusa Tenggara Nusa Tenggara Barat SUMBAWA BARAT UNY Rural 7 35 28 2 72 32 Nusa Tenggara Nusa Tenggara Timur BELU UNY Remote Areas 5 25 20 1 51 33 Nusa Tenggara Nusa Tenggara Timur TIMOR TENGAH SELATAN UNY Remote Areas 8 40 32 1 81 34 Kalimantan Kalimantan Barat KETAPANG UPI Remote Areas 12 60 48 2 122 35 Kalimantan Kalimantan Barat PONTIANAK UPI Urban 18 90 72 2 182 36 Kalimantan Kalimantan Barat SAMBAS UPI Rural 15 75 60 2 152 37 Kalimantan Kalimantan Selatan TABALONG UPI Rural 7 35 24 2 68 38 Kalimantan Kalimantan Timur NUNUKAN UNY Remote Areas 6 30 18 2 56
39 Kalimantan Kalimantan Timur PASER UNY Rural 6 30 18 2 56
40 Kalimantan Kalimantan Timur SAMARINDA UNY Urban 9 45 28 2 84
41 Sulawesi Sulawesi Selatan BONE UNJ Rural 18 90 72 2 182
42 Sulawesi Sulawesi Selatan LUWU UTARA UNJ Remote Areas 12 60 48 2 122 43 Sulawesi Sulawesi Selatan MAKASSAR UNJ Urban 20 100 80 2 202
44 Sulawesi Sulawesi Selatan MAROS UNJ Rural 9 45 36 2 92
45 Sulawesi Sulawesi Tenggara KENDARI UNJ Urban 9 45 36 2 92
46 Sulawesi Sulawesi Tenggara KOLAKA UTARA UNJ Remote Areas 7 35 28 2 72 47 Sulawesi Sulawesi Utara KEPULAUAN SANGIHE UNJ Rural 6 30 22 2 60 48 Sulawesi Sulawesi Utara MINAHASA TENGGARA UNJ Remote Areas 4 20 16 1 41
49 Maluku Maluku KOTA AMBON UNJ Urban 9 45 36 1 91
50 Maluku Maluku MALUKU TENGAH UNJ Rural 11 55 44 2 112
51 Maluku Maluku Utara HALMAHERA TENGAH UNJ Remote Areas 6 30 18 2 56
52 Maluku Maluku Utara KOTA TERNATE UNJ Urban 7 35 24 2 68
53 Papua Irian Jaya Barat KOTA SORONG UNJ Urban 4 20 12 1 37
54 Papua Papua KEEROM UNJ Remote Areas 4 20 12 1 37
55 Papua Papua NABIRE UNJ Remote Areas 4 20 12 1 37
T O T A L 1,000 5,000 4,000 102 10,102 Total Sample No. Region Province District/City Univerity Strata Principal
2.2.3. Data Collection Processes
Because of the geographic spread and size of the sample the task of quantitative data collection was sub-contracted to teams from five universities:
STAIN Syaikh Abdurrahman Siddik (Bangka Belitung)
Universitas SYAH Kuala (UNSYIAH - Aceh)
Universitas Negeri Jakarta (UNJ)
Universitas Pendidikan Indonesia (UPI)
Universitas Negeri Yogyakarta (UNY).
These institutions were selected by MoEC and MoRA because of their location and experience in education research.
Each institution presented a proposal for quantitative data collection which was reviewed by the national study team and approved by MoEC, MoRA and the ACDP Secretariat. Universities were responsible for: 1. Selecting and training data collectors
2. Liaising and communicating with district education offices and respondents
3. Assisting district offices select participants using criteria established by the national study team 4. Managing the data collection process
5. Checking data
6. Returning completed forms to the national study team.
The national study team provided training for two representatives from each university on how to conduct the quantitative data collection. University representatives then conducted similar training for all data collectors prior to the commencement of data collection. The national study team also provided all data collectors and university trainers with:
An Implementation Manual – Quantitative which provided detail instructions for collecting the quantitative data
A Train the Trainer Training Manual – Quantitative
A Training Manual for Data Collectors and Team Leaders – Quantitative.
Because of the remoteness of some locations, the length of the questionnaire and the need to ensure completion of the surveys by a large percentage of the samples, all respondents were brought to central locations and completed the questionnaires under the supervision of the data collection team. This also improved validity of responses as it enabled data collection teams to explain the purpose of the surveys and assist respondents if necessary.
Surveys were completed by respondents in between July 2012 and January 2013. 2.2.4. Data Analysis
Frequencies, means, standard deviations (where relevant) were calculated for all items. Ratings were disaggregated and analysed against a set of independent profile variables:
For Principals: sex; age; age at first appointment; type of school; location of school; highest qualification; school accreditation status; school status – private or public; MoEC/MoRA; participation in INPRES. For Supervisors: sex; age; age at first appointment; role prior to appointment; type of supervisor; location; highest qualification; MoEC/MoRA; participation in INPRES.
Significance testing was conducted using mainly Analysis of Variance.
In addition, factor analysis was used to test the validity of the competency dimensions and their competency indicators that had been developed by BSNP.
2.2.5. Limitations of Survey Methodology and Responses to Limitations
The advantage of using large-scale paper and pencil questionnaires to collect the quantitative data was that it enabled the collection of large amounts of data in a relatively short timeframe from a relatively large sample of respondents. This makes it viable to extrapolate the findings from the sample to the general population. In addition, the approach adopted collected real world data from the key people. On the other hand there are a number of limitations with the paper and pencil questionnaire methodology. First, it provides only a snapshot of the situation at one moment in time. Second while surveys that rely on self-rating provide important data about the respondents’ perceptions there can be concerns about the “accuracy”and objectivity of those perceptions. Third, the data collected is likely to lack of detail and depth.
The study took action to overcome these limitations as far as was possible.
To address the problem of tracking change in people over time, the surveys were designed so that they could be used by districts and the national education authorities to collect further data about competency and CPD needs.
The issue of the “accuracy” and objectivity of perceptions was addressed in a number of different ways.
First, self-ratings can provide relevant and valid information about how respondents perceive themselves and their level of professional competency. Provided that respondents are not deliberately providing inaccurate responses, their self-ratings provide important information for MoEC and MoRA. To try and improve the validity of responses and to optimise the response rate it was decided to bring respondents together to complete the surveys in one location. This approach enabled data collectors to provide detailed information about the purpose of the surveys, how the data were to be used and the confidentiality of individual responses. This was important for reducing possible concerns that the data would be used for appraisal purposes. Providing information for CPD purposes is much less threatening than providing data that could be used for performance management purposes.
incorporated in Section B where principal and supervisor respondents were asked to provide additional information relating to each set of competency dimensions.
The third method used to cross-check ratings was to compare self-ratings of competence with the ratings of competency provided by other respondents. The findings from these cross-checking are presented in the section of the report which presents the findings from the quantitative data collection. The issue of the possible lack of depth and detail in the information collected through the surveys was addressed by conducting a series of field visits to schools and district offices. These visits, which are discussed in the section dealing with the qualitative methodology, were used to investigate the primary objectives and issues in greater detail through interview, observation and document analysis.
2.3. Qualitative Data Collection 2.3.1. Methodology
Qualitative data was collected through one-day field visits to schools and district education offices. During these visits more detailed information was collected to address the study objectives and key issues that emerged from the analysis of the quantitative surveys.
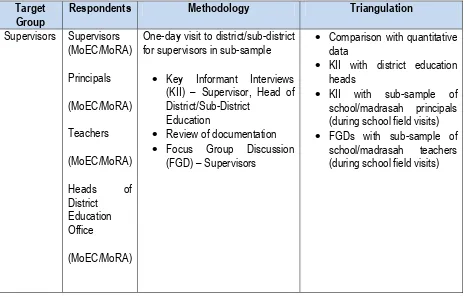
Data was collected using Key Informant Interviews, Focus Group Discussions, Structured School Observation and Document Review and Analysis. Table 2 provides an overview of the methods used during field visits.
Table 2: Qualitative Data Collection Target
Group
Respondents Methodology Triangulation
Supervisors Supervisors
One-day visit to district/sub-district for supervisors in sub-sample
Key Informant Interviews (KII) – Supervisor, Head of District/Sub-District
Education
Review of documentation
Focus Group Discussion (FGD) – Supervisors
Comparison with quantitative data
KII with district education heads
KII with sub-sample of school/madrasah principals (during school field visits)
Target Group
Respondents Methodology Triangulation
Principals Principals
One-day field visit to each school in subsample
KII – principals
Structured school observation
Document analysis
FGD – teachers, parents
Comparison with quantitative data
FGDs with groups of teachers, parents (school committee),
KII with supervisors during supervisor qualitative study
The national study team developed a set of instruments for qualitative data collection and an Implementation Manual – Qualitative which provided detailed instructions about how to collect the data. These instruments and manuals were piloted in April in Lebak and Bekasi districts and were revised based on feedback from the pilot.
Qualitative data collection was conducted by six sub-contracted universities teams. IAIN Surabaya was added to the other five universities used to collect the quantitative data.Data collectors were trained using the same model used for the quantitative data collection training.
2.3.2. Qualitative Sample
The qualitative sample was selected as a purposeful sub-set of the main sample. This was done after a significant proportion of the quantitative data had been analysed so that it took into account not only the strata considered in selecting the main sample but also the particular issues that were identified during the quantitative analysis. In addition, the sub-sample included:
Principals and supervisors who did and did not participate in INPRES
Principals and supervisors with high and low competency ratings in surveys.
The individual supervisors and principals in the qualitative sample were selected by the national study team.
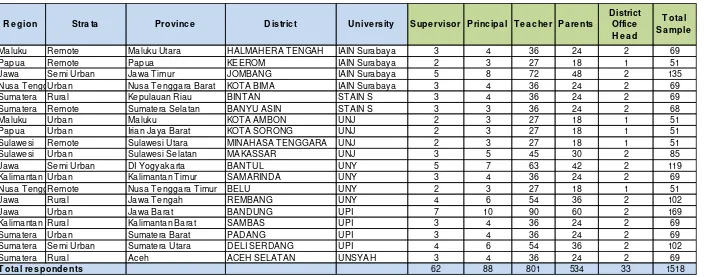
Details of the sample are provided in Table 3.
Table 3: Qualitative Sample
Maluku Remote Maluku Utara HALMAHERA TENGAH IAIN Surabaya 3 4 36 24 2 69
Papua Remote Papua KEEROM IAIN Surabaya 2 3 27 18 1 51
Jawa Semi Urban Jawa Timur JOMBANG IAIN Surabaya 5 8 72 48 2 135
Nusa TenggUrban Nusa Tenggara Barat KOTA BIMA IAIN Surabaya 3 4 36 24 2 69
Sumatera Rural Kepulauan Riau BINTAN STAIN S 3 4 36 24 2 69
Sumatera Remote Sumatera Selatan BANYU ASIN STAIN S 3 3 36 24 2 68
Maluku Urban Maluku KOTA AMBON UNJ 2 3 27 18 1 51
Papua Urban Irian Jaya Barat KOTA SORONG UNJ 2 3 27 18 1 51
Sulawesi Remote Sulawesi Utara MINAHASA TENGGARA UNJ 2 3 27 18 1 51
Sulawesi Urban Sulawesi Selatan MAKASSAR UNJ 3 5 45 30 2 85
Jawa Semi Urban DI Yogyakarta BANTUL UNY 5 7 63 42 2 119
Kalimantan Urban Kalimantan Timur SAMARINDA UNY 3 4 36 24 2 69
Nusa TenggRemote Nusa Tenggara Timur BELU UNY 2 3 27 18 1 51
Jawa Rural Jawa Tengah REMBANG UNY 4 6 54 36 2 102
Jawa Urban Jawa Barat BANDUNG UPI 7 10 90 60 2 169
Kalimantan Rural Kalimantan Barat SAMBAS UPI 3 4 36 24 2 69
Sumatera Urban Sumatera Barat PADANG UPI 3 4 36 24 2 69
Sumatera Semi Urban Sumatera Utara DELI SERDANG UPI 4 6 54 36 2 102
Sumatera Rural Aceh ACEH SELATAN UNSYAH 3 4 36 24 2 69
T ota l re sponde nts 62 88 801 534 33 1518
D istrict Office H e a d
T ota l S a mple S upe rvisor P rincipa l T e a che r P a re nts
SECTION 2
3. INTRODUCTION AND RESPONDENT PROFILES
3.1. Introduction
This section of the report presents the key findings from the analysis of the quantitative survey data. Important charts, tables and diagrams are included either in the text, in Appendix 4 of this volume or in the in Volume 3 of the report.
Readers will need to refer to the survey instruments when reviewing the findings. The instruments are provided in Volume 4 of the Final Report.
The findings from the quantitative surveys are reported and discussed by thematic area:
Respondent profiles
Competency
CPD priorities
Impact of INPRES training
Understanding and implementation of Regulations 12/2007 and 13/2007.
To reduce the complexity of this chapter supervisor and principal findings for competency, CPD priorities and INPRES training are discussed separately, with common issues being considered in the final section.
The quantitative surveys provided a large quantity of data. It is not possible to discuss all of the findings in this report which concentrates on the key findings relating to the study terms of reference. The study team will brief the ACDP Secretariat, MoEC and MoRA on other findings from the report and suggest to them areas where further analysis of the data would be useful.
3.2. The Samples
While 55 districts were included in the sample there was a lengthy delay in data collection in three districts, Medan, Wonogiri and Sumenep, as a result of local factors beyond the control of the study. This meant that the data from these three districts was not available when this report was prepared. In Wonogiri and Sumenep the appointment of a new district education head caused the delay. In Medan respondents were not available till later in January.
A separate volume has been prepared to present the findings from these three districts and the relationship to the national data.
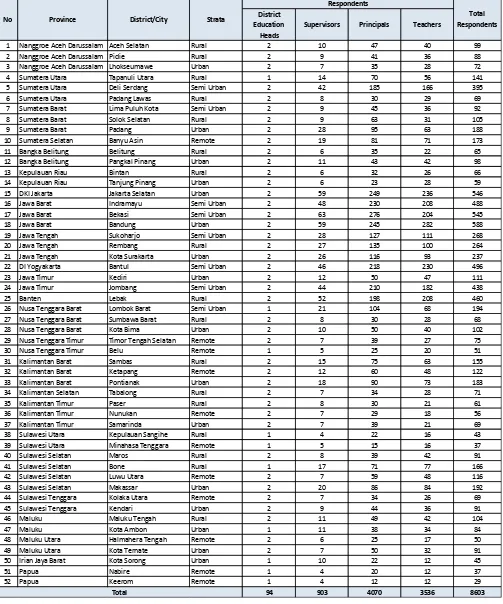
Table 4: Quantitative Sample for the Analysis
District Education
Heads
Supervisors Principals Teachers
1 Nanggroe Aceh Darussalam Aceh Selatan Rural 2 10 47 40 99 2 Nanggroe Aceh Darussalam Pidie Rural 2 9 41 36 88 3 Nanggroe Aceh Darussalam Lhokseumawe Urban 2 7 35 28 72 4 Sumatera Utara Tapanuli Utara Rural 1 14 70 56 141 5 Sumatera Utara Deli Serdang Semi Urban 2 42 185 166 395 6 Sumatera Utara Padang Lawas Rural 2 8 30 29 69 7 Sumatera Barat Lima Puluh Kota Semi Urban 2 9 45 36 92 8 Sumatera Barat Solok Selatan Rural 2 9 63 31 105
9 Sumatera Barat Padang Urban 2 28 95 63 188
10 Sumatera Selatan Banyu Asin Remote 2 19 81 71 173 11 Bangka Belitung Belitung Rural 2 6 35 22 65 12 Bangka Belitung Pangkal Pinang Urban 2 11 43 42 98
13 Kepulauan Riau Bintan Rural 2 6 32 26 66
14 Kepulauan Riau Tanjung Pinang Urban 2 6 23 28 59 15 DKI Jakarta Jakarta Selatan Urban 2 59 249 236 546 16 Jawa Barat Indramayu Semi Urban 2 48 230 208 488 17 Jawa Barat Bekasi Semi Urban 2 63 276 204 545
18 Jawa Barat Bandung Urban 2 59 245 282 588
19 Jawa Tengah Sukoharjo Semi Urban 2 28 127 111 268 20 Jawa Tengah Rembang Rural 2 27 135 100 264 21 Jawa Tengah Kota Surakarta Urban 2 26 116 93 237 22 DI Yogyakarta Bantul Semi Urban 2 46 218 230 496
23 Jawa Timur Kediri Urban 2 12 50 47 111
24 Jawa Timur Jombang Semi Urban 2 44 210 182 438
25 Banten Lebak Rural 2 52 198 208 460
26 Nusa Tenggara Barat Lombok Barat Semi Urban 1 21 104 68 194 27 Nusa Tenggara Barat Sumbawa Barat Rural 2 8 30 28 68 28 Nusa Tenggara Barat Kota Bima Urban 2 10 50 40 102 29 Nusa Tenggara Timur Timor Tengah Selatan Remote 2 7 39 27 75 30 Nusa Tenggara Timur Belu Remote 1 5 25 20 51 31 Kalimantan Barat Sambas Rural 2 15 75 63 155 32 Kalimantan Barat Ketapang Remote 2 12 60 48 122 33 Kalimantan Barat Pontianak Urban 2 18 90 73 183 34 Kalimantan Selatan Tabalong Rural 2 7 34 28 71
35 Kalimantan Timur Paser Rural 2 8 30 21 61
36 Kalimantan Timur Nunukan Remote 2 7 29 18 56 37 Kalimantan Timur Samarinda Urban 2 7 39 21 69 38 Sulawesi Utara Kepulauan Sangihe Rural 1 4 22 16 43 39 Sulawesi Utara Minahasa Tenggara Remote 1 5 15 16 37
40 Sulawesi Selatan Maros Rural 2 8 39 42 91
41 Sulawesi Selatan Bone Rural 1 17 71 77 166 42 Sulawesi Selatan Luwu Utara Remote 2 7 59 48 116 43 Sulawesi Selatan Makassar Urban 2 20 86 84 192 44 Sulawesi Tenggara Kolaka Utara Remote 2 7 34 26 69 45 Sulawesi Tenggara Kendari Urban 2 9 44 36 91
46 Maluku Maluku Tengah Rural 2 11 49 42 104
47 Maluku Kota Ambon Urban 1 11 38 34 84
48 Maluku Utara Halmahera Tengah Remote 2 6 25 17 50 49 Maluku Utara Kota Ternate Urban 2 7 50 32 91 50 Irian Jaya Barat Kota Sorong Urban 1 10 22 12 45
51 Papua Nabire Remote 1 4 20 12 37
52 Papua Keerom Remote 1 4 12 12 29
94 903 4070 3536 8603
Respondents
Total Respondents
Total
3.3. Implementation and Validity Issues
The implementation of the quantitative data collection was effective and there were no major problems during data collection. In a small number of districts nominated respondents were not able to attend and were replaced by the district office. In some cases this meant the link between supervisor, principal and teachers built into the sample design was broken. While this meant we could not cross-check ratings at the individual level we were able to use the data to do a whole of sample check of relative ratings of competency provided by the three groups of respondents.
A second issue was delay in data collection in Medan, Wonogiri and Sumenep which was mentioned previously.
Before analysis was commenced items and dimensions for competency ratings of principals and supervisors were checked using Cronbach Alpha and factor analysis. Cronbach Alpha findings indicated that the competency items and dimensions were valid for both supervisors and principals.
Factor analysis was used to check the validity of the dimensions in the BSNP Standards. The findings from these analyses are discussed in later sections of the report. However, in general, factor analysis found that the dimensions in the Standards and hence in the surveys were valid.
One issue that emerged from the analysis of the supervisor surveys was the invariably very high ratings of supervisor competency given by principals and teachers, especially in MoEC. This issue has some important implications which are discussed later in the report.
3.4. Profile of Respondents
This section of the report provides information about the respondents in the sample of 52 districts and focuses on the national sample as a whole. Volume 3 provides more detailed data about the respondents in the seven (7) regions in which the study was undertaken.
3.4.1. Supervisor Profile
Nine hundred and three (903) supervisors were included in the sample with 710 (78%) being MoEC supervisors and 193 being MoRA supervisors. All profile data were disaggregated by MoEC and MoRA. There are some interesting and important differences in the profiles of MoRA and MoEC supervisors and these issues are highlighted below.
Diagram 4: Sex of Supervisors
MoRA supervisors were younger than MoEC supervisors and also tended to be younger when first appointed. Forty five per cent (45%) of MoRA supervisors were younger than 50 years of age at the time of the surveys and fifty six per cent (56%) were younger than 45 years of age when they were appointed.
Diagram 5: Age of Supervisors
Diagram 6: Age of Supervisors at Appointment
Another important difference relating to the relative experience of MoEC and MoRA supervisors was the position that they held before being appointed as supervisors. A much larger percentage of MoEC supervisors were appointed from principal positions. While this does not necessarily mean that MoEC supervisors were more capable than MoRA supervisors it does mean that had greater school leadership and management experience before becoming supervisors.
However, there was no real difference in the length of time supervisors had held teacher or principal positions before they were appointed as supervisors. Also the same percentage of MoEC and MoRA supervisors held teaching certificates before they were appointed to the supervisor position. In addition, MoRA supervisors in the sample had been in their previous positions slightly longer than their MoEC equivalents.
These factors may counter-balance the fact that more MoEC supervisors had held principal positions before appointment as supervisors.
Diagram 7: Position Held before being Appointed as Supervisor
MoEC supervisors had higher academic qualifications than MoRA supervisors with forty four per cent (44%) of MoEC supervisors holding S2 qualifications.
Diagram 8: Highest Education Qualification – Supervisors Teacher
Highest Qualification - MoEC
DII
Of the supervisors with S1 degrees about seven per cent (7%) were non-education degrees. This figure considered with the fact that about the same proportion were neither teachers nor principals before they became supervisors indicates that there may be about ten per cent (10%) of supervisors in the sample who did not have an education background.
The sample of supervisors included representation from all types of schools/madrasah. As could be expected most supervisors worked with elementary and kindergarten schools. Details are provided in Figure 1.
The significant majority of supervisors, more than ninety per cent (90%) for both MoEC and MoRA, were responsible for academic and managerial supervision.
Figure 1: Supervisors by Types of School/Madrasah
There was a marked difference between the MoEC and MoRA sample of supervisors for the number of schools for which they were responsible. Generally, MoRA supervisors supervised considerably more schools than MoEC supervisors and this could have had an impact on their capacity to implement their responsibilities. Most MoRA supervisors (54%) were responsible for more than 20 schools, but only two per cent (2%) of MoEC supervisors supervised more than 20 schools.
Diagram 9: Number of Schools Supervised
The possible impact of the number of schools supervised could have been exacerbated by the location of supervisor offices and schools. While more than ninety per cent (90%) of MoRA and MoEC supervisors’ offices were located in urban or semi urban areas, slightly more MoRA supervisors were located in rural and remote locations which may make it more difficult for them to undertake their responsibilities.
Only three per cent (3%) of MoEC supervisors and one per cent (1%) of MoRA supervisors were located in border areas of Indonesia.
Diagram 10: Location of Supervisor Offices
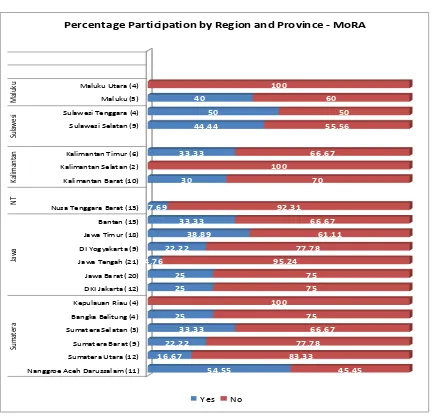
Another major area of difference between the two groups of supervisors was related to participation in INPRES staff strengthening training. Three times as many MoEC supervisors had participated in INPRES compared to MoRA supervisors. In addition, for MoRA, there were significant imbalances across regions and provinces.
Diagram 11: Participation in INPRES Staff Strengthening Training
Figure 2: MoRA Supervisor Participation in INPRES Training by Region and Province
Nanggroe Aceh Darussalam (11)
Percentage Participation by Region and Province - MoRA
3.4.2. Principal Profile
The principal sample comprised 4,070 principals with 828 from MoRA and 3,242 from MoEC.
The gender imbalance between male and female was again considerable but was not as great as the imbalance in the supervisor sample.
Diagram 12: Sex of Principals
In this sample, while MoEC had a slightly higher percentage of female principals than MoRA the differences were reversed (see Diagram 4) for supervisor positions, perhaps indicating that, for MoEC, the gender imbalance increases with the seniority the position.
The difference increased dramatically for heads of district education office positions.
The study did not investigate the reasons for the imbalance between males and females in education leadership positions. However, it should be highlighted that the relatively small percentage of females in senior leadership positions contrasts with the number of males and females (see Figure 3) employed as teachers by MoEC and MoRA.
Male 64.03%
Female 35.97%
MoEC
Male 69.81%
Female 30.19%
MoRA
Figure 3: Ratio Female to Male Teachers 2000/01 to 2009/10 – MoEC
Data concerning age, qualifications and experience of principals indicated that MoEC principals were slightly better qualified and more experienced as educators than MoRA principals.
The age profile of principals is provided in Diagrams 13 and 14. As with supervisors, MoRA principals were generally younger than MoEC principals and were younger when they were first appointed to the position of principal.
In addition, MoRA principals tended to have fewer years as a teacher before they were appointed to the principal position. Ninety six per cent (96%) of MoEC principals had been teachers for more than five years before first being appointed as principal compared to eighty five per cent (85%) of MoRA principals.
Diagram 13: Age when First Appointed as Principal
115.8
2000/01 2001/02 2002/03 2003/04 2004/05 2005/06 2006/07 2007/08 2008/09 2009/10
Source: MOEC Primary Junior Sec. Senior Sec.
Diagram 14: Age of Principals
The qualifications of the sample of principals for MoEC and MoRA were similar with the majority holding an S1 qualification. Over 90 per cent of all principals held either S1 or S2 qualifications. Of the principals holding S1 degrees, slightly more MoEC principals (90% to 85%) had specialised in education. This was reversed for those with S2 degrees with seventy six per cent (76%) of MoRA principals having education S2 degrees compared to (65%) for MoEC principals.
Diagram 15: Qualifications of Principals
More MoEC than MoRA (85% compared to 76%) principals had held a teaching certificate before being appointed as a principal. However, only a minority of both groups held principal certificates.
Diagram 16: Percentage of Principals Having a Principal Certificate
As with supervisors, considerably more MoEC principals (43%) than MoRA principals (21%) had participated in INPRES staff strengthening training. However, in contrast to the findings for supervisors, participation of MoRA principals was generally more evenly spread across provinces.
As for supervisors the data was analysed to determine if the difference in participation was a significant factor affecting principals’ competency.
3.4.3. School Data
The next set of data provides information about the 4,070 schools in the quantitative sample.
As with principals eighty per cent (80%) of the schools were MoEC schools and twenty per cent (20%) were MoRA schools or madrasah.
The MoRA sample contained a higher proportion of rural schools than the MoEC sample. The effect of this on competency ratings is considered later in the report. Table 5 provides an overview of schools by geographic location.
Table 5: Schools by Location
Location
Number/Percentage
MoEC MoRA
Number Percentage Number Percentage
Urban 1,308 40.35 259 31.28 schools/madrasah. However, the MoRA sample included a greater percentage of kindergartens and the MoEC sample a greater percentage of vocational high schools.
Diagram 18: Type of School
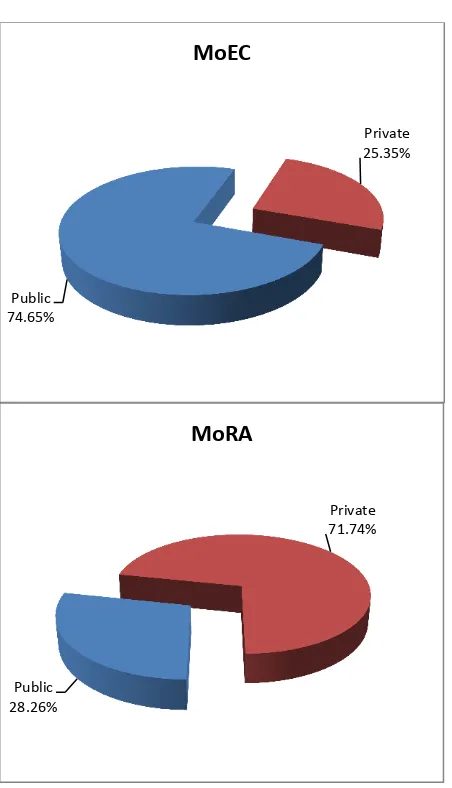
There was a major difference between MoEC and MoRA samples with regard to the status of schools - public or private. The large majority of the MoRA madrasah/schools sample was classified as private, most being private madrasah managed by foundations. This is an important difference and the impact on competency of principals and their CPD needs is discussed further later in the report.
In the progress report on the analysis of a sub-sample of schools, which was presented in November 2012, there was a strong correlation between school status and principal competency with private school principal competency being significantly lower than public school principals.
Diagram 19: School Status
A further important factor to be considered in assessing the link between principal competency and school status was the distribution of private schools across provinces. Some provinces had a significantly higher proportion of private madrasah in the MoRA sample which may have an impact on ratings of principal competency if the findings from the progress report are repeated for the full sample. Figure 4 provides details of the distribution of private and public schools/madrasah for the MoRA sample.
Public 74.65%
Private 25.35% MoEC
Public 28.26%
Private 71.74% MoRA
Figure 4: Distribution of Private and Public Schools/Madrasah by Region – MoRA
Proportion of Public and Private Schools/Madrasah - MoRA
Public Private
The survey also collected information about the accreditation level of schools in the sample.
For MoEC, eighty six per cent (86%; n=2,785) of schools in the sample had been accredited and for MoRA eighty two per cent (82%; n=678) of schools had been accredited.
For those schools that had been accredited, MoEC schools had higher accreditation levels with more in the Level A category and fewer in the Level C category.
Diagram 20: School Accreditation Level
Diagram 21: MoRA - School Accreditation Level by School Status
3.4.4. Teacher Profile
A sample of 3,536 teachers provided data about their principals and supervisors. Their data was used to cross-check principal and supervisor self-ratings of competency.
Table 6: Teachers by MoRA/MoEC and Sex
Sex
Number/Percentage
Totals
MoEC MoRA
Number Percentage Number Percentage
Female 1,481 53.56 388 50.32 1,869
Male 1,270 45.93 379 49.16 1,649
Missing Data 14 .51 4 .52 18
Totals 2,765 100 771 100 3,536
The sample was structured so that there was a balance between experienced and new teachers and between teachers who had worked with the principal for a longer period and those who had spent relatively little time working with the principal. MoEC teachers were more experienced than MoRA teachers in the sample but had generally been in their schools for more years than MoEC teachers. Diagram 22: Years as a Teacher
Diagram 23: Years in the School
Diagram 24: Certification Status of Teachers
3.4.5. Head of District Education Office Profile
The study sample also included ninety four (94) heads of district education offices (53 MoEC and 41MoRA). District education heads provided more general information about the competency of their supervisors and principals and the CPD needs of supervisors and principals.
They also provided more specific information about the district implementation of Regulations 12/2007 and 13/2007.
The data provided by district education office heads was used to cross check supervisor and principal ratings.
Certified 66.26%
Not Certified
32.15%
N/A 1.59% MoEC
Certified 54.73%
Not Certified
44.10%