NDVI DYNAMICS OF THE TAIGA ZONE IN CONNECTION WITH MODERN
CLIMATE CHANGES
A. Bobkov a , E. Panidi b, N. Torlopova c, V. Tsepelev d, *
a Saint-Petersburg State University, Institute of Earth Sciences, Department of Physical Geography and Landscape Design, 33-35 10-th line V.O., 199178 Saint-Petersburg, Russia
b Saint-Petersburg State University, Institute of Earth Sciences, Department of Cartography and Geoinformatics, 33-35 10-th line V.O., 199178 Saint-Petersburg, Russia
c Russian Academy of Sciences, Ural Branch, Komi Scientific Center, Institute of Biology, 28 Kommunisticheskaya st., 167982 Syktyvkar, Russia
d Russian State Hydrometeorological University, Meteorological Department, 98 Malookhtinsky prospect, 195196 Saint-Petersburg, Russia – [email protected]
KEY WORDS: Climate Change, Vegetation Cover, Dynamics of Vegetation, Taiga Zone
ABSTRACT:
This research is dedicated to the investigation of the relations between the XXI century climate changes and Normalized Difference Vegetation Index (NDVI) variability of the taiga zone. For this purposes was used the observations of vegetation variability on the test area located nearby Syktyvkar city (Komi Republic, Russia), 16-day averages of NDVI data derived from TERRA/MODIS space imagery (spatial resolution is about 250 meters), and the air temperature and precipitation observations from Syktyvkar meteorological station.
The research results confirmed the statistically significant positive correlation between NDVI and air temperature for all vegetation types of the test area, for both spring and autumn seasons. The weakest correlation was found for coniferous forest, namely, pine forest on poor soils, and the strongest correlation was found for meadows and bogs.
Additionally the map of NDVI trends of the test area shows that the sectors of greatest positive trend located on the territories with non-forest cover, and as a result, the positive trend of air temperature is indicated most brightly on vegetation of non-forest lands. Thereby these lands can serve as climate changes indicator in the investigated region.
The study was partially supported by Russian Foundation for Basic Research (RFBR), research project No. 14-05-00858 a.
* Corresponding author
1. INTRODUCTION
Climate change in northern Eurasia appears in the seasonal variation of the precipitation, air temperature, sea ice cover and vegetation distribution (Kattsov, 2004; Wookey at al., 2009). However, the hydrometeorological network of the Russian northern territories has decreased its density over the past 30 years. Therefore, the quality of climate change monitoring within the continental areas is not high enough.
Nevertheless, there is a long series of satellite observations of vegetation at these regions, which we can use to study the climate change dynamics. The remote sensing data, in particular vegetation index data (NDVI), allow us to study vegetation cover change of arctic and subarctic regions (Goetz at al., 2007; Jia at al., 2009; Stow at al., 2004). A gradual change in the vegetation type, especially at the areas occupied by annuals, should follow the changing of temperature and humidity conditions. Some studies showed that changes at the areas of shrub vegetation types in Siberian and Canadian Arctic tundra has a positive correlation with summer air temperature (Jia at al., 2006; Jia at al., 2009; Walker at al., 2006; Wookey at al., 2009). That is why we can try to use the vegetation dynamics as an indicator of the climate change impact on terrestrial ecosystems (Goetz at al., 2007; Krankina at al., 2010).
The main objective of our study was the determination of the techniques, which may indicate climatic changes in the mainland areas of northern regions of Russia. For this purpose, we studied the relationships between vegetation index for
different types of vegetation, derived from remote sensing materials, and terrestrial observations of air temperature and precipitation.
2. METHODOLOGY
To investigate the relationships between the vegetation characteristics and climate change, we attempted to identify the types of vegetation that are most affected by the temperature and humidity conditions. This study was conducted on the ground test area, which is covered with the long series of vegetation observations.
We used the vegetation index data for vegetation analysis. Being synthetic dimensionless indicator NDVI has strong correlations with the productivity and biomass of vegetation for various ecosystem types (Cherepanov at al., 2009).
For selection of the NDVI data source, we had to take into account the next three basic requirements. The first is that the spatial resolution of the data should allow us to detect the types of plant communities (Jia at al., 2006; Jia at al., 2009).
presence of cloud cover that leads to the greater number of observation gaps. These gaps resume errors in the computation of long-term vegetation index trends. Then the observation technique should provide the opportunity to collect data with high frequency, which able to capture short cloud free periods. Finally, the third is that the length of the data series should be at least 10 years. Within a shorter time interval, it is difficult to notice the changes that occur in the structure of vegetation cover.
Almost the only dataset that corresponds the above-mentioned requirements is the archive of MODIS imagery obtained from TERRA satellite with approximate spatial resolution of 250 meters per pixel. MODIS imagery cover the area of our interest every day and NDVI data are obtained from raw datasets as the standard product averaged for 16-day intervals. This technique increases the probability of cloudless vegetation data observation, and makes it possible to generate a continuous series of observations.
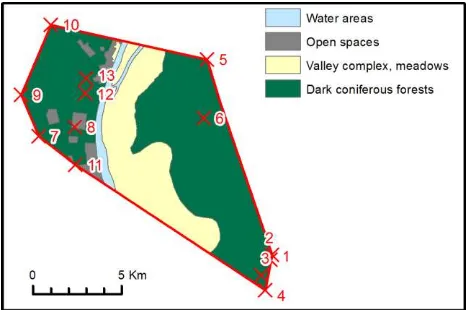
The vegetation types, vegetation density and condition, and also the surface slope and aspect are also influence NDVI magnitude (Cherepanov at al., 2009). Due to this context, we used the ground test area, where the terrestrial vegetation monitoring conducted repeatedly, for the correct interpretation of long-term NDVI trends (Figure 1). Additionally, one of meteorological stations of the Russian hydrometeorological observation network is located on the area, and allows the direct observation of air temperature and precipitation changes. Then the data collections of vegetation and meteorological monitoring are presented for this area for some past decades.
This test area located in the middle taiga zone of the Komi Republic (north-west region of Russia).
Figure 1. Distribution of the vegetation types on the ground test area. The numbers allocate sample plots positions on the ground
test area that were used for direct terrestrial observations
3. DATA AND TECHNIQUES
3.1 Remote Sensing Data
The NDVI maps were produced using TERRA/MODIS imagery. These datasets preprocessed as standard product and distributed as public domain data1. Rasters of ~5 km, ~1 km and ~250 meters spatial resolution averaged per 1 month or 16 days and published online. In this project we used 16-day NDVI datasets of 250 meters spatial resolution, collected over the period from 2000 to 2013. These data allowed us to study
1http://modis.gsfc.nasa.gov/data/dataprod/index.php
NDVI change in connection to the change in temperature and precipitation during the full growing season.
3.2 Meteorological Data
For climate change investigation at the ground test area we used the observation data, which collected at the Syktyvkar meteorological station. The dataset range is also from 2000 to 2013.
To provide the statistical analysis we involved daily averaged air temperature and daily total precipitation. The data series of the mean daily temperature and total precipitation values were averaged for the 16-day periods equally to the NDVI data. Furthermore, the secondary meteorological parameters were calculated additionally for the growing seasons:
1. Average air temperature
2. Accumulated amount of air temperatures 3. Average total precipitation
4. Accumulated total precipitation
3.3 Natural Conditions of the Study Area
The study area is located in the taiga zone in the European North-East (Russia, Komi Republic, Syktyvdinsky district). The ground polygon area covers the territory of Syktyvkar Forestry and forest territories administrated by Syktyvkar Timber Industry Complex and some agricultural companies.
The city of Syktyvkar with surrounding suburban areas, green areas and floodplain of river Vychegda are lying within the test area.
3.4 Vegetation of the Study Area
The vegetation cover types of the ground test area are presented on Figure 1. The area is located in the boreal forests (taiga) zone of the European North.
Forested part of the test area is located on the Syktyvkar Forestry territory. This forested part of Syktyvkar Forestry occupies approximately 92% of its total area.
The forested part combined by approximately ~77% of deciduous (~38% of total area) (Forestry organization…, 1988).
3.5 Growing Seasons
The study of climate change was conducted for the growing seasons. We calculated the averaged beginning and ending dates of the growing seasons, in which some significant changes in vegetation index dynamics could be detected (Sadokov et al., 2012). These are spring, summer and autumn seasons. The boundary dates were calculated as the average dates for the period from 2000 to 2013 (Table 1).
Period Beginning Ending Duration
Spring 13 May 3 June 22 days
Summer 04 June 21 August 78 days
Autumn 22 August 29 September 39 days
Table 1. The averaged frames of the growing seasons during 2000-2013
3.6 Data Visualization
The ArcGIS2 and ArcReader3 software were used for processing of the raw data and for cartographic visualization of the spatial distribution of vegetation index values and climate parameters. The ArcGIS was used as the instrument of data processing and visualization. Additionally the ArcReader played the role of tool for data representation for visual analysis and detailed data examination by thematic specialists.
This two-stage data representation was used to provide single data view for all research group participants as well as to minimize the adaption efforts to new software for thematic specialists that generally use some another specific software for data visualization.
3.7 Comparative Analysis
We calculated the spatial distribution grids of linear trend coefficients for surface temperature, precipitation and NDVI for each growing season. Then we applied the Spearman’s rank correlation method to calculate the spatial distribution grids of correlation coefficients between surface temperature and NDVI, as well as between precipitation and NDVI.
4. CLIMATE AND VEGETATION TRENDS
Air temperature and daily precipitation sums at the Syktyvkar meteorological station varied in a wide range during the study period in 2000-2013. The most dry and hot years were observed in the 2000, 2010 and 2011. The most cold and wet years were 2008, 2012.
The trend of 16-day averaged air temperature was about +1 ̊C for 14 years of the study period. Trend of 16-day averaged total precipitation was approximately +10 mm for 14 years.
Trends are significant at the 95% confidence level.
4.1 Air Temperature
The graphs of the air temperature averaged by growing seasons, show that the rise of temperature from 2000 to 2013 had different intensity (Figure 2).
Maximum positive coefficients of the air temperature linear trends were observed in spring. The average spring temperature during 14 years increased for more than 2 ̊C. Rising of the summer average temperature did not exceed 1 ̊C during 14 years. Finally, in autumn season, the air temperature rose just about 1 ̊C during 14 years.
2http://www.esri.com/software/arcgis/arcgis-for-desktop
3http://www.esri.com/software/arcgis/arcreader/download
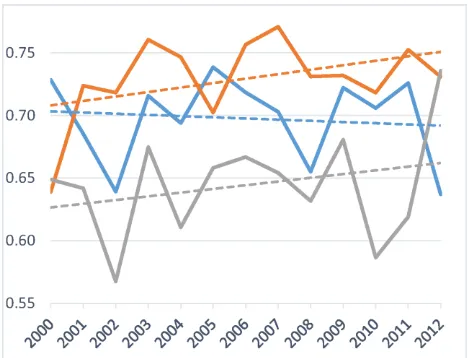
Figure 2. Graphs of the air temperature (̊C) at the Syktyvkar station, from 2000 to 2013. The temperature is averaged by seasons (blue graph – spring, orange – summer, grey - autumn)
Figure 3. Graphs of the total precipitation (mm) at the Syktyvkar station, from 2000 to 2013. The precipitation is summarized by seasons (blue graph – spring, orange – summer,
grey - autumn)
Figure 4. Graphs of the NDVI at the test area, from 2000 to 2013. The NDVI is averaged for test area and by seasons (blue
4.2 Precipitation
The graphs of the summarized spring, summer and autumn precipitation shows that the precipitation sums rose with different intensity from 2000 to 2013 too.
Positive and statistically significant coefficients of the precipitation linear trends observed for summer. The summarized summer precipitation increased approximately for 40 mm during 14 years.
The precipitation, summarized for spring season, decreased slightly. Maximum increase of precipitation sums was observed in the autumn season and was about 60 mm during 14 years. (Figure 3).
4.3 Vegetation Index
Vegetation index, averaged for the ground test area was unstable from 2000 to 2013, due to the changing of temperature and precipitation conditions on the area. The main feature of the index is its slow rise in spring and summer and a sharp decrease in autumn. The highest NDVI magnitude observed in summer of 2007 (0.77). The lowest summer NDVI value observed in 2000 (0.64). Over the whole study period, the average NDVI value increased.
This NDVI increasing indicates the slow and gradual improvement of climate conditions for vegetation growth on the test area. The growth was consistent with the increasing of precipitation sums and air temperature.
The combinations of average index values for summer, spring and autumn periods show that the most favorable conditions for vegetation were in 2003 and 2006. The worst years for the vegetation were 2002, 2008 and 2010, 2012 (Figure 4). NDVI variability was different in the different growing seasons. There was no significant change in the average NDVI magnitude in spring. The maximum increase occurred in summer (0.71 to 0.75). Additionally, the index rose from 0.63 to about 0.66 in autumn.
The trends are significant at the 95% confidence level.
4.4 Spatial Distribution of the Vegetation Index Trends
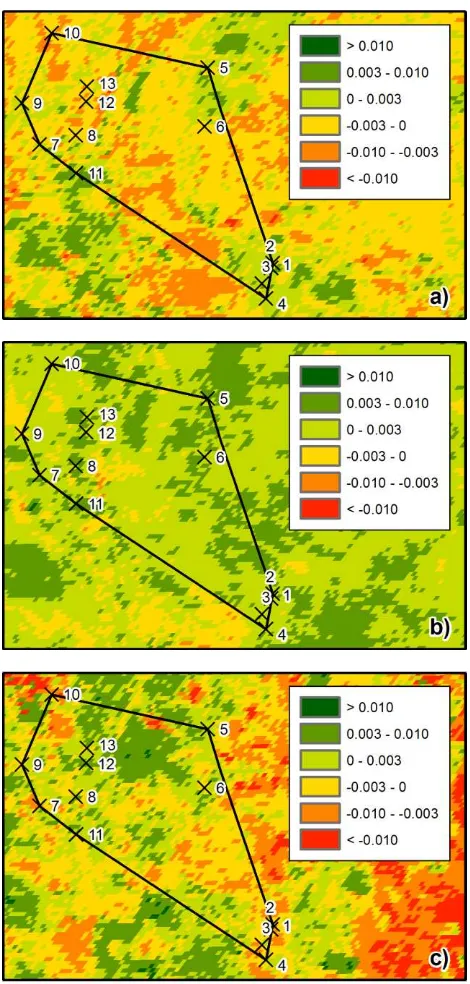
NDVI spatial distribution and spatial differentiation depend on the vegetation types, vegetation closeness and health. We calculated the full growing season NDVI trends for different sample plots of the ground test area, which are occupied by different vegetation types. Additionally we produced the NDVI trend maps of the test area, separately for each growing season (Figure 5).
Analysis of these trend maps shows us that most part of the area has the significant positive trend during all seasons. Sectors of the area, which are occupied by evergreen coniferous forests, preserves the positive NDVI trend also during all three seasons. The sectors of the maximum trend values, which were observed in summer season, are occupied by shrub and meadow vegetation. In spring and autumn seasons the trends are largely neutral. The trend sign was positive in these seasons on scrubs and grasslands in floodplains.
Figure 5. Spatial distribution of the vegetation index trends on the ground test area in the spring (a), summer (b) and autumn
(c).
4.5 NDVI – Air Temperature and NDVI – Precipitation Relationships
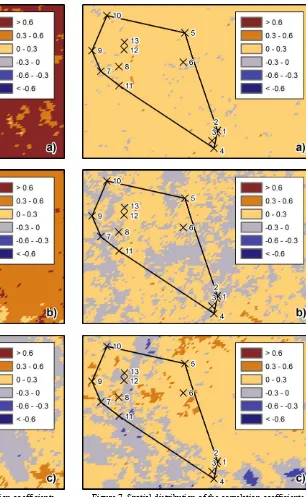
Figure 6. Spatial distribution of the correlation coefficients between NDVI and air temperature in the spring (a), summer
(b) and autumn (c) seasons
In summer season, the degree of correlation between NDVI and air temperature decreases. Maximum significant correlation coefficient values were observed on the territories occupied by non-forest lands. Minimum coefficient values were observed on the evergreen coniferous forests. In autumn, these territories have the negative values of correlation coefficient. The significant positive correlation values in autumn season remained only on floodplains.
The positive correlation coefficient values between NDVI and precipitation sums observed on significant part of the ground test area (Figure 7). In summer season, we can discover the significant positive correlation coefficient values mostly on non-forest lands in floodplains. On the territories of evergreen coniferous forests, we can allocate the significant negative values of correlation coefficient.
Figure 7. Spatial distribution of the correlation coefficients between NDVI and total precipitation in the spring (a), summer
(b) and autumn (c) seasons
Also in autumn season the negative correlation values observed on non-forest lands. The greatest negative values of correlation coefficient are observed on the floodplains. The coefficient values of correlation between the precipitation sums and vegetation index magnitudes are always positive on the territories of evergreen coniferous forests.
4.6 Relationships of NDVI and Vegetation Characteristics of the Ground Test Area
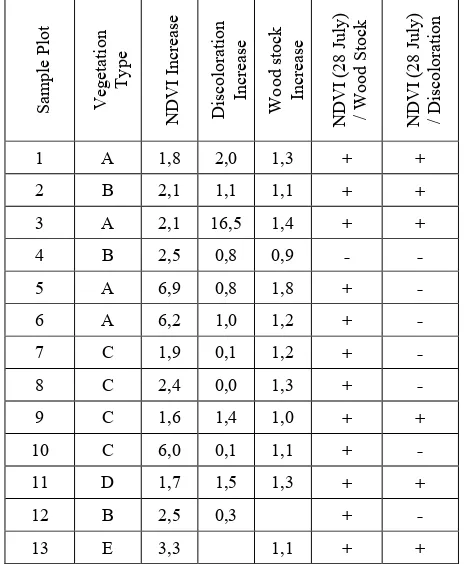
observations provide such vegetation productivity parameters as stands density, the wood stock of living and dead trees and discoloration degree of the tree crowns.
The discoloration coefficients are calculated according to the method that implemented in the ICP-Forests manual (Manual on methods and criteria…, 1994). The discoloration of vegetation clearly reflects the state of tree vegetation. This parameter could be observed using satellite measurements as the value of chlorophyll index (vegetation index). However, the change of vegetation productivity could not be measured directly using remote sensing methods (Cherepanov at al., 2009).
We analyzed the change in NDVI on sample plots (Figure 1) on July 28. This date is the closest to the date of field observations. As we can see, the increase of NDVI values does not necessarily correlate with changes in the wood stock and discoloration degree of coniferous trees (Table 2).
The wood stock increases due to the growth of the tree, and positively correlates with an increase of NDVI. However, yellowing of pine and spruce needles at the six plots, which was observed on ground, is not associated with a decrease of NDVI. This discontinuity may be caused by the difference in size of the spatial resolution of NDVI maps that exceeded the size of the
Table 2. Change of the NDVI, discoloration degree and wood stock. The positive signs mark the unidirectional changes, and the negative signs mark oppositely directed changes. Forest types marked as A – Pine-lichen, B – Pine-green moss, C –
Spruce-green moss, D – Grassy pine, E – Pine-sphagnum
5. CONCLUSIONS
The study of long-term relationships and dynamics of climate characteristics and vegetation index at the ground test area leads to the following conclusions.
A gradual increase of the air temperature and precipitation was observed during the studied period at the Syktyvkar meteorological station. The most distinct positive and statistically significant trend of precipitation discovered in the autumn season, and the positive and statistically significant trend of air temperature observed in spring season.
The warmest year was in 2010, and the coldest in 2002. In addition, the wettest was in 2012, and the driest was in 2005. The dynamics of vegetation index was depended on significant volatility of the meteorological conditions in these years. In accordance with the dates of the most cool and dry years, vegetation index reached the lowest values in 2002, 2008 and 2010. The most favorable conditions for plant growth were observed in 2003 and 2006.
Statistically significant positive vegetation index trends at the ground test area were consistent with the positive trends of air temperature and precipitation. These positive trends were preserved throughout three seasons on evergreen coniferous forest territories.
The maximum positive vegetation index trends were observed in summer season at the territories occupied by non-forest lands. In spring and autumn seasons the trend values remains positive only for non-forest lands located at floodplains. The values of coefficient of the correlation between NDVI and air temperature is statistically significant and positive in the spring season for the whole ground test area. Rising of the air temperature and precipitation sums during the last 14 spring periods caused the corresponding improvement in vegetation conditions for all vegetation types.
The values of correlation between NDVI and air temperature is significant and positive for all vegetation types of the test area in the summer season, but the positive correlation values are minimal for evergreen coniferous forests.
The correlation between precipitation sums and NDVI during the summer period is significant and positive only for non-forest lands (floodplains). For the evergreen coniferous forest territories, the coefficient values of correlation between precipitation sums and NDVI are statistically significant and negative.
For autumn period, the correlation between NDVI and air temperature is statistically significant and positive for non-forest lands only. This dependence could be explained by prolongation of growth season for annual plants of floodplains. At the evergreen coniferous forest sectors, the autumn temperature regime does not affect on the vegetation state. Negative correlation coefficient values for the precipitation sums and NDVI exist on the non-forest lands in autumn period. At the sectors occupied by evergreen coniferous forests, correlation of precipitation and NDVI is positive. The temperature growth improves vegetation conditions on non-forest lands only while decreasing of the precipitation sums. The NDVI dynamics at the test area was verified using ground observation data produced on permanent sample plots. NDVI trends distribution at sample plots is mosaic like. This caused forest diseases. Hence, we should consider in investigations the anthropogenic influence, which could distort natural NDVI pattern.
discoloration degree of the crowns of coniferous trees. This finding requires more detailed investigations.
Basing on the above-mentioned information, we can conclude that the state of non-forest vegetation of floodplains, characterized by NDVI in the spring-summer period, could serve as an indicator of long-term changes in temperature and precipitation conditions in the region. The anthropogenic impact should be taken into account when assessing climate change. This impact can distort the natural pattern of vegetation.
ACKNOWLEDGEMENTS
The study was partially supported by Russian Foundation for Basic Research (RFBR), research project No. 14-05-00858 a.
REFERENCES
Cherepanov A., Druzhinina E., 2009. Spectral characteristics of vegetation and vegetation indexes. Geomatics, 3(4), pp. 28-32. (Published in Russian)
Forestry organization and development project of Syktyvkar mehleskhoz of the Komi ASSR Ministry of Forestry RSFSR Ministry of Forestry, 1988. Explanatory note, Part 1, Leningrad, pp.10-18. (Published in Russian)
Goetz S.J., Mack M.C., Gurney K.P., Randerson J.T., Houghton R. A., 2007. Ecosystem responses to recent climate change and fire disturbance at northern high latitudes: observations and model results contrasting northern Eurasia and North America. Environmental Research Letters, 2, 045031 (9pp). doi:10.1088/1748-9326/2/4/045031
Jia G.J., Epstein H.E., Walker D.A., 2006. Spatial heterogeneity of tundra vegetation response to recent temperature changes. Global Change Biology, 12, pp. 42-55.
Jia G.J., Epstein H.E., Walker D.A., 2009. Vegetation greening in the Canadian Arctic related to decadal warming. Journal of Environmental Monitoring, 11, pp. 2231-2238
Kattsov V.M., 2004. Arctic climate in the 21st century: Modelling and scenarios. Vulnerability to global environmental change. A summary of climate change impact assessments from the U.S. Country Studies Program. Cambridge University Press, pp.99-150
Krankina O. N., Pflugmacher D., Hayes D. J., McGuire A. D., Hansen M. C., Hдme T., Elsakov V., Nelson P., 2010. Vegetation Cover in the Eurasian Arctic: distribution, monitoring, and role in carbon cycling. Chapter 5. Eurasian arctic land cover and land use in a changing climate. Springer, 1st edition, pp. 79-108
Manual on methods and criteria for harmonised sampling, assessment, monitoring and analysis of the effects of air pollution on forests, 1994. Hamburg, 177 p.
Sadokov B. N., Kozeltseva C. F., Kuznetsova N. N., 2012. Definition of spring dates of steady transition of the average daily air temperature through 0, +5 °C, forecast and assessment. Proceedings of the Hydrometeorological Center of Russia, Vol. 347, pp. 162-172. (Published in Russian)
Stow D. A., Hopea A., McGuireb D., Verbylac D., Gamond J., Huemmriche F., Houstond S., Racinef C., Sturmg M., Tapeh K., Hinzman L., Yoshikawai K., Tweediej C., Noylek B., Silapaswanl C., Douglasm D., Griffithn B., Jiao G., Epsteino H., Walkerp D., Daeschnera S., Petersena A., Zhouq L., Myneni R., 2004. Remote sensing of vegetation and land-cover change in Arctic Tundra Ecosystems. Remote Sensing of Environment, 89, pp. 281-308
Walker M. D., Wahren C. H., Hollister R. D., Henry G. H. R., Ahlquist L. E., Alatalo J. M., Bret-Harte M. S., Calef M. P., Callaghan T. V., Carroll A. B., 2006. Plant community responses to experimental warming across the tundra biome. Proceedings of the National Academy of Sciences of the United States of America, 103(5), pp. 1342-1346
Wookey P. A., Aerts R., Bardgett R. D., Baptist F., Brathen K. A., Cornelissen J. H. C., Gough L., Hartley I. P., Hopkins D. W., Lavorel S., Shaver G. R., 2009. Ecosystem feedbacks and cascade processes: understanding their role in the responses of Arctic and alpine ecosystems to environmental change. Global Change Biology, Vol. 15, pp. 1153-1172