FOREST COVER CHANGE AND SOIL EROSION IN TOLEDO
’S RIO GRANDE
WATERSHED
S. D. Chicas, K. Omine,
Department of Civil Environmental Engineering, Nagasaki University, 1-14 Bunkyo Nagasaki 852-8521, Japan- ([email protected], [email protected])
KEY WORDS: Maya, Land Use Change, Forest, Erosion, RUSLE, GIS
ABSTRACT:
Toledo, the southernmost district, is the hub of Belize’s Mayan population, descendants of the ancient Mayan civilization. The Toledo District is primarily inhibited by Kekchi and Mopan Mayans whose subsistence needs are met by the Milpa slash-and-burn agricultural system and the extraction of forest resources. The poverty assessment in the country indicates that Toledo is the district with the highest percentage of household an individual indigence of 37.5 % and 49.7 % respectively. Forest cover change in the area can be attributed to rapid population growth among the Maya, together with increase in immigration from neighboring countries, logging, oil exploration and improvement and construction of roads. The forest cover change analysis show that from 2001 to 2011 there was a decrease of Lowland broad-leaved wet forest of 7.53 km sq, Shrubland of 4.66 km sq, and Wetland of 0.08 km sq. Forest cover change has resulted in soil erosion which is causing the deterioration of soils. The land cover types that are contributing the most to total erosion in the Rio Grande watershed are no-forest, lowland broad-leaved wet forest and submontane broad-leaved wet forest. In this study the Revised Universal Soil Loss Equation (RUSLE) was employed in a GIS platform to quantify and assess forest cover change and soil erosion. Soil erosion vulnerability maps in Toledo’s Rio Grande watershed were also created. This study provides scientifically sound information in order to understand and respond effectively to the impacts of soil erosion in the study site.
INTRODUCTION
In Central America, domesticated, as well as non-domesticated lands are under increasing pressure because of increasing population and demands for services and products from a fixed natural resources base, increasing use of marginal lands, and scarce resources, and intensification of agriculture on existing cultivated and pasture lands (Farrow and Winograd, 2001). According to FAO, forest cover change during 2000-2010 in Central America and South American countries was estimated at 1.2% and 0.5% annual rates respectively, compared to 0.49% annual rate in Africa, 0.19% in Asia and the Pacific region, 0.03% in North America, and 0.09% in Europe (Portillo-Quintero et al. 2012). Latin America, consequently, is an example of a particular region experiencing large-scale land use land cover change (LUCC) (Zeledon and Kelly, 2009). The conversion of forestland to cropland, grazing land, and settlements has often resulted in soil degradation and nutrient losses (An et al. 2008). Erosion by water following the clearance of the natural vegetation directly reduces agricultural productivity and, as a consequence, reduces food security (Mutekanga et al. 2010). Moreover, according to Lapointe, in the Caribbean region, pollution from land-based sources is considered one of the most important threats to the marine environment and to the sustainable use of its resources.
The Rio Grande Watershed is of particular interest because it is one of the watersheds in the Toledo district that is suffering from soil erosion, soil degradation, degradation of ecological environments, and it discharges into the Caribbean Sea. The further degradation of this watershed will have major effects not only on the ecology, economy, food security and public health of the communities living within its boundaries but also on the coastal zone ecosystems. In the watershed catchment forest clearing, erosion, soil degradation, forest fragmentation, unplanned urban expansion and unsustainable agriculture practices are occurring as a result of changes in land use
practices, rapid population growth and immigration. Land-use practices have provided societies with a variety of benefits, including increased food production, but often also come with trade-offs in terms of loss of biodiversity and alteration of hydrology and water quality, among others (Farley et al. 2012). The degradation of the natural resources in the Rio Grande watershed threatens the very livelihood of the rural population living within its boundaries . LUCC and erosion data are necessary for monitoring, evaluating, protecting and planning for earth resources (Rawat et al. 2013); thus, the availability of this data is crucial for the effective management of the Rio Grande Watershed. The goal of this study is to detect forest cover change and rates of erosion from 2001-2011, to identify erosion vulnerable areas and to pinpointed where LUCC and erosion are occurring. This study will generate scientifically sound information that can be used to understand and respond effectively to land use changes and erosion in the study area.
RESEARCH AREA
The Rio Grande watershed is located in the Belize’s Toledo District, which is the center of the Mayan population. The headwaters of the Rio Grande are in the Bladen Nature Reserve and the Columbia River Forest Reserve, which are within the Mesoamerican Biological Corridor. The Rio Grande watershed consists of three geomorphological areas. Volcanic material and limestone karst constitute the upper reaches of the watershed, which draining into the flat alluvial plain of its mid reaches and into the limestone of its lower reaches (Fig. 1). The river drops through sinkholes and emerges out of springs as it makes its way through the underground limestone cave systems on its way through indigenous Mayan communities and then coastal Creole communities before reaching Belize’s World Heritage Barrier Reef (McLoughlin, 2010).
the earth's biota is found in the Mesoamerican biodiversity hotspot; more than 7% of the global species are found here in less than 0.5% of the global land area (Ray et al. 2006). This watershed is considered a hot-spots of biodiversity, as it is part of the Selva Maya Corridor, and the Mesoamerican Biological Corridor. The communities of San Pedro Columbia and San Miguel, in the upper Rio Grande watershed, are particularly dependent on the watershed rivers as a source of drinking water, for washing and for irrigation for subsistence agriculture (McLoughlin, 2010). In the Toledo District, the milpa slash-and-burn agricultural system has evolved in response to local conditions and provides the Kekchi and Mopan Mayans of the region with most of their subsistence needs (Emch et al. 2005). The poverty assessment in the country indicates that Toledo is the district with the highest percentage of household an individual indigence of 37.5 % and 49.7 % respectively (Halcrow Group Limited et al. 2010); thus, the sustainable development and management of the natural resources in the watershed are of crucial importance.
Figure 1. Study Site
Nevertheless, the biodiversity and human wellbeing of this watershed are being threatened by extraction of forest resources, unsustainable LUCC practices and erosion. Changes in LUCC and erosion, have been directly linked to food security, human health, urbanization, biodiversity loss, transborder migration, environmental refuge, water and soil quality, and runoff and sedimentation rates, among other processes (Mendoza et al. 2011). As unsustainable LUCC practices continue to occur in the watershed runoff and sedimentation rates are expected to increase which will lead to the depletion of soil nutrients contributing to the decline of productivity and increasing poverty. Therefore, it is essential to map and quantify the degree of LUCC and erosion in the Rio Grande watershed.
METHODOLOGY
Several distributed hydrological models such as the Universal Soil Loss Equation (USLE), the Water Erosion Prediction Project Model and the Soil and Water Assessment Tool (SWAT) have been used to study the impacts of land use change and soil conservation measures on soil erosion and
sediment yield (Zhang et al. 2014). For this study the Revised Universal Soil Loss Equation (RUSLE) was used to calculate erosion A (ton/ ha /yr) expected on field slopes as (Thattai, 2003).
A= R x K x L x S x C x P (1)
where A = annual average soil erosion expected on field slope (t ha-1 yr-1)
R = Rainfall-runoff erosivity factor, function of storm energy and intensity (MJ mm ha-1 yr-1)
K = Soil erodibility factor, a measure of the soil properties (t ha h ha-1MJ-1mm-1)
L = slope length factor S= slope steepness factor
C = Cover-management factor, a measure of the land use
P = support practice factors, a measure of best management practice
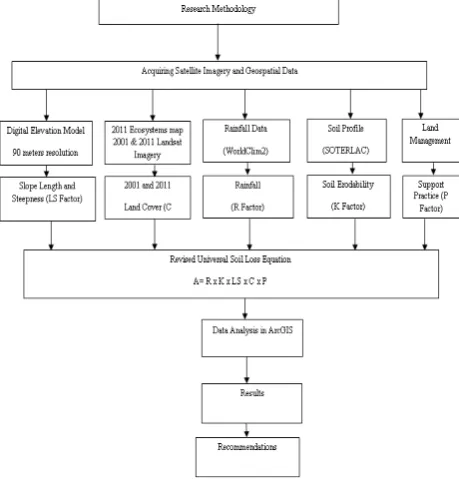
The main sources of data for this research were satellite imagery and data compilation of previous studies, observation and documentary information, geospatial data, LUCC and anthro-pogenic activities in the Rio Grande watershed. Figure 3 shows all the geospatial data that was used to derive the factors that were utilized in the RUSEL model. All the data sets were projected to the Universal Transverse Mercator (UTM) and the WGS 1984 datum. All data sets were then re-sampled to 90 meters.
Figure 2. Flow diagram depicts the preparation and analysis of geospatial data to identify susceptible areas to erosion and estimate soil erosion in the Rio Grande watershed.
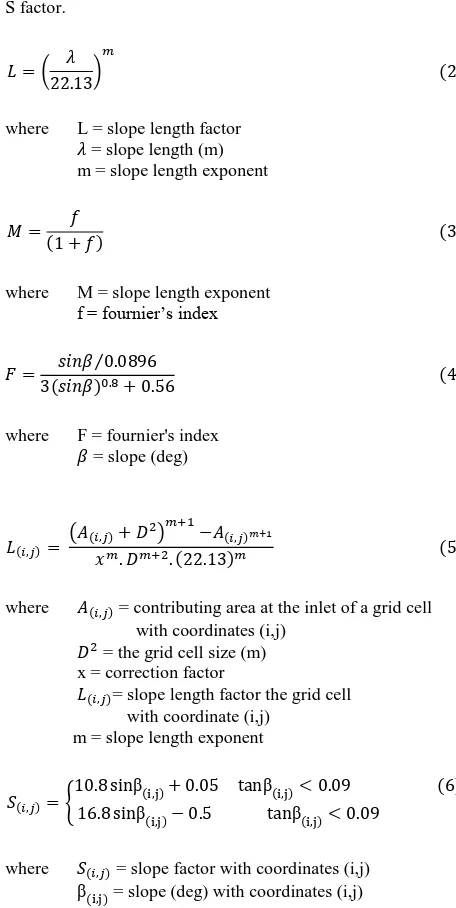
spatial analyst. Equation 2-4 (Foster et al. 1977) and equation 5 (Desmet and Govers, 1996) were used to calculate the L factor and equation 6 (McCool et al. 1987) was used to calculate the S factor.
where M = slope length exponent f = fournier’s index
, = slope length factor the grid cell with coordinate (i,j)
m = slope length exponent
� , = {
. sinβ , + . tanβ , < . . sinβ , − . tanβ , < .
where � , = slope factor with coordinates (i,j) β , = slope (deg) with coordinates (i,j)
L is the slope length factor which is the ratio of soil loss from the field slope length to soil loss from a 22.1 m length under the same conditions; S is the slope steepness factor which is the ratio of soil loss from the field slope gradient to soil loss from a 9% slope under the same conditions (Alkharabsheh et al. 2013).
The cover management factor (C factor) which is the ratio of soil loss from an area with specified cover and management to soil loss from an identical area in tilled continuous fallow (Alkharabsheh et al. 2013) was calculated from Landsat satellite imagery which were downloaded from (http://www. earthexplorer\.usgs.gov) (table 1).
Table 1. Landsat images used in the forest cover change analysis
The satellite imagery were atmospherically corrected and the normalized difference vegetation index (NDVI) was calculated. The NDVI was derived using equation 6 and the C factor was derived using equation 7 (Alexakis et al. 2013).
NDVI = NIR – RED / NIR + RED
where NDVI = normalize difference vegetation index NIR = near infrared band
RED = red band
= �� (− − ���� )
where C = cover management factor
NDVI = normalize difference vegetation index a & b = unitless parameters that determine the shape
of the curve relating to NDVI and C factor
According to Alexakis an a-value of 1 and a b-value of 2 seem to give reasonable results. For this study the value of b was the highest NDVI values for the respective satellite imagery, which give reasonable results (Table 2).
Satellite imagery for 2001 and 2011 were used to calculate forest cover using Claslite algorithms (Asner et al. 2009). The ecosystem maps for 2001 and 2011, which were acquired form (www.biodiversity.bz/), were used to classify the forest cover into the respective land uses. The land use cover maps for 2001 and 2011 were then overlaid with the C factor layers of 2001 and 2011 respectively and the mean C factor was calculated for each land use type (Table 2).
Table 2. Land Use and mean C factor for 2001 and 2011
The rainfall erosivity factor (R factor)is computed as a product of the total storm energy and the maximum 30-min intensity, summed over the storms occurring through the year (Thattai, 2003). Since rainfall data is limited in the study area, the monthly precipitation derived from a 1 km resolution global raster precipitation data set called WorldClim2 was used to calculate the R factor. Monthly precipitation data were summed
Land Use C factor 2001 C factor 2011
Lowland Broad- leaved wet forest
0.007 0.007
Lowland pine forest 0.008 .009
to produce annual rainfall estimates. The data set was then re-sampled to 90 meters resolution and equation 9 was used to calculate the R factor (Burke, 2006).
R = . + . ∗ P − . ∗ E (9)
where R = megajoule*mm per hectare P = precipitation in mm E = elevation in meters
The soil erodibility factor (K factor) which is the soil loss rate per erosion index unit for a specified soil as measured on a standard plot (22.1 m in length of uniform 9% slope in continuous clean tilled fallow) (Alkharabsheh et al. 2013), was obtained from the Soil and Terrain Database for Latin America and the Caribbean (http://www.isric.org/projects/soter-latin-america -and-caribbean -soterlac).
A value of 1 was used for the land management practices (P factor) which is the ratio of soil loss with a support practice such as contouring, strip cropping, or terracing to soil loss with straight row farming up and down the slope (Alkharabsheh et al. 2013). The value of 1 was used because very few farmers use support practices in the Rio Grande watershed.
In order to calculate the inherent erosion vulnerability of the landscape to erosion based on slope, soil erodibility, and annual precipitation equation 10 was used (Burke, 2006).
Vulnerability = R * K * S 0.6 (10)
where R = Rainfall-runoff erosivity factor K = Soil erodibility factor S = Slope (in degrees)
This model allowed the evaluation of the erosion vulnerable areas when forest cover is not include.
RESULTS AND DISCUSSION
Steep slopes and high rainfall conditions particularly in southern Belize predispose the soils to erosion in the absence of structured management. In addition, In the Toledo District, the milpa slash-and-burn agricultural system has evolved in response to local conditions and provides the Kekchi and Mopan Mayans of the region with most of their subsistence needs (Emch et al. 2005). The slash-and-burn agricultural system exposes the topsoil to rainfall which increases erosion in agricultural areas. In the Toledo district soils from agricultural lands are becoming degraded as a result of soil erosion. A study conducted by Saqui et.al found that since agricultural lands are infertile, farmers are moving to primary and broad leaf forest because they believe that fertile soils are found only in those areas. In the past the slash-and-burn agricultural system was sustainable because the period of fallow was long enough to allow the soil to rehabilitate but presently the follow periods are becoming shorter rendering slash-and-burn agricultural systems unsustainable.
In Toledo’s Rio Grande watershed the majority of agriculture and urban expansion occurs in Lowland broad-leaved wet forest (Fig. 3). Agricultural activities and urban expansion do not occur in submontane broad-leaved wet forest because this area have very steep slope and are under protection.
Figure 3. Rio Grande watershed land cover change in 2001 and 2011
In the Lowland broad-leaved wet forest area infertile soils and population growth are driving farmers in Naluum Ca, Crique Jute, San Pedro Columbia and San Miguel to plant in steep slopes. The use of poor agricultural management practices with little attempts of soil preservation in this areas are exacerbating the erosion problem. Planting is done up and down the hillsides, which result in rill erosion down the hill and during the inter-crop period the majority of the farmers do not cover the soil.
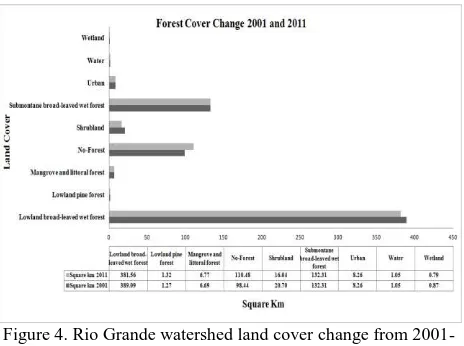
Figure 4. Rio Grande watershed land cover change from 2001- 2011
The forest cover change analysis conducted using Claslite algorithms show that from 2001 to 2011 there was a decrease of Lowland broad-leaved wet forest of 7.53 km sq, Shrubland of 4.66 km sq, and Wetland of 0.08 km sq (Fig 4). The results also show that there was an increase of No-forest of 12.04 km sq, Mangrove and Littoral forest of 0.08 km sq and Lowland pine forest of 0.05 km sq. Lowland broad-leaved wet forest is being converted to No-forest as a result of agriculture activities and urban expansion.
Figure 5. Rio Grande watershed soil erosion estimates for 2001 and 2011
In 2011 the erosion areas remaind in the same location but were larger. Aslo, in 2011 there was a new “erosion hot spot” which resulted from the land cover changed that occured from shrubland to no-forest (Fig. 5). The combined factors of steep slopes and clearing of forest cover indicate that the northern part of the watershed is more prone to suffer from erosion (Fig. 6).
Figure 6. Rio Grande watershed erosion vulnerability and land cover change from 2001- 2011
The erosion vulnerability map shows that the northern area, presents very high, high and medium erosion vulnerability. The central and southern areas presents low and very low erosion vunerability (Fig. 6). The very high erosion vulnerability areas found in the lower part of the watershed are because of steep slopes and high precipitation. The northern area is the highest section of the watershed; thus, conversion to an erosive land cover type should be avoided or, where converted, better management practices should be targeted (Burke, 2006).
The analysis also show that the average erosion from mangrove and littoral forest is higher for both years followed by no-forest and urban areas (Fig. 6). In 2011 there was an increase of average erosion from Mangrove and littoral forest, no-forest, urban, wetland, lowland pine forest and lowland broad-leaved wet forest and a decrease from submontane broad-leaved wet forest and shrubland.
Figure 7. Average erosion in land cover types in 2001 and 2011
The increase of average erosion in 2011 was due to a decrease in NDVI or a change in land cover. The slight decrease of erosion in 2011 was due to a increase in NDVI. Mangrove and littoral forest average erosion is higher than no-forest and urban areas because the presence of water in the area resulted in a lower NDVI, which resulted in a higher C factor for Mangrove and littoral forest (Table 2).
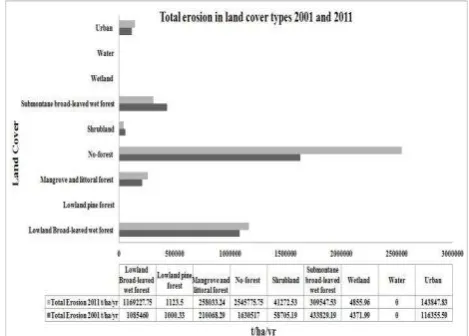
Figure 8. Total erosion in land cover types in 2001 and 2011
The land cover types that are contributing the most erosion are no-forest, lowland broad-leaved wet forest and submontane broad-leaved wet forest (Fig. 8). Although, the average erosion from urban and mangrove and littoral forest are high, the total erosion from these areas is small because of their small cover area. In 2001 there was an increase of total erosion from lowland broad-leaved wet forest which was as a result of land cover change to no-forest and a decrease in NDVI. The result also show that in the same year there was a decrease of total erosion from submontane broad-leaved wet forest which was as a result of an increase in NDVI. The increase of none forested areas in 2011, resulted in an increase of total erosion.
CONCLUSION
livelihoods of the communities that depend on its natural resources.
This research generated scientifically sound information which helps to understand the effects that LUCC and soil erosion in the Rio Grande watershed. The maps and information generated identify LUCC and erosion “hotspots” that will aid decision makers to plan actions for soil erosion prevention in a more effective manner. By knowing the land cover changes and erosion rates and vulnerable areas in terms of their spatio-temporal pattern it will be possible to work with the communities that are more impacted to mitigate the environmental degradation phenomenon. Therefore, this research provides information that will be used for the sustainable development of the study area.
REFERENCE
Alexakis, D. D., D. G. Hadjimitsis and A. Agapiou, 2013. Integrated use of remote sensing, GIS and precipitation data for the assessment of soil erosion rate in the catchment area of “Yialias” in Cyprus. Atmospheric Research 131(0): 108-124.
Alkharabsheh, M. M., T. K. Alexandridis, G. Bilas, N. Misopolinos and N. Silleos, 2013. Impact of Land Cover Change on Soil Erosion Hazard in Northern Jordan Using Remote Sensing and GIS. Procedia Environmental Sciences 19(0): 912-921.
An, S., F. Zheng, F. Zhang, S. Van Pelt, U. Hamer and F. Makeschin, 2008. Soil quality degradation processes along a deforestation chronosequence in the Ziwuling area, China. CATENA 75(3): 248-256.
Asner, G. P., D. E. Knapp, A. Balaji and G. Páez-Acosta, 2009. Automated mapping of tropical deforestation and forest degradation: CLASlite. Journal of Applied Remote Sensing 3(1): 033543.
Burke, L., Z. Sugg, 2006. Hydrological Modeling of Watersheds Discharging Adjacent to the Mesoamerican Reef. World Resource Institute.
Desmet, P. J. J. and G. Govers, 1996. A GIS procedure for automatically calculating the USLE LS factor on topographically complex landscape units. Journal of Soil and Water Conservation 51(5).
Emch, M., J. W. Quinn, M. Peterson and M. Alexander, 2005. Forest Cover Change in the Toledo District, Belize from 1975 to 1999: A Remote Sensing Approach*. The Professional Geographer 57(2): 256-267.
Farley, K. A., L. Ojeda-Revah, E. E. Atkinson and B. R. Eaton-González, 2012. Changes in land use, land tenure, and landscape fragmentation in the Tijuana River Watershed following reform of the ejido sector. Land Use Policy 29(1): 187-197.
Farrow, A. and M. Winograd, 2001. Land use modelling at the regional scale: an input to rural sustainability indicators for Central America. Agriculture, Ecosystems & Environment 85(1–3): 249-268.
Foster, G. R., L. D. Meyer and C. A. Onstand, 1977. A runoff erosivity factor and variable slope lenght exponents for soil
loss estimates American Society of Agricultural and Biological Engineers 20.
Halcrow Group Limited, Decision Economics and Penny Hope Ross and The Belize National Assessment Team, 2010. Government of Belize and the Caribbean Development Bank, Halcrow Group Limited 1: 326.
Lapointe, B. E., R. Langton, B. J. Bedford, A. C. Potts, O. Day and C. Hu, 2010. Land-based nutrient enrichment of the Buccoo Reef Complex and fringing coral reefs of Tobago, West Indies. Marine Pollution Bulletin 60(3): 334-343.
McCool, D. K., L. C. Brown, G. R. Foster, C. K. Mutchler and L. D. Meyer, 1987. Revised slope steepness factor for the universal soilloss equation. American Society of Agricultural and Biological Engineers 30.
McLoughlin, L., 2010 Saving paradise in the Maya Mountains of Belize.
Mendoza, M. E., E. L. Granados, D. Geneletti, D. R. Pérez-Salicrup and V. Salinas, 2011. Analysing land cover and land use change processes at watershed level: A multitemporal study in the Lake Cuitzeo Watershed, Mexico (1975–2003). Applied Geography 31(1): 237-250.
Mutekanga, F. P., S. M. Visser and L. Stroosnijder, 2010. A tool for rapid assessment of erosion risk to support decision-making and policy development at the Ngenge watershed in Uganda. Geoderma 160(2): 165-174.
Portillo-Quintero, C. A., A. M. Sanchez, C. A. Valbuena, Y. Y. Gonzalez and J. T. Larreal, 2012. Forest cover and deforestation patterns in the Northern Andes (Lake Maracaibo Basin): A synoptic assessment using MODIS and Landsat imagery. Applied Geography 35(1–2): 152-163.
Rawat, J. S., V. Biswas and M. Kumar, 2013. Changes in land use/cover using geospatial techniques: A case study of Ramnagar town area, district Nainital, Uttarakhand, India. The Egyptian Journal of Remote Sensing and Space Science 16(1): 111-117.
Ray, D. K., R. M. Welch, R. O. Lawton and U. S. Nair, 2006. Dry season clouds and rainfall in northern Central America: Implications for the Mesoamerican Biological Corridor. Global and Planetary Change 54(1–2): 150-162.
Saqui, J., P. Saqui, and S. Chicas, 2011. Identification of Deforestation and Forest Degradation drivers in Belize.
Thattai, D., B. Kierfve and W.D. Heyman, 2003. Hydrometer and Variability of Water Discharge and Sediment Load in the Inner Gulf of Honduras, Western Caribbean. Jouranl of Hydrometeorology.
Zeledon, E. B. and N. M. Kelly, 2009. Understanding large-scale deforestation in southern Jinotega, Nicaragua from 1978 to 1999 through the examination of changes in land use and land cover. Journal of Environmental Management 90(9): 2866-2872.