B. Huang a, *, Y. Zhang a , Y. Wang a , Q. Liu b
a School of Geoscience, China University of Petroleum,QingDao 266580,China[email protected] b North China Sea Branch of State Oceanic Administration,QingDao 266061,China[email protected]
KEY WORDS: Warning Water Level, Oceanographic Station, Storm Surge, ArcGIS Engine
ABSTRACT:
The amount and location of oceanographic stations vary in different time and the observation information of the same station shows temporality. Hence, ocean observation information has strong spatiotemporal characteristics. This article firstly introduces storage strategy and representation method of spatiotemporal information on tidal level. Then the prototype system was built with the ability of storing, updating, analyzing, and early warning of tidal level in Shandong Peninsula of China. The system achieves the inquiry and visualization of realtime and historical information of oceanographic stations, which provides technical support for oceanographers and decisionmakers.
* Corresponding author
1. INTRODUCTION
The warning tidal level refers to the established value of tidal level when tidal risks or disasters may occur in protection zones along the coastal area and a state of alert, emergency or disaster relief are declared. The warning tidal level is an important technical indicator of coastal flood prevention work, and is the reference of the marine forecasting department issuing storm surge forecast and alert. Similar to water level warning of the rivers and lakes, it provides an important basis for the disaster mitigation commanding and decisionmaking of government at all levels in coastal areas.
In order to ensure the accuracy and rationality of the current warning tidal level, the State Oceanic Administration carried out the regulation named “the Check and Management Method on the Warning Tidal Level”, in which provincial oceanic departments must perform the assessment of the warning tidal level at regular intervals, and the value should be redetermined if the current value does not suit for disaster mitigation. The warning tidal level should be checked and ratified every 5 years in principle.
In order to carry out examining the warning tidal level, North China Sea Branch of State Oceanic has collected and investigated a large amount of data including hydrometeor, moisture proof and social economy. Traditional data management can't adapt to the new features of current tidal level information such as the temporal features, realtime update. In order to improve the capacity of disaster prediction and prevention, it is needed to design and develop the coastal warning tidal level information system based on GIS technology. Therefore, we develop a platform for data management and seamless information integration. As a result, we can manage and display the tidal level information of different time.
2. RELATED WORK
The term Digital Ocean emerged after the Digital Earth
program was proposed by Gore in 1998, and many experts do some research about digital ocean(Goodchild, 2008; Guo et al., 2009; Hou, 1999). With the development of the digital ocean, there are many research focuses on the visualization and analysis about the marine data based on the GIS(Gold,1996; Roberts et al.,2010; Zhang et al.,2011), and also there are decision system based on the integration between GIS and hydrological models(Leung, et al.,2005; Huang, et al.,2010). As one of the nonengineering integrated systems to prevent tidal disasters, the integration of GIS and storm surge numerical model provides the brandnew operation environment for accurate forecast of storm surge, and spatial analysis and visualization of simulation results. Some developed countries have taken research on that topic and already had many remarkable achievements. At the early 1990s, the experts set up SLOSH model in America and began to utilize GIS technologies to prepare the data of water depth and ground elevation for storm surge numerical model. With decades of improvement, the functional storm surge numerical forecasting system with the support of GIS has been set up successfully. At the same time, storm surge risk analysis in specific coastal area has been carried out. In China, the research starts late on integrated system between GIS and storm surge numerical forecasting model. Chinese Academy of Sciences cooperated with State Oceanic Administration during the eighth “fiveyear plan”. By using ArcInfo and ArcView as platform and taking the No. 9216 storm surge in Tianjin as an example, the researchers made the surge forecasting undersea elevation and realized spatial inquiry and statistical analysis of numerical results. That is the first storm surge disaster estimating system combined with GIS in China. In recent years, China enhances survey and earlywarning to storm surge disaster(Liu, X. and Wu,Q., 2008).
Figure 1. The architecture of the system
3. METHODOLOGY
3.1 Architecture Design
The system is designed on the basis of “hierarchical service model”. According to the differences of representation information type, application range and usage level, the data and application source of the platform is divided into several layers. The architecture design is shown as Figure 1.
(1)Communication network platform
The communication network platform includes the broadband multimedia network and the hardware facilities, for
The data sharing platform is mainly for storage and management of data and model. The databases include geodatabase, industrial basic geographic database, industrial geographic database and business database.
(4)Core application platform
The core application platform is the core of the system. It mainly realizes the primary function modules, such as warning tidal level information management, observation information management, numerical simulation production management, defense capability inquiry, historical storm surge process inquiry, data management, and so forth.
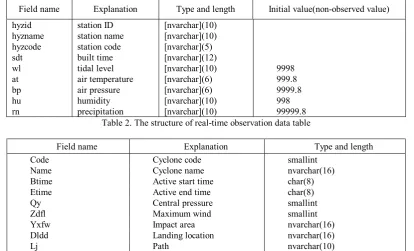
3.2 Spatiotemporal Data Storage Structure (1) Observation station
Observation stations may be classified as permanent observation stations and temporary observation stations. On the one hand, the permanent ones may change their amount and locations; on the other hand, some temporary stations might be added due to the need of the observation business requirements. Therefore, the location of the observation stations has temporal characteristics. We use a point map layer to store all observation stations and use attribute fields to separate stations of different type and built time, which is designed as Table 1.
Field
name Explanation Type and length Initial value
hyzid stationID [nvarchar](10)
hyzname stationname [nvarchar](10)
hyzcode stationcode [nvarchar](5)
sdt built time [nvarchar](12)
type stationtype Int 0
Table 1. Spatial attribute table of observation station
(2)Observation business data
The observation business data consists of the realtime observation data and the historical data. Each station will return one record of the current tidal level, which can be designed as Table 2. The table only stores the latest observation data records. It means that every new record must be stored into the historical table correspondingly in order to meet the demands of inquiry and representation of the historical data. Besides, for the sake of improving the efficiency of query by hour, when inserting into the historical
Shangdong Province(C/S Version) Warning water level information system in Shangdong Province(B/S Version)
Industry base
software Microsoft SQL Server
tropical cyclones such as code, name and active time. The analysis functions.
Field name Explanation Type and length Initial value(nonobserved value)
hyzid station ID [nvarchar](10)
hyzname station name [nvarchar](10)
hyzcode station code [nvarchar](5)
sdt built time [nvarchar](12)
wl tidal level [nvarchar](10) 9998
at air temperature [nvarchar](6) 999.8
bp air pressure [nvarchar](6) 9999.8
hu humidity [nvarchar](10) 998
rn precipitation [nvarchar](10) 99999.8
Table 2. The structure of realtime observation data table
Field name Explanation Type and length
Code Cyclone code smallint
Name Cyclone name nvarchar(16)
Btime Active start time char(8)
Etime Active end time char(8)
Qy Central pressure smallint
Zdfl Maximum wind smallint
Yxfw Impact area nvarchar(16)
Dldd Landing location nvarchar(16)
Lj Path nvarchar(10)
Table 3. The structure of tropical cyclone data
3.3 Analysis of Storage Method of Observation Data
The storage of historical data needs to be considered as system updates the realtime data. There are two ways to implement it: programming transfer and database trigger. The detailed analysis is as follows.
(1) Programming transfer: at regular intervals, traverse the related data tables to check if the data is updated. If updated, use ADO.Net to implement data update.
(2) Database trigger: set triggers between tables, when one table is updated, the other table will be updated automatically.
Considering the functional demand of the system, comparison between the two ways is shown in Table 4. There are observation data of about 20 stations in the different real
time databases and we need to access these realtime data and transfer into GIS database. In convenient for hourly query and approximate instead of historical observation data, we adopt the first method to update realtime observation data.
4. EXPERIMENTS
4.1 Update Process of the Observation Information
In order to ensure the data integrity and access speed, the system reads the current observation information from the observation station database at the fixed interval. If new data are written, it will be stored into the realtime data table in the database of this system. At the same time, it will be added into the historical table. To inquire and analyze the historical data on hour, we update data to historical hour table near the hour. The process is as figure 2.
Realizing method Advantage Disadvantage
By programming Programming means we can query the data
by specific conditions, which is more flexible for different application demand.
It will be inefficiency when there are large amount of records in source database
By trigger Dealing the data with event, updating will
be conducted automatically when change happens
Crossserver trigger is complex to implement; it is not easy to check the updated record to trigger event conditionally
Figure 2. The update process of the observation information
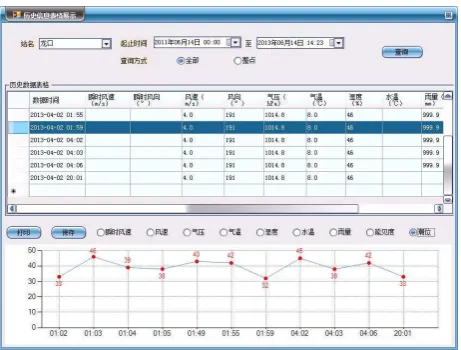
4.2 Representation of the Tidal Level Data
4.2.1 The representation of the observation station’s information
The representation of the observation station’s information includes two ways: map representation (figure 3) and table representation (figure 4). The way based on map needs to build join between spatial data (marine observation map layer) and business data (the realtime data table), so that it can show information using map labeling by selecting fields. The implementation of fields labeling function relies on ILabelEngineLayerPropertiesinterface provided by ArcGIS, by assigning the labeling expression to Expressionattribute. The visualization of wind field is implemented through the wind feather symbol, by classifying and rendering the layer according to wind speed and rotating the symbols according to wind direction value.
Figure 4. The representation of observation station’s information based on table
4.2.2 The representation of the earlywarning information of coast segments
It mainly includes map rendering and table inquiry. Tables which show single record more explicitly are need, as well as map representation which show records directly and lively are needed. The coastline is divided into 27 segments, each of which is related to the nearest ocean stations. Because there is only spatial data in coast attribute table of the segment layer, in order to color the coast line with realtime tidal level data, we need to read the realtime data from the corresponding stations, and judge the tidal level rank of this coast segment according to the present warning tidal level, and at last render it with relevant color. The process needs the joint query of the real time observation table and the present warning tidal level table. The relationship between the two tables above is the "ocean station ID" column. The judging of the warning rank need to be realized in DBMS by SQL statements and 0 means safe tidal level, 1 means blue tidal level, 2 means yellow tidal level, 3 means orange tidal level, 4 means red tidal level.
4.3 Representation of the Storm Surge Information
The storm surge management module includes the searching of tropical cyclone information and the simulating of typhoon track. It has made dynamic visualization of typhoon information. First of all, the tropical cyclone data table could be read from database. Basic information such as typhoon serial number, name, scope of influence and beginning and ending time are stored in tropical cyclone data table. The name and year of typhoon can be loaded into query form by using year and serial number as filtering condition. Then, we can use it to generate dynamically typhoon track on a layer. Typhoon track information is stored in typhoon data table. Each record is the typhoon information at every integral point time such as location, central pressure, maximum wind speed, the radius of moderate wind and whole wind. When the user select Typhoon number, the system will query records from Typhoon data table according the number firstly, then each record is shown as a point elements in the map, and the Typhoon path is drawn between two points.
5.1 Conclusions
In this paper, we propose storage structure of spatiotemporal information of observation station, and develop the Warning Tidal Level Information System for Shandong Peninsula coast based on ArcGIS Engine10.1, .Net platform and MS SQL Server2008 DBMS. The main functions of the system include the update, storage, inquiry, analysis, visualization of the real time and historical data of observation station, by which we can organize and manage the attributive, spatial and temporal semantic of the spatialtemporal oceanic data effectively, and realize rebuilding historical events, tracking variation and predicting the future.
5.2 Future Work
The storage and visualization technique of wind field, current field information, which has spatiotemporal characteristics, should be explored in the future. The traditional way by image cannot realize adaptive symbol density along with map zoom and it needs considerable memory space; the new B/S structure system need to be developed for taking the advantages of convenient access and update.
REFERENCES
Gold, C.M., 1996. An Eventdriven Approach to Spatio Temporal Mapping. Geomatica, 50, pp.415424.
Goodchild, M.F., 2008. The use cases of Digital Earth. International Journal of Digital Earth,1 (1), 3142.
Guo, H.D., Fan, X.T., and Wang, C.L., 2009. A digital earth prototype system: DEPS/CAS. International Journal of Digital Earth, 2 (1), pp.315.
Hou, W.F., 1999. Tentative idea for development of “Digital Ocean’’. Aviso of Ocean, 18 (6),pp:110.
Huang, B., Siling, P., Chen, Y., Chen, K., & Xu, B. , 2010. Decision supporting system of Jinan urban flood control.
http://ieeexplore.ieee.org/stamp/stamp.jsp?arnumber=5568052
Leung,Y., Lee,Y., Lam, K.C., LIn, K. and Zeng,F., 2005. An environmental decisionsupport system for the management of water pollution in a tidal river network, International Journal of Geographical Information Science, 19(4), pp:483500.
Liu, X., Wu,Q.,2008. Analysis and Forecast Warning System of Storm Surge in Yantai. China Water Transport, 8(11),pp:225226.
Roberts, J., Best, B., Dunn, D., Trem, E., Halpin, P., 2010. Marine Geospatial Ecology Tools: An integrated framework for ecological geoprocessing with ArcGIS, Python, R, MATLAB, and C++. Environmental Modelling & Software 25, pp:1197 1207.