3D CAPTURING PERFORMANCES OF LOW-COST RANGE SENSORS
FOR MASS-MARKET APPLICATIONS
G. Guidi, S. Gonizzi, L. Micoli
Dept. of Mechanical Engineering, Politecnico di Milano, Via La Masa, 1 - 20156 Milan, Italy (gabriele.guidi, sara.gonizzi, laura.micoli)@polimi.it
Commission V, WG V/1
KEY WORDS: 3D Metrology; Low-cost 3D sensors; Resolution; Systematic error; Random error.
ABSTRACT:
Since the advent of the first Kinect as motion controller device for the Microsoft XBOX platform (November 2010), several similar active and low-cost range sensing devices have been introduced on the mass-market for several purposes, including gesture based interfaces, 3D multimedia interaction, robot navigation, finger tracking, 3D body scanning for garment design and proximity sensors for automotive. However, given their capability to generate a real time stream of range images, these has been used in some projects also as general purpose range devices, with performances that for some applications might be satisfying. This paper shows the working principle of the various devices, analyzing them in terms of systematic errors and random errors for exploring the applicability of them in standard 3D capturing problems. Five actual devices have been tested featuring three different technologies: i) Kinect V1 by Microsoft, Structure Sensor by Occipital, and Xtion PRO by ASUS, all based on different implementations of the Primesense sensor; ii) F200 by Intel/Creative, implementing the Realsense pattern projection technology; Kinect V2 by Microsoft, equipped with the Canesta TOF Camera. A critical analysis of the results tries first of all to compare them, and secondarily to focus the range of applications for which such devices could actually work as a viable solution.
1. INTRODUCTION
1.1 Gesture tracking
The low-cost 3D sensors mentioned in this paper are simple 3D devices for managing the so called “gesture based” interfaces. Although the study and implementation of such interfaces date back to 1980 when the “Put-That-There” system was developed (Bolt, 1980), such topic has been more a research field rather than a real industrial interest for general purpose applications, mainly due to its relatively low social acceptance and to the high cost of the associated devices (Rico et al., 2011). The real boost to this approach was represented by the need to manage 3D interactions in the video-gaming industry, that from the early 2000 started to develop human-machine interfaces alternative to keyboard-driven cursors.
The earliest gesture gaming device to go mass-market was probably the Power Glove that Nintendo introduced in 1989 for their gaming controllers. It was a device based on ultrasound-based position detection and derived by the NASA funded Dataglove project where the position was determined by magnetic tracking (Fisher, 1987). Although fully 3D and well ahead of it’s time, the device involved a physical contact with the user that needed to wear it. In 1999 Richard Marks conceived a dedicated webcam embedding some gesture recognition based on 2D images whose patent was sold to Sony and became later the Eyetoy device for the Playstation platform (Marks, 2011). It was not yet a 3D device but it worked in complete absence of contact. In 2006 Nintendo added another 3D motion sensing controller to their gaming consoles, which they called the Wii. The camera embedded in the Wii controller features an integrated multiobject tracking (MOT) engine, which provides resolution, high-speed tracking of up to four simultaneous IR light sources. The camera provides location data with a resolution of 1,024 × 768 pixels, more than 4 bits of dot size or light intensity, 100 Hz refresh rate, and 45 degree horizontal field of view. The integrated hardware object tracking minimizes the data
transmitted over the wireless connection and greatly simplifies the implementation of camera-based tracking applications. The sensor is completed by a 3-axis linear accelerometer that provides the Wii with remote’s motion-sensing capability (Lee, 2008). The philosophy here is to use two arrays of infrared LEDs, attached above and below the TV screen used as game monitor, as position references. The Wii device is handheld and its logic is to track in real time the fixed LEDs positions with the IR camera embedded in the device, estimating the 6DOF of the player’s hand holding the device and the corresponding acceleration along x y and z. This approach, enriched with gyroscopes and magnetometers, led later to a variety of intelligent devices for sport simulation like golf clubs, tennis rackets, baseball bats etc., and to wearable technologies for delivering fitness related services (Lightman, 2016). In addition this device represented a major step ahead in the 3D user-machine interaction, and its low cost (approx. 40$), determined a significant boom for the Manufacturer, with 20M$ revenues in the first year (Nintendo, 2008).
The extremely good results of Wii generated a worried reaction of the competitors that started to think to alternative ways for measuring position and orientation of the player harms, hands and legs, without any device hold by the end-user. This led Microsoft, at the time involved in the lunch of the XBOX360 platform, to start the Project Natal whose purpose was to develop a device looking to the user (like Sony’s Eyetoy), but with a full 3D vision of the scene, on the basis of which generate gesture-based 3D input for a gaming console. This produced in 2010 the first device, named Kinect, whose 3D sensing technology was developed by Primesense, an Israeli company based in Tel Aviv. The 3D sensing, based on triangulation, was named "Light coding technology". This approach, in principle very similar to that employed by the white or blue light pattern projection devices, was implemented in efficient way, packed in a single chip, coupled with a standard color camera and a microphone, thus allowing the production of a small and inexpensive multimodal input unit (less than 200$). The key element of such device was to get a 3D input from the user’s movements, being The International Archives of the Photogrammetry, Remote Sensing and Spatial Information Sciences, Volume XLI-B5, 2016
capable to extract from the body posture of the player a simplified skeleton whose nodes relative positions could trigger specific actions of a virtual environment like a 3D videogame.
1.2 Alternative uses of low-cost 3D devices
As a matter of facts such devices were conceived as steady units made for capturing the 6DOF of a moving object in front of them, like an arm or an entire human body, “distilling” from the thousands of 3D points contained in a real-time stream of 3D images, just position and orientation of a tracked object (6 parameters), or few sets of 6 parameters mutually constrained. The first Kinect was a device for a closed and proprietary environment such as the Microsoft XBOX360, whose data could not be used for general purpose issues. This is why after its launch in 2010 several hackers started to reverse engineer the system arriving to practical results only few days later. This allowed to develop a set of projects aiming at using the 3D data originated by such low-cost sensors in a way different from their original purpose.
The possibility to access the raw 3D data opened the possibility to use the unit in a different fashion: not anymore a steady unit with a moving object in front of it, but a moving camera framing a steady scenario from different points of view, collecting al the geometric information needed for modeling it in 3D. So, something very similar to a high-cost handheld 3D scanner, at a fraction of its cost.
The first project exploring this possibility was KinectFusion, whose purpose was investigating techniques to track the 6DOF position of handheld Kinect, as it is moved through space, aligning accordingly the corresponding 3D data for performing 3D surface reconstructions (Newcombe et al., 2011). This approach has been then implemented also in two different commercial packages: ReconstructMe (http://reconstructme.net)
and Scenect by FARO (http://www.faro.com/scenect/scenect).
2. CURRENT LOW-COST 3D SENSORS
This latter type of applications has been favored also by the introduction of a variety of 3D sensor of the same category, exploiting two different working principles.
2.1 Triangulation based devices
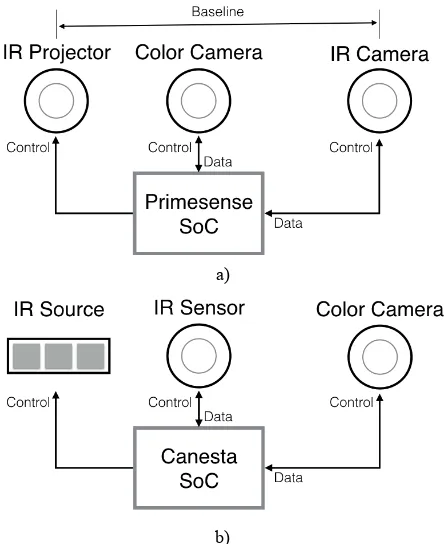
The Primesense device, as anticipated in section 1.1, is based on triangulation. It involves the projection on the scene of a speckle pattern of near-IR laser light constantly projected on the scene. This pattern is captured by the infrared camera and correlated against a reference pattern obtained by capturing a plane at a known distance from the sensor. When the same pattern is projected on a surface whose distance to the sensor is smaller or larger than that of a reference plane, the position of each dot will be affected by a parallax shift in the direction of the baseline between the laser projector and the perspective center of the infrared camera. The measurement of such parallaxes allows then to estimate distances for each image pixel (Maizels et al., 2010). For this reason, the system schematically shown in Figure 1a, is made by an IR projector, a 640x480 CMOS IR camera dedicated to range sensing, a second 640x480 CMOS color camera for capturing the color image associated to the depth map. All these are controlled by a System-on-a-Chip (SoC) that exist in two versions indicated as Carmine 1.08, for long range sensing (0.8m-3.5m), and Carmine 1.09, for short range sensing (0.35m-1.4m). In addition to the original Kinect version 1, a second similar device was produced by ASUS (Xtion Pro live) and, after the acquisition of Primesense by Apple in 2014, the Occipital Structure Sensor. This latter device has been specifically
designed to be coupled to an IPad, for transforming it in a cheap and user-friendly handheld 3D digitizer. The same technology has been recently embedded in the Astra Pro 3D, a device produced by the Chinese company ORBBEC.
a)
b)
Figure 1. Block diagram of the two technologies employed in the analysed sensors: a) Primesense, based on triangulation; b) Canesta, based on Time of Flight.
Intel has instead developed his own triangulation-based range sensing technology called “Realsense”, very similar to the Primesense. It has been implemented in stand alone units by Creative, and in some Lenovo laptops. Although Intel - similarly to Primesense - is developing different versions of the device for different ranges, the actual device tested in this paper was the SR300, equipped of a 640x480 depth camera, and a Full-HD color camera (1920x1080), with operating range 200-1500 mm.
2.2 TOF based devices
In addition to these triangulation-based device, a technology competing with Primesense have been introduced in the last few years. For the updated version of its Kinect device, Microsoft developed a novel 3D sensor based on a flash camera that determine the distance to objects by measuring the round trip travel time of an amplitude-modulated light from the source to the target and back to the camera at each pixel. The system, originally patented by Canesta (Payne et al., 2014), involves the modulation of an IR light source with a square wave. The time taken from the light for reaching each pixel of the flash camera is evaluated indirectly by detecting the phase shift between the modulating square wave and the signal received by each pixel. The receiving unit is made by a 512 × 424 depth image sensor. Each 10 µm×10 µm pixel incorporates a TOF detector that operates using the Quantum Efficiency Modulation (QEM). This specific technique involves the use of two different modulating frequencies (80MHz and 100 MHz) for solving possible range ambiguities (Bamji et al., 2015; Sell and O’Connor, 2014). The whole Kinect2 2D/3D imaging system is schematically represented in Figure 1b.
3. BACKGROUND
A metrological characterization of this type of sensors have been proposed by different authors in the last few years, making evident the high variability of the 3D results, and sometimes also of the excessive variability of the related characterization. Some researcher attempted for example to define the optimal operating distance for Primesense-based Kinect obtaining 1000-3000 mm as the range when with best overall performances operating with the OpenKinect framework (Khoshelham and Elberink, 2012), 800-1500 mm operating with the SDK (Alnowami et al., 2012) and 700-2000 mm operating with the OpenNI framework (Molnár et al., 2012).
A comparison between two Primesense-based devices as the first Kinect and the Asus Xtion presented similar result (Gonzalez-Jorge et al., 2013). According to this paper both exhibited negligible variations acquiring the same test object from different angles, showing instead very large accuracy changes from 5mm to 15mm, and from 5mm to 25mm at a sensor-to-target distance of 1m and 2m respectively. In addition, this analysis gave a precision data ranging from 1mm to 6mm for 1m range and from 4mm to 14mm for 2m range. Probably the high variability in the latter results is also due to the small size of the calibrated object with the respect of the limited spatial resolution of the analyzed devices, and in general to the relatively limited number of samples involved in this type of analysis, that make them more prone to high variability of the related characterization results.
3.1 Spatial and temporal error
In general noise in a depth image is either Spatial – i.e. observable within a single frame - or Temporal – i.e. observable across multiple consecutive frames - (Mallick et al., 2014). Even if both make sense when characterizing a 3D device, in the practical application a spatial characterization allows to obtain more statistically significant results even with just one isolated 3D image. This is the approach we have followed for obtaining some metrological parameters in function of the operating range, that could be practically usable for estimating accuracy and precision of each analysed device.
Provided that one 3D frame is acquired in a fraction of a second, focusing our attention on the spatial error allowed also to neglect the effects of temperature in time, that have been proved to influence the performances of this range of devices over a time-span of several tens of minutes (DiFilippo and Jouaneh, 2015). The aim of the performed tests is therefore more on the relative differences between the various points belonging to the same range image rather then the absolute deviation between such coordinates and their true values.
3.2 Systematic and random error
According to the International Vocabulary of Metrology (Joint Committee For Guides In Metrology (JCGM), 2008), the measurement uncertainty of each measurement equipment or device represents the cumulative effect of the systematic errors – associated to the concept of accuracy –, that once modelled can be eliminated through a proper calibration, and unavoidable random errors – associated with the concept of precision –, dependant by unpredictable causes like the electronic noise, that can be only statistically characterized for making the end-user aware of the measurement system intrinsic limitations. Such quantity can be evaluated by 3D digitizing a certified object, estimating the deviation of each measured value from the theoretical one and calculating the standard deviation of. Such value represents an estimation of the global measurement uncertainty in that operating conditions.
4. MATERIAL AND METHODS
4.1 Devices
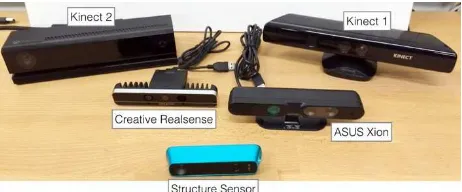
Five actual devices have been tested featuring three different technologies: i) Kinect V1 by Microsoft, Structure Sensor by Occipital, and Xtion PRO by ASUS, all based on different implementations of the Primesense sensor; ii) F200 by Intel/Creative, implementing the Realsense pattern projection technology; Kinect V2 by Microsoft, equipped with the Canesta TOF Camera.
4.2 Control software
The software used for controlling the devices has been the following: i) Skanect (http://skanect.occipital.com/) for all Primesense-based devices (i.e. Kinect1, ASUS Xtion and Structure Sensor); ii) KScan3D (http://www.kscan3d.com/) for the Kinect2; iii) Camera Explorer ( https://software.intel.com/en- us/blogs/2015/03/19/realsense-sdk-and-camera-setup-on-windows-10) for the Realsense F200.
While Skanect has been used on both Windows and Mac platforms using indifferently USB 2 or 3, the other two packages were just for use on a Windows 8 (or higher) systems, connected to the sensor through a USB3.
Figure 2. Devices characterized during the tests described in this paper.
4.3 3D processing software
All the raw 3D data has been exported as mesh generated on the acquired points and saved in Wavefront .obj format. When not possible (i.e. for the Kinect2 system), the data have been exported as ASCII file of 3D coordinates.
When the mesh was not natively available from the sensor, the unstructured cloud has been triangulated with the “IMAlign” module of Innovmetric Polyworks, avoiding any smoothing during the mesh generation.
All the other 3D processing actions have been conducted with the open-surce packages Meshlab and Cloud Compare, and with the commercial package Innovmetric IMInspect.
Finally, additional statistical analysis has been made on MATLAB with custom scripts developed within this project.
4.4 Test object
The main test object is the reference plane, that was made with a rectangular piece of float glass with a thickness of 11mm. The dimensions of the rectangle are 700 mm × 528 mm, appropriate for covering a significant part of the framed area by each of the sensors under test in the different working conditions. The reason behind using the glass is because it is very low cost and the surface is very smooth with small deviations from the theoretical plane. The float glass manufacturing process allows to obtain a planar target with a peak deviation from the theoretical plane in the order of few micrometers. Geometrically, this is suitable for testing the devices under observation, characterized by The International Archives of the Photogrammetry, Remote Sensing and Spatial Information Sciences, Volume XLI-B5, 2016
measurement uncertainties in the range of millimeters. This material is obviously not usable “as is” due to its transparency, not compliant with an active range sensing device made for working with a diffusive reflecting surface. This problem was resolved by painting the surface matt white, using the painting process employed in the car industry, that ensure a uniform distribution of paint not distorting the geometry of the plane. With this solution the final surface of the painted side has almost the same surface qualities that of the glass with nicely diffusive reflecting surface (Guidi et al., 2010).
Tests with reference planes at different operating distances have been made for extracting two crucial parameters: the systematic error and the random error (Guidi, 2013).
4.5 Systematic and random error estimation method
The method here employed is based on simple considerations considering the 3D digitizer as a “black box” system whose behavior influence the 3D cloud differently at different spatial frequencies. In particular, we know that the random error is largely due to the thermal noise of the electronic stage capturing the IR images, and by the laser speckle originated by the material response to coherent light. All these effects are superimposed on the deterministic content of the probing pattern, whose image is used for estimating the parallaxes in the different points of the frame. In this paper we assume to model the global random contribution of each range image as Additive White Gaussian Noise (AWGN), similarly to the thermal noise affecting CCD and CMOS sensors. The fact that this contribution can be considered additive with good approximation is confirmed by the literature (Hirakawa and Parks, 2006). This means assuming to consider three separate contributions for each depth sample collected by the sensor: i) the actual measured value; ii) the random error; iii) the systematic error. The sum of the latter two define the spatial measurement uncertainty.
Actually all these contributions are delivered simultaneously by the sensor, and the purpose of the technique here proposed is to discriminate them with low-cost equipment easily replicable in any small laboratory. In Figure 3, representing the color-coded deviation of each z value from the fitting plane associated with a set of points all nominally belonging to the same plane, this superposition is made evident.
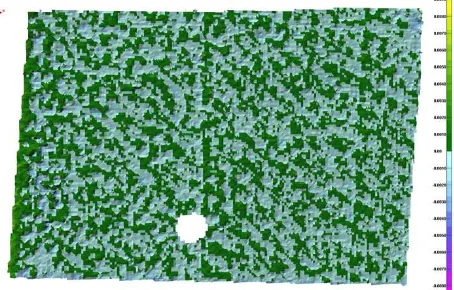
Figure 3. Color-coded deviation from the best-fitting plane originated by a range map acquired with the ASUS Xtion device while capturing the reference plane located at 650mm by the sensor. The color scale ranges from -12mm (pink) to +12mm (yellow).
The “grainy” appearance of the mesh represented in Figure 3 indicates the presence of a random error component, that typically is associated to high spatial frequencies, while the evident green spot in the center (positive errors), with the bluish
area in the peripheral area of the image (negative errors), show a systematic distortion of the measured values.
Thanks to the strong difference between the two components in terms of spatial frequency, we applied a low-pass filtering to the cloud, with a set of parameters such to leave only the low-frequencies associated to the systematic errors.
The spatial filtering was achieved with the λ-µ smoothing algorithm (Taubin, 1995), implemented in Meshlab, using λ=1, µ=-0.53 and 50 iterations. This parametrization allowed to filter out all the high frequency components that we associate to the random errors. The output of this step, shown in figure 4, represents a good approximation of the systematic error affecting the range map shown in Figure 3.
Figure 4. Color-coded deviation from the best-fitting plane of the same same map shown in Fig. 3, after the application of a low-pass filter leaving the systematic 3D distortion only. The color map is the same of Fig. 3.
The last step for estimating the random component of the range measurement error is to compare the raw 3D point cloud shown in Figure 3, with its smoothed version shown in Figure 4. Such deviation, as visually confirmed by its color coded representation in Figure 5, is far more uniformly distributed along the whole image area.
Figure 5. Color-coded deviation of the raw range map from the filtered one. The color map is the same of Fig. 3. The error span is clearly reduced and the error appears more randomly distributed over the plane.
In conclusion, for each 3D acquisition of the reference plane, we can estimate the standard deviation of each acquired point from the best-fitting plane. This represents an estimation of the global spatial uncertainty (σu). The 3D same cloud is then low-pass filtered and meshed. The standard deviation between the raw 3D data and the filtered mesh represents an estimation of the spatial random error (σr). Since the uncertainty is the global parameter, The International Archives of the Photogrammetry, Remote Sensing and Spatial Information Sciences, Volume XLI-B5, 2016
once the random component is estimated, their difference will represent an estimation of the systematic component of the error.
5. EXPERIMENTAL RESULTS
The 5 sensors have been fixed on a tripod, used for digitizing the test object with the optical axis approximately orthogonal to the reference plane and moved from 550 mm to 1450 mm at steps of 100 mm, thanks to references drawn on the floor. The actual orientation was then slightly tilted from exactly 90° for minimizing the reflection that typically appears in the central part of the scanned surface, as for example the round area with no data in the lower central side of figures 3, 4 and 5.
All the software packages used for controlling the different sensors gave the opportunity to select various nominal operating volumes, ranging from small (600mm x 600mm x 600mm), to room size (5m x 5m x 5m). In our case the intermediate step was used (1m x 1m x 1m), but it was not clear how this setting influenced the sensor given that some 3D information was collected also for distances far larger than 1m. The specific minimal distance (550 mm) was chosen just testing on-the-fly during the experiment what was the real minimal distance giving some response. The maximum distance was defined similarly, by the sensor giving the better results also from a long range (Kinect2), that in this conditions allowed to work easily up to 1450 mm.
Figure 6. Microsoft Kinect1 global uncertainty (+); random error (dots) and quadratic fitting on the random error (line) exhibiting a correlation factor ρ = 0.9976.
Figure 7. ASUS Xtion global uncertainty, random error and quadratic fitting on the random error (ρ=0.9989).
Figure 8. Structure Sensor global uncertainty, random error and quadratic fitting on the random error (ρ=0.9992).
Figure 9. Microsoft Kinect2 global uncertainty, random error and linear fitting on the random error (ρ=0.8127).
Figure 10. Creative F200 global uncertainty, random error and quadratic fitting on the random error (ρ=0.9986). The vertical scale covers a larger span respect to the other plots, due to the higher values of errors.
All sensors were used for acquiring a single frame of the real-time 3D stream provided by the range device in steady condition. No time averaging was made.
Given that the framed area might contain several elements of the room in addition to the reference plane, a manual selection of the points belonging to the same plane was needed before starting all the following processing.
In Figure 6 to 10 the results related do the global uncertainty and the random error have been represented graphically, respectively for Asus Xion (6), Microsoft Kinect1 (7), Occipital Structure Sensor (8), Microsoft Kinect2 (9), and Creative Realsense F200 (10).
As expected the trend of the global uncertainty σu follows generally a growing trend with distance for each triangulation based device, as shown by figures 6, 7, 8, and 10. However this growth does not seem to be following a predictable behavior, probably due to the poor (or absent) calibration of the camera in charge of collecting the IR image from which the distances are calculated. All the depth images analyzed in this study exhibit a clear radial distortion varying with the different depths, that could be probably eliminated with a proper calibration and post-processing of the raw 3D data collected by the sensor.
Differently from σu, the random error σr extracted by such data follows coherently the quadratic behavior expected for any triangulation based device (Blais et al., 1988):
∆� ≅ � $
�� ∆�
where z is the probing range, f is the camera focal length, b is the camera-projector distance, or baseline, and Δp is the error on the measurement of the position of each dot in the projected pattern, intrinsically affected by the noise of the IR camera.
The efficiency of this approach seems to be confirmed by the high correlation between the various quadratic functions obtained by fitting a parabolic function on the measured σr at different working distances, reported in Table 3.
z different sensors used in this test.
z
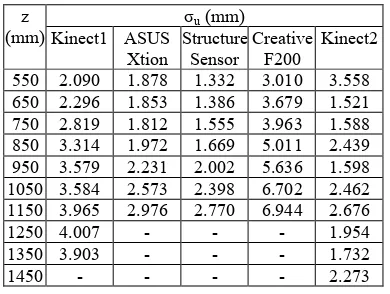
Table 2. Random error (extracted by the raw data as described in section 4.5) vs. distance for the different sensors used in this test.
Table 3. Correlation factor between the values of random error σr at the different distances and the related quadratic error model, for all the triangulation-based devices.
Differently from the triangulation-based devices, the Kinect2 (i.e. the only TOF-based device analyzed in this test) exhibits a nearly constant value of the random error at the different distances, following a slow growth roughly linear (ρ=0.8127), but maintaining values always lower than 1mm even at the maximum operating range (see Table 2). However, also for this device, the apparently poor calibration of the optoelectronic device in charge of collecting the IR echoes from the scene, tend to produce a global uncertainty much more erratic than the pure random error. This is in agreement with the trend found by other researchers focused on the same characterization on a larger range (Gonzalez-Jorge et al., 2015), except for the modeling of the random error, that does not seem following a quadratic growth.
6. CONCLUSIONS
The performances of five low-cost 3D sensors conceived for gesture tracking have been analyzed in terms of systematic errors and random errors for exploring the applicability of them in standard 3D capturing projects. Five actual devices have been tested featuring three different technologies: i) Kinect V1 by Microsoft, Structure Sensor by Occipital, and Xtion PRO by ASUS, all based on different implementations of the Primesense sensor; ii) F200 by Intel/Creative, implementing the Realsense pattern projection technology; Kinect V2 by Microsoft, equipped with the Canesta TOF Camera.
The tests have analyzed the range from 550mm to 1450mm that seems the more suitable for possible low-cost 3D acquisition with handheld devices, giving acceptable results with all the devices only between 550mm and 1150mm.
In this range the results exhibit a global uncertainty similar for all the Primesense-based devices, ranging from 2 to 3.9 mm for the Kinect1, from 1.9 to 2.9 mm for the Xion, from 1.3 to 2.8 mm for the structure sensor. Much worst results are produced by the Realsense-based unit, whose global uncertainty ranges from 3 to 6.9 mm at the same operating ranges.
Finally the Kinect2 unit, if excluded the closest range, exhibit a measurement uncertainty ranging from 1.4 and 2.7 mm even extending the analysis to the full operating range (up to 1450 mm), and seems therefore unbeatable above 1m if compared with any of the triangulation-based devices.
The experimental results obtained in our tests indicate that these five low-cost 3D sensors can certainly cater to gesture tracking and understanding. When it comes to precision manufacturing, their use is somewhat hindered by their intrinsic characteristics, i.e. low thermal stability, absence of trusted data on measurement uncertainty in repeatability and reproducibility conditions and lack of vertical integration into current inspection software pipeline. This is not to say that there are no 3D inspection and modeling problems they can tackle. If those intrinsic characteristics are not that important then such examples as digitization of rough handmade mockups for design purposes, the acquisition of shapes for determining volumes (parcel shipping) independently of the fine details, or the rough digitization of human bodies for the estimation of garment sizes. In these cases, low-cost devices can be effectively used. Like with any use of a The International Archives of the Photogrammetry, Remote Sensing and Spatial Information Sciences, Volume XLI-B5, 2016
preferred technology there is always a contender or competitor, i.e. multi-view dense 3D.
Furthermore, the comparative results obtained suggest the possibility to greatly enhance the performances of such devices by adding a proper modeling of the optical device and an associated calibration process for reducing the strong systematic error component that emerged for all the tested devices. This point will be explored in a future research.
ACKNOWLEDGEMENTS
The authors would like to thank Jean-Angelo Beraldin for very useful discussions about the applicability of the analyzed devices; Giandomenico Caruso and Mario Covarrubias from the Department of Mechanical Engineering at Politecnico di Milano for having provided the Kinect1 and the Structure sensors; Paolo Belluco from B10NIX S.r.l. Milan for having provided the Kinect2 sensor, and Matteo Matteucci from DEIB for having provided the ASUS Xion sensor.
The authors would also like to acknowledge the contribution of Roberto Belloni in collecting some of the data presented in this paper.
REFERENCES
Alnowami, M., Alnwaimi, B., Tahavori, F., Copland, M., Wells, K., 2012. A quantitative assessment of using the Kinect for Xbox360 for respiratory surface motion tracking. Proc. SPIE. doi:10.1117/12.911463
Bamji, C.S., O’Connor, P., Elkhatib, T., Mehta, S., Thompson, B., Prather, L.A., Snow, D., Akkaya, O.C., Daniel, A., Payne, A.D., Perry, T., Fenton, M., Chan, V.H., 2015. A 0.13 um CMOS System-on-Chip for a 512x424 Time-of-Flight Image Sensor with Multi-Frequency Photo-Demodulation up to 130 MHz and 2 GS/s ADC. IEEE J. Solid-State Circuits 50, 303–319. doi:10.1109/JSSC.2014.2364270
Blais, F., Rioux, M., Beraldin, J.A., 1988. Practical Considerations For A Design Of A High Precision 3-D Laser Scanner System. Proc. SPIE 0959, Optomech. Electro-Optical Des. Ind. Syst.
Bolt, R.A., 1980. “Put-that-there”: Voice and Gesture at the Graphics Interface. SIGGRAPH Comput. Graph. 14, 262–270. doi:10.1145/965105.807503
DiFilippo, N.M., Jouaneh, M.K., 2015. Characterization of Different Microsoft Kinect Sensor Models. IEEE Sens. J. 15, 4554–4564. doi:10.1109/JSEN.2015.2422611
Fisher, S.S., 1987. Telepresence master glove controller for dexterous robotic end-effectors, in: Casasent, D.P. (Ed.), Proceedings of SPIE - The International Society for Optical Engineering. pp. 396–401. doi:10.1117/12.937753
Gonzalez-Jorge, H., Riveiro, B., Vazquez-Fernandez, E., Martínez-Sánchez, J., Arias, P., 2013. Metrological evaluation of Microsoft Kinect and Asus Xtion sensors. Meas. J. Int. Meas.
Confed. 46, 1800–1806.
doi:10.1016/j.measurement.2013.01.011
Gonzalez-Jorge, H., Rodriguez-Gonzalvez, P., Martanez-Sanchez, J., Gonzolez-Aguilera, D., Arias, P., Gesto, M., Diaz-Vilarino, L., 2015. Metrological comparison between Kinect i and Kinect II sensors. Meas. J. Int. Meas. Confed. 70, 21–26. doi:10.1016/j.measurement.2015.03.042
Guidi, G., 2013. Metrological characterization of 3D imaging devices. Proc. SPIE 8791, 87910M. doi:10.1117/12.2021037
Guidi, G., Russo, M., Magrassi, G., Bordegoni, M., 2010. Performance Evaluation of Triangulation Based Range Sensors. Sensors 10, 7192–7215. doi:10.3390/s100807192
Hirakawa, K., Parks, T.W., 2006. Image denoising using total least squares. IEEE Trans. Image Process. 15, 2730–2742. doi:10.1109/TIP.2006.877352
Joint Committee For Guides In Metrology (JCGM), 2008. International vocabulary of metrology (JCGM 200:2012) — Basic and general concepts and associated terms. VIM3 Int. Vocab. Metrol. 3, 104. doi:10.1016/0263-2241(85)90006-5
Khoshelham, K., Elberink, S.O., 2012. Accuracy and resolution of kinect depth data for indoor mapping applications. Sensors 12, 1437–1454. doi:10.3390/s120201437
Lee, J.C., 2008. Hacking the Nintendo Wii Remote. IEEE Pervasive Comput. 7, 39–45. doi:10.1109/MPRV.2008.53
Lightman, K., 2016. Silicon gets sporty. IEEE Spectr. 53, 48–53. doi:10.1109/MSPEC.2016.7420400
Maizels, A., Shpunt, A., Litvak, S., 2010. Enhanced 3d interfacing for remote devices. US20100235786.
Mallick, T., Das, P.P., Majumdar, A.K., 2014. Characterizations of noise in Kinect depth images: A review. IEEE Sens. J. 14, 1731–1740. doi:10.1109/JSEN.2014.2309987
Marks, R., 2011. 3D spatial interaction for entertainment, in: 2011 IEEE Symposium on 3D User Interfaces (3DUI). IEEE, pp. x–x. doi:10.1109/3DUI.2011.5759209
Molnár, B., Toth, C.K., Detrekői, a., 2012. Accuracy Test of Microsoft Kinect for Human Morphologic Measurements. ISPRS - Int. Arch. Photogramm. Remote Sens. Spat. Inf. Sci. XXXIX-B3, 543–547. doi:10.5194/isprsarchives-XXXIX-B3-543-2012
Newcombe, R.A., Izadi, S., Hilliges, O., Molyneaux, D., Kim, D., Davison, A.J., Kohli, P., Shotton, J., Hodges, S., Fitzgibbon, A., 2011. KinectFusion: Real-Time Dense Surface Mapping and Tracking, in: IEEE ISMAR. IEEE.
Nintendo, 2008. Consolidated Financial Highlights [WWW
Document]. Intern. Doc. URL
www.nintendo.co.jp/ir/pdf/2008/080124e.pdf (accessed 4.6.16).
Payne, A., Daniel, A., Mehta, A., Thompson, B., Bamji, C.S., Snow, D., Oshima, H., Prather, L., Fenton, M., Kordus, L., O’Connor, P., McCauley, R., Nayak, S., Acharya, S., Mehta, S., Elkhatib, T., Meyer, T., O’Dwyer, T., Perry, T., Chan, V.H., Wong, V., Mogallapu, V., Qian, W., Xu, Z., 2014. A 512×424 CMOS 3D Time-of-Flight Image Sensor with Multi-Frequency Photo-Demodulation up to 130MHz and 2GS/s ADC, in: Solid-State Circuits Conference Digest of Technical Papers (ISSCC), 2014 IEEE International. pp. 134–135. doi:10.1109/ISSCC.2014.6757370
Rico, J., Crossan, A., Brewster, S., 2011. Gesture Based interfaces: practical applications oof gestures in real world mobile settings, in: England, D. (Ed.), Whole Body Interaction. Springer London, London, pp. 173–186. doi:10.1007/978-0-85729-433-3_14
Sell, J., O’Connor, P., 2014. The Xbox One System on a Chip The International Archives of the Photogrammetry, Remote Sensing and Spatial Information Sciences, Volume XLI-B5, 2016
and Kinect Sensor. IEEE Micro 34, 44–53. doi:10.1109/MM.2014.9
Taubin, G., 1995. A Signal Processing Approach to Fair Surface Design, in: Proceedings of the 22Nd Annual Conference on Computer Graphics and Interactive Techniques, SIGGRAPH ’95. ACM, New York, NY, USA, pp. 351–358.