PLASTIC AND GLASS GREENHOUSES DETECTION AND DELINEATION FROM
WORLDVIEW-2 SATELLITE IMAGERY
D. Koc-Sana, b,*, N.K. Sonmeza, b
aAkdeniz University, Department of Space Sciences and Technologies, 07058, Antalya, Turkey b
Akdeniz University, Remote Sensing Research and Application Centre, 07058, Antalya, Turkey ([email protected], [email protected])
Commission VII, WG VII/4
KEY WORDS:Greenhouses, SVM, RF, Boundary Tracing, Line Simplification, WorldView-2
ABSTRACT:
Greenhouse detection using remote sensing technologies is an important research area for yield estimation, sustainable development, urban and rural planning and management. An approach was developed in this study for the detection and delineation of greenhouse areas from high resolution satellite imagery. Initially, the candidate greenhouse patches were detected using supervised classification techniques. For this purpose, Maximum Likelihood (ML), Random Forest (RF), and Support Vector Machines (SVM) classification techniques were applied and compared. Then, sieve filter and morphological operations were performed for improving the classification results. Finally, the obtained candidate plastic and glass greenhouse areas were delineated using boundary tracing and Douglas Peucker line simplification algorithms. The proposed approach was implemented in the Kumluca district of Antalya, Turkey utilizing pan-sharpened WorldView-2 satellite imageries. Kumluca is the prominent district of Antalya with greenhouse cultivation and includes both plastic and glass greenhouses intensively. When the greenhouse classification results were analysed, it can be stated that the SVM classification provides most accurate results and RF classification follows this. The SVM classification overall accuracy was obtained as 90.28%. When the greenhouse boundary delineation results were considered, the plastic greenhouses were delineated with 92.11% accuracy, while glass greenhouses were delineated with 80.67% accuracy. The obtained results indicate that, generally plastic and glass greenhouses can be detected and delineated successfully from WorldView-2 satellite imagery.
* Corresponding author
1. INTRODUCTION
Determination of existing greenhouse areas is very important for urban and rural planning, sustainable development, yield estimation and planning and avoiding environmental problems related to greenhouse expansion (Agüera and Liu, 2009; Koc-San, 2013a; Tasdemir and Koc-Koc-San, 2014). However, obtaining geographic data is very time consuming and expensive. The biggest problem in Geographic Information Systems applications is the lack of up-to-date data. This problem can be resolved by using remotely sensed data. With the recent technological developments, the high resolution satellite images have become important data sources that can be used for obtaining and updating man-made objects and geographical data rapidly and effectively, for mapping applications and urban planning (Muyanga et al., 2007; Koc-San and Turker; 2012, Liu et al., 2015, Wang et al., 2015). The high resolution satellite images can also be used to monitor the current situation and expansion of the greenhouse areas efficiently (Agüera and Liu, 2009; Koc-San, 2013a; Tasdemir and Koc-San, 2014).
In the literature, there are limited numbers of studies for greenhouse extraction using remotely sensed data. In a study conducted by Agüera et al. (2006), the existing plastic greenhouse database was updated from QuickBird satellite images. For this purpose, initially the ML classification was used for detecting greenhouse areas and then the new greenhouses were detected by comparing the detected greenhouse areas with existing plastic greenhouse database.
Finally, the boundaries of these new greenhouses were delineated using Hough transformation. The obtained results indicate that, the new greenhouse areas were extracted with 91.45% accuracy. Agüera et al. (2008) aimed to compare Quickbird and IKONOS images for detecting plastic greenhouses using ML classification technique and to analyse the effect of texture bands to the classification accuracy. They achieved slightly higher classification accuracies utilising Quickbird images and the texture bands did not affect the classification results considerably. Agüera and Liu (2009), proposed an approach for automatic greenhouse extraction form QuickBird and IKONOS satellite images. In their study, firstly ML and Extraction and Classification of Homogeneous Objects (ECHO) classifiers were performed for plastic greenhouse detection. The classification accuracies were computed as 90% and 84.20% for Quickbird and IKONOS images respectively. After detecting the greenhouse areas, the boundaries were delineated using Hough transform. They revealed that using the proposed approach greenhouse boundaries were delineated from Quickbird images with 66.70% accuracy and from IKONOS images with 49.00% accuracy.
detection of plastic covered vineyards from aerial images and they obtained 90.25% accuracy.
In greenhouse extraction studies, generally the target objects are plastic greenhouses. In the study conducted by Sönmez and Sar (2006), both plastic and glass greenhouses were considered. They detected greenhouses from IKONOS imageries by visual image interpretation and extracted their boundaries manually. The accuracy assessment results showed that the extraction accuracies are 97.00 and 96.10 for the plastic and glass greenhouses, respectively.
Another study that considers both plastic and glass greenhouses is the study carried out by Koc-San (2013a) in Muratpasa district of Antalya. This study aimed to classify land covers with emphasis on greenhouse detection using ML, RF and SVM classification techniques and to compare the results. The obtained results indicate that the SVM classification provides the highest accuracy with 93.88% overall accuracy value. This study does not include obtaining greenhouse borders in vector form.
The objectives of the present study are (i) to detect plastic and glass greenhouses from WorldView-2 satellite imagey using and comparing ML, RF and SVM classifiers and (ii) to delineate the plastic and glass greenhouse boundaries.
2. STUDY AREA AND DATA SETS
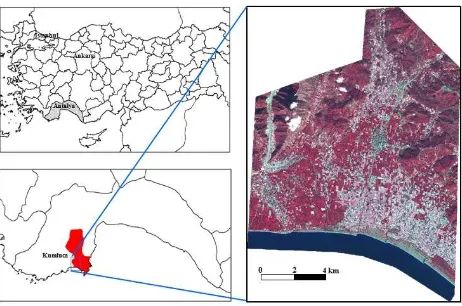
The geographical and climatic characteristics and ecological srtucture of Antalya province is suitable for greenhouse cultivation. According to the Turkish Statistical Institute reports, in 2013 there are 24,234 ha and 61,512 ha greenhouse agticulture areas in Antalya and Turkey, respectively (TSI, 2014). In addition, Antalya includes 83% of glass greenhouses and 54% of plastic greenhouses of Turkey. Therefore, Antalya is the most prominent province of Turkey with respect to greenhouse cultivation. Green agriculture activities were started in Antalya in 1940 and there has been significant progress in this sector until 2009 (Governorship of Antalya, Provincial Directorate of Agriculture, 2011). Kumluca is known as the capital of greenhouse in Turkey and includes intensive greenhouse areas. There are 3050 ha plastic and 670 ha glass greenhouses (TSI, 2013). Hence, Kumluca is selected as study area in this study (Figure 1).
The data sets used in this study are satellite images and reference data. The used remotely sensed data is WorldView-2 satellite imagery and it is purchased as OrthoReady Standard (OR2A), 8 band bundle (Pan + MS). The spatial resolutions of WorldView-2 images are 0.5m for panchromatic and 2m for multispectral bands. Besides, it is the first high resolution commercial satellite that includes 8 spectral bands (Coastal, Blue, Green, Yellow, Red, Red Edge, Near IR1, and Near IR2). The image was obtained on November 22, 2011.
The reference data used in this study are acquired from the Kumluca Municipality and include greenhouse boundaries. These boundaries were used as reference data after updating and editing procedures.
3. METHODOLOGY
There are mainly three steps in this study, which are (i) pre-processing, (ii) detection of greenhouse areas using
classification techniques and (iii) delineation of greenhouse boundaries.
Figure 1.The study area that is located in Kumluca, Antalya, Turkey and color infrared composite of WorldView-2 satellite
imagery for the selected study area
3.1 Pre-processing
In this study, image pan-sharpening and geometric correction operations were performed as pre-processing.
3.1.1 Pan-sharpening: Pan-sharpening is useful for improving image interpretation visually. As a result of pan-sharpening algorithm, a new data set is created using the spatial information of panchromatic image and spectral information of multispectral images. This data set is high resolution color image. In this study, the panchromatic and multispectral images were fused using PANSHARP algorithm of PCI Geomatica image processing software and 0.5m spatial resolution multispectral image (8 bands) was obtained. This sharpening algorithm provides fine sharpening results, while protecting the spectral characteristics of the original images (PCI Software Users Manual, 2013). Ghosh and Joshi (2013) used and compared 12 image fusion algorithms for pan-sharpening of WorldView-2 satellite images. They showed that the PANSHARP algorithm provides quite successful results and the PANSHARP and HDF techniques generate superior pan-sharpened images than others. Therefore, we preferred to use PANSHARP algorithm in this study.
3.1.2 Geometric Correction: The geometric correction of WorldView-2 satellite image is necessary for overlating them with Geographical Information Systems data, to obtain greenhouse boundaries in real coardinates and to compare the obtained results with reference data for accuracy assessment. The Rational Function Model (RFM) is one of the most popular methods for high resolution orthorectification. The topographic relief did not apply WorldView-2 OR2A images, so it is an appropriate image for the orthorectification. Cheng (2011) show that OR2A images provides better results than Basic 1B images when RFM technique and equal size ground control points were used. In this study, OrthoEngine Module of PCI Geomatica was used for applying RFM technique. The RFM method is based on block adjustment, which is developed by Grodecki and Dial (2003).
obtained lower than centimetre accuracy. Then, eleven GCPs were selected that are distributed homogeneously in the image and these points were used in geometric correction. The Root Mean Square Error (RMS) values were computed as less than half of a pixel size. The RMS, XRMS and YRMS values were calculated as 0.45, 0.34 and 0.29, respectively.
3.2 Image Classification
In this study, initially the WorldView-2 satellite images were classified for detecting the greenhouse areas. The ML, RF, and SVM classifications were performed and the obtained results were compared. In the greenhouse delineation stage, the classification result that gave highest accuracy was used. The ML classifier is one of the most commonly used supervised classification techniques in the literature and it uses probability density function to classify the pixels into determined classes. This classifier was used as a benchmark method in this study, because it provides generally successful results.
On the other hand, the RF and SVM machine learning algorithms are non-parametric and relatively new classification techniques in remote sensing researchs. The RF classifier is an ensemble learning technique that is based on decision tree and proposed by Breiman (2001). One third of the training samples are utilized for out of-bag error estimation while the rest of the training samples are used for tree construction. In RF classifier there are two important parameters, which are k: number of trees for growing the RF and m: number of variables for splitting each node (Koc-San, 2013b).
SVM classifier is based on statistical learning theory (Vapnik, 1995). The aim of this classification is to find the optimum hyperplane which separates the classes. For this purpose, training samples are defined as feature vector. If the training samples can not be separated linearly, the feature vectors are transformed into a feature space by utilizing a kernel function. The training samples which are closest to the hyperplane are called as support vectors. While performing SVM classification, the selection of penalty parameter, kernel method and kernel related parameters are important.
In this study to perfom the supervised classification techniques, firstly the classes were determined by analysing the image visually and based on the observations during the field study. Then, image was displayed infrared color composite in which the classes were better discriminated and the training and testing pixels were collected independently from each other, with the help of information obtained in the field study. The objective of this study is to extract plastic and glass greenhouses, thus the study was especially focused on greenhouse areas and the other classes were aggregated. The determined classes are Plastic Greenhouses , Glass Greenhouses and Other Classes . The other classes include the agriculture, vegetation, bareland, building, road, shadow and water sub-classes. The training and testing pixels were selected from the roughly collected training areas by using stratified random sampling method. For each class 1000 training samples and 2000 testing samples were collected.
The RF classification was performed via ImageRF that is an IDL-based RF classification tool (Jakimow et. al., 2012; Waske et al., 2012). The k value is determined as 1000, while m value is determined as square root of all features, and Gini coefficient was used as impurity function. Besides, the SVM classification was carried out via IDL-based ImageSVM tool, which is
developed by Geomatics Lab of Humboldt-Universitat zu Berlin (Van der Linden et al., 2010; Rabe et al., 2010). Radial Basis Function was selected as kernel method and the optimum gamma and penalty parameters were defined by 5-fold cross validation technique.
3.3 Delineation of Greenhouse Boundaries
In classification results there can be misclassified pixels. To remove them Sieve filter and opening closing morphological operations were carried out. Sieve filter is a filter that is used to remove small classification areas from the classification result. The morphologic operations process the images according to the shape. To remove the image details that are smaller than the structuring element, sequential opening and closing operations were performed and the general shapes of the objects were preserved (Sonka et al., 1998). The opening and closing operations are based on erosion and dilation operations. Opening is an erosion followed by dilation, while closing is a dilation followed by erosion.
After removing misclassified pixels, the Canny Edge Detection algorithm was applied to detect the edges of greenhouse areas. Then, to vectorize the detected greenhouse areas the boundary tracing algorithm was performed. The boundary tracing algorithm delineates the boundaries from the binary image that include the edges of the objects of interest. In this algorithm, first of all the starting point and direction is determined. Then, the neighbour pixel coordinates, which is connected to the starting pixel with determined direction, are determined. This process continues until the connected pixels end. Using this algorithm the boundaries of the detected greenhouses were determined. However, these vector boundaries were obtained from the raster form classification result that causes undulations on the delineated boundaries. To remove these undulations, Douglas Peucker line simplification algorithm was applied (Hershberger and Snoeyink, 1992). This algorithm uses the proximity of the vertex to the edge segments for line simplification and repeatedly subdivides the polygon until the vertexes can be returned to a straight line segment. The algorithm starts with first estimation, the distances between the defined edge and vertexes were calculated and compared with tolerance value. If the calculated distance is smaller than the tolerance value the estimation is accepted and new estimation is created.
3.4 Accuracy Assessment
The quantitative assessment of the obtained classification results were performed using confusion matrix that is a widely used accuracy assessment technique in image classification studies. The overall accuracy, overall kappa, user s accuracy and producer s accuracy values were computed from the confusion matrices.
areas, which are not greenhouse in the automatic extraction result, but greenhouse in the reference data. Using these values, Branching Factor (BF=FP/TP), Miss Factor (MF=FN/TP), Greenhouse Delineation Percentage (100*TP/(TP+FN)) and Quality Percentage (QP=100*TP/(TP+FP+FN)) were computed. The BF indicates the rate of incorrectly determined greenhouse areas, while MF describes the rate of missed greenhouse areas. Additionally, the GDP shows the percentage of correctly delineated greenhouse areas and QP gives the overall measure of the performance.
4. EXPERIMENTAL RESULTS
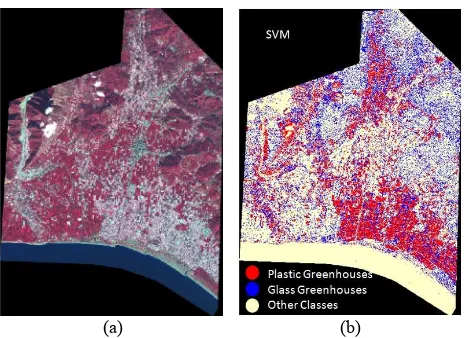
The confusion matrices of ML, RF and SVM classifiers are given in Tables 1, 2, and 3, respectively. When the obtained results were analysed, it can be stated that all three classification techniques provide quite successful results for plastic and glass greenhouse detection from WorldView-2 satellite imagery. The highest accuracies were obtained using SVM classifier with overall accuracy value of 90.28% and overall kappa value of 0.85. The RF classifier follows the SVM with slightly lower accuracy values (Overall accuracy 87.22% and Overall Kappa: 0.81). The ML classifier gave lowest accuracies with 85.65 overall accuracy value and 0.78 overall kappa value. The SVM classification result, which provided the best result, is illustrated in Figure 2.
Groun Truth
Class
Plastic Greenhouse
Glass Greenhouse
Other Classes Total
Plastic Greenhouse 1663 140 23 1826
Glass Greenhouse 266 1795 296 2357
Other Classes 71 65 1681 1817
Total 2000 2000 2000 6000
Producer s Acc. (%) 83.15 89.75 84.05
User s Acc. (%) 91.07 76.16 92.52
Overall Acc. (%): 85.65; Overall Kappa: 0.78
Table 1.The confusion matrix of ML classification result
Groun Truth
Class
Plastic Greenhouse
Glass Greenhouse
Other Classes Total
Plastic Greenhouse 1710 201 104 2015
Glass Greenhouse 156 1660 33 1849
Other Classes 134 139 1863 2136
Total 2000 2000 2000 6000
Producer s Acc. (%) 85.50 83.00 93.15
User s Acc. (%) 84.86 89.78 87.22
Overall Acc. (%):87.22; Overall Kappa: 0.81
Table 2.The confusion matrix of RF classification result
Groun Truth
Class
Plastic Greenhouse
Glass Greenhouse
Other Classes Total
Plastic Greenhouse 1826 225 74 2125
Glass Greenhouse 112 1674 9 1795
Other Classes 62 101 1917 2080
Total 2000 2000 2000 6000
Producer s Acc. (%) 91.30 83.70 95.85
User s Acc. (%) 85.93 93.26 92.16
Overall Acc.(%): 90.28; Overall Kappa: 0.85
Table 3.The confusion matrix of SVM classification result
(a) (b)
Figure 2.The infrared color composite of Kumluca WorldView-2 satellite imagery (a) and the SVM classification
result (b).
When the user s and producer s accuracy values were analysed for SVM classification result, it can be stated that the plastic greenhouses are detected relatively more accurately than glass greenhouses. This difference thought to be because of the unique radiance values of plastic greenhouses which are different from the other classes and transparent structure of the glass greenhouses that causes different radiance values according to the agricultural products in them.
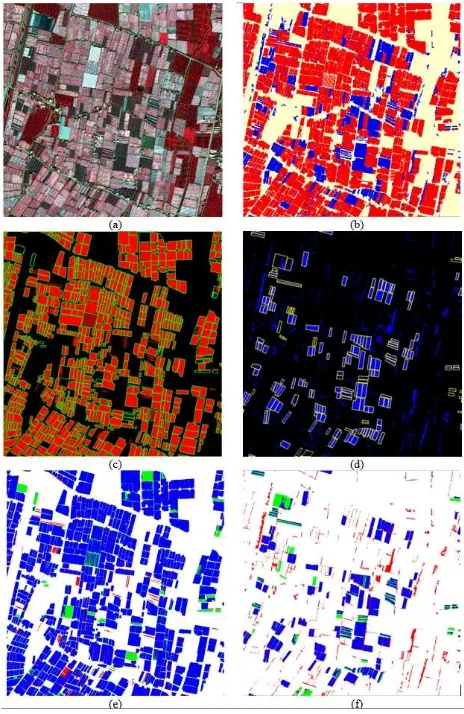
The thematic map obtained using classification techniques includes plastic greenhouses, glass greenhouses, and other classes. In the greenhouse boundary delineation stage, a sample area (3402 pixel x 3524 line) was determined from the study area and the plastic and glass greenhouses were handled separately. The boundary tracing and line simplification algorithms that follows filtering and morphological operations were applied to individual plastic greenhouse and glass greenhouse binary images acquired from SVM classification result. The quantitative evaluation results of the delineated greenhouse boundaries are given in Table 4. The selected sample area, the obtained plastic and glass greenhouse boundaries and the TP, TN, FP, and FN areas generated for accuracy assessment are presented in Figure 3.
BF MF GDP QP
Plastic Greenhouses 0.05 0.09 92.11 87.79
Glass Greenhouses 0.46 0.24 80.67 58.73
Figure 3. Greenhouse delineation: color infrared composite of selected study area (a), SVM classification result after filtering operations (b), the obtained plastic greenhouses (red areas) overlaid with reference plastic greenhouses (green polygons) (c), the obtained glass greenhouses (blue areas) overlaid with reference glass greenhouses (yellow polygons) (d), the True Positive-TP (Blue), True TN (White), False Negative-FN (Green), and False Positive-FP (Red) areas for plastic greenhouses (e) and glass greenhouses (f).
When the obtained plastic and glass greenhouse boundaries analysed, it was observed that there are undulations on the boundaries. It was also observed that after applying line simplification algorithm, these undulations were removed and more straight boundaries were derived (Figure 4). According to the quantitative evaluation results, the plastic and glass greenhouses were delineated with 92.11% and 80.67 accuracies, respectively. Moreover, the quality percentage values were computed as 87.79 and 58.73 for plastic and greenhouses, respectively. The higher delineation accuracies for plastic greenhouses than glass greenhouses is an expected result, because the plastic greenhouses detection percentages using image classification was also higher than glass greenhouses.
(a) (b)
Figure 4.Greenhouse delineation: Greenhouse boundaries after applying boundary tracing (a) and Douglas Peucker line simplification (b) algorithms.
5. CONCLUSIONS
The objectives of this study are to detect the plastic and glass greenhouses using WorldView-2 satellite images and then to delineate the boundaries of the detected greenhouse areas. The ML, RF and SVM classifiers were used for detecting the greenhouse areas and their performances were compared. The SVM classification result, which gave the highest accuracy, was used in the greenhouse delineation stage. Before delineating the edges, the Sieve filter and morphological operations were performed to improve the classification results. The boundaries were delineated using sequential Canny edge detection, boundary tracing and Douglas Peucker line simplification algorithms. The developed approach was tested in Kumluca, Antlaya, where there are plastic and glass greenhouses intensively, using WorldView-2 satellite image.
The obtained results showed that the WorldView-2 satellite images are quite promising for plastic and glass greenhouse detection and delineation. All of the classification techniques used in this study provided higher overall accuracy values than 85.00%. When the used three algorithms were compared, it can be said that the SVM classification offered better accuracies than ML and RF classifiers in this study. The greenhouse delineation results revealed that the applied approach provided satisfactory results with greenhouse delineation percentages higher than 80.00%. When the plastic and glass greenhouse extraction results were compared, it can be seen that the plastic geenhouses were detected and extracted more accurately than glass greenhouses.
ACKNOWLEDGEMENTS
This work was supported by the Scientific Research Projects Coordination Unit of Akdeniz University. Project Number: 2013.01.0115.001.
REFERENCES
Agüera, F. and Liu, J. G., 2009. Automatic greenhouse delineation from Quickbird and Ikonos satellite images.
Computers and Electronics in Agriculture, 66 (2009), pp.
191-200.
Agüera, F., Aguilar, F. J. and Aguilar, M. A., 2008. Using texture analysis to improve per-pixel classification of very high resolution images for mapping plastic greenhouses. ISPRS
Journal of Photogrammetry and Remote Sensing, 63 (2008) pp.
Agüera, F., Aguilar, M. A. and Aguilar, F. J., 2006. Detecting greenhouse changes from Quickbird imagery on the Mediterranean coast.International Journal of Remote Sensing, Vol.27, No. 21, pp. 4751-4767.
Breiman, L., 2001. Random Forests.Machine Learning, 45, 5-32.
Carjaval, F., Agüera, F., Aguilar, F. J. and Aguilar, M. A., 2010. Relationship between atmospheric corrections and training-site strategy with respect to accuracy of greenhouse detection process from very high resolution imagery.
International Journal of Remote Sensing, 31(11), pp.
2977-2994.
Cheng, P., 2011. Geometric correction and automatic DEM extraction of WorldView stereo data. In:Proceedings of Asian
Association on Remote Sensing, Taipei.
Ghosh, A. and Joshi, P. K., 2013. Assessment of pan-sharpened very high resolution WorldView-2 Images. International
Journal of Remote Sensing, 34(23), pp. 8322-8345.
Governorship of Antalya, Provincial Directorate of Agriculture, 2011.Antalya Agriculture Master Plan (Antalya Tar m Master
Plan ). ISBN: 978-605-5627-13-3, Antalya.
Grodecki and Dial, 2003. Block adjustment of high-resolution satellite images described by rational functions.
Photogrammetric Engineering and Remote Sensing, 69(1), pp.
59-68.
Hershberger, J. and Snoeyink, J., 1992. Speeding up the Douglas Peucker line simplification algorithm. Technical Report, In. Proc. 5th Intl. Symp. Spatial Data Handling, pp. 134-143.
Jakimow, B., Oldenburg, C., Rabe, A. Wask, B. van der Linden, S. and Hostert, P., 2012. Manual for Appilcation: ImageRF (1.0). Universtat Bonn and Humboldt Universitat zu Berlin, Germany.
Koc-San D., 2013a. Evaluation of different classification techniques for the detection of glass and plastic greenhouses from worldview-2 satellite imagery.Journal of Applied Remote
Sensing, vol.7, 073553-1-20.
Koc-San D. and Turker, M. 2012. A model-based approach for automatic building database updating from high resolution space imagery. International Journal of Remote Sensing, 33(13), pp. 4193-4218.
Koc-San D., 2013b. Thematic mapping of urban areasfrom WorldView-2 satellite imagery using machine learning algorithms.Journal of Geodesy and Geoinformation, 2(1), pp. 29-38.
Koc-San, D. and Turker, M. (2012). A model-based approach for automatic building database updating from high resolution space imagery. International Journal of Remote Sensing, 33(13), pp. 4193-4218.
Liu, J., Li., P. and Wang, X. 2015. A new segmentation method for very high resolution imagery using spectral and morphological information.ISPRS Journal of Photogrammetry
and Remote Sensing, 101, pp. 145-162.
Mayunga, S. D., Coleman, D. J. and Zhang, Y. 2007. A semi-automated approach for extracting buildings from Quickbird imagery applied to informal settlement mapping.International
Journal of Remote Sensing, 28(10), pp. 2343-2357.
PCI Software Users Manual, 2013. PCI Geomatics Enterprises Inc., Richmond Hill, Ontario, Canada.
Rabe, A., Van der Linden, S., Hostert, P. 2010. ImageSVM, Version 2.1, software available at www.hu-geomatics.de.
Shufelt, J.A. and McKeown, D.M., 1993. Fusion of monocular cues to detect man-made structures in aerial imagery. CVGIP: Image Understanding, 57, pp. 307 330.
Sonka M., Hlavac V., Boyle R., 1998. Image Processing,
Analysis, and Machine Vision.PWS Publishing.
Sönmez, N. K. and Sari, M., 2006. Use of remote sensing and geographic information technologies for developing greenhouse databases.Turkish Journal of Agriculture and Forestry, 30 (6), pp. 413-420.
Tarantino E. and Figorito, B., 2012. Mapping rural areas with widespread plastic covered vineyards using true color aerial data.Remote Sensing, 4, pp. 1913-1928.
Tasdemir, K. and Koc-San, D., 2014. Unsupervised extraction of greenhouses using WorldView_2 images. In:IGARSS2014 &
35th Canadian Symposium on Remote Sensing, July 13-18,
Quebec, Canada.
TSI- Turkish Statistical Institute, 2014. Seçilmi Göstergelerle
Antalya, Yay n No: 4232, Türkiye Istatistik Kurumu Matbaas ,
Ankara. ISBN 978-975-19-6122-8.
Vapnik, V. N., 1995. The Nature of Statistical Learning
Theory, Springer-Verlag, New York.
Van der Linden, S., Rabe, A., Wirth, F., Suess, S., Okujeni, A., Hostert, P. 2010. ImageSVM Classification, Manual for
Application: ImageSVM. version 2.1. Humboldt-Universitat zu
Berlin, Germany.
Wang, J., Yang, X., Qin, X., Ye, X. and Qin, Q, 2015. An efficient approach for automatic rectangular building extraction from very high resolution optical satellite imagery. IEEE
Geoscience and Remote Sensing Letters, 12(3), pp. 487-491.