AUTOMATIC GENERATION OF BUILDING MODELS WITH LEVELS OF DETAIL 1-3
W. Nguatema, M. Drauschkea,b∗, H. Mayera
aBundeswehr University Munich, Institute for Applied Computer Science, Visual Computing, Neubiberg, Germany b
German Aerospace Center, Institute of Robotics and Mechatronics, Perception and Cognition, Oberpfaffenhofen, Germany [email protected] – [email protected] – [email protected]
Commission III, WG III/4
KEY WORDS:Building Model, Orientation, 3D Reconstruction, Point Cloud, Segmentation
ABSTRACT:
We present a workflow for the automatic generation of building models with levels of detail (LOD) 1 to 3 according to the CityGML standard (Gr¨oger et al., 2012). We start with orienting unsorted image sets employing (Mayer et al., 2012), we compute depth maps using semi-global matching (SGM) (Hirschm¨uller, 2008), and fuse these depth maps to reconstruct dense 3D point clouds (Kuhn et al., 2014). Based on planes segmented from these point clouds, we have developed a stochastic method for roof model selection (Nguatem et al., 2013) and window model selection (Nguatem et al., 2014). We demonstrate our workflow up to the export into CityGML.
1. INTRODUCTION
The automatic derivation of 3D-models of individual buildings is essential for the generation of landscape and city models of larger areas, especially if the data is used for further analysis or if it is presented in simulation environments. Also, the data of large 3D surface meshes needs to be reduced, e.g., by replacing mesh parts by geometric primitives (Schnabel et al., 2007, Lafarge and Mallet, 2012), or by deriving building models on various levels of detail (Becker and Haala, 2008, Verdie et al., 2015).
In recent years, we proposed three methods for the automatic gen-eration of building models with different levels of detail (LOD) following the LOD definitions of CityGML 2.0 (Gr¨oger et al., 2012). First, we demonstrated our ability to detect cuboid based buildings and their major walls, i.e., LOD 1 (Nguatem et al., 2012). Second, we presented a method for determining roof mod-els to obtain building modmod-els with LOD 2 (Nguatem et al., 2013). And finally, we proposed a reliable window and door extraction method for modelling building fac¸ades with LOD 3 (Nguatem et al., 2014). All methods rely on statistical evaluation of the 3D points. They perform well even if the reconstructed point cloud is noisy or if it contains many holes due to, e.g., bright or texture-less object surfaces. I.e., our approach is robust for different kinds of data.
In this paper, we present a combination of our previously pub-lished methods and the workflow for automatic data analysis con-sisting of the orientation of images, the computation of depth maps, the generation of highly detailed 3D-point clouds, and fi-nally the interpretation of the data and the construction of build-ing models. Our workflow is almost fully automatic, only very little manual interaction is needed for inspecting the intermedi-ate results, for scaling the dense point cloud, and for rotating the scene into a selected coordinate system. The last two interac-tions could be skipped if the GPS-information of the acquired im-ages is used. Our software returns the recognized building parts, i.e., walls, roof planes, and windows, and we export the model in CityGML 2.0 format (Gr¨oger et al., 2012).
The paper is structured as follows: In the next section, we de-scribe our methodology. Section 3 presents and discusses our
∗Corresponding author.
experiments. Finally, we summarize the current state of our work and propose next steps for our work.
2. METHODOLOGY
In this section, we first present and discuss our workflow starting with image orientation and ending with the reconstruction of a dense 3D-point cloud. Second, we describe our semantic analysis for building modelling.
2.1 3D-Point Cloud Generation
As first step, we estimate image orientations with (Mayer et al., 2012) including the recent improvements (Mayer, 2014, Miche-lini and Mayer, 2014, MicheMiche-lini and Mayer, 2016). The orienta-tion procedure efficiently estimates camera poses also for large, unsorted image sets. To this end, the images are first sorted ac-cording to the number of matched SIFT points (Lowe, 2004), to obtain overlap information between the images. Then, a triplet graph is constructed (Michelini and Mayer, 2016) and highly pre-cise poses are estimated for the triplets. Finally, the poses of im-age triplets are hierarchically merged including the detection of critical camera configurations (Michelini and Mayer, 2014) and a bundle adjustment on every level (Mayer, 2014).
The obtained orientation is highly precise and very robust also for arbitrary image configurations. The approach does not need addi-tional information on position, e.g., by GPS, or viewing direction, e.g., by INS. Furthermore, no calibrated cameras are needed, so that almost any photogrammetric but also consumer camera can be used for image acquisition. The orientation is initialized with a mapping between the images and an approximate calibration matrix for each camera, which is given by
Kinit=
fx s xP
0 fy yP
0 0 1
!
(1)
relatively sparse, but dominant objects, such as buildings, trees or the ground, can readily be seen by manual inspection.
A dense 3D-point cloud is obtained after computing depth maps using semi-global matching (SGM) by (Hirschm¨uller, 2008) with census as matching cost (Hirschm¨uller and Scharstein, 2009). The dense 3D-point cloud is computed by fusing the depth maps and analysing the resulting 3D-points considering additional geo-metric constraints. The employed approach is scalable from small building scenes to large scenes of villages and cities (Kuhn et al., 2014, Kuhn and Mayer, 2015).
The 3D point cloud generation works fully automatically and we obtain point clouds with millions or even billions of 3D points, which can have a point spacing of less than1mm, if the cam-eras have a sufficient resolution. The dense point cloud still de-scribes a relative model without a meaningful scale, and the pose of the coordinate system is defined by the first camera analysed. A further normalization for the dense point cloud is performed manually at the moment.
2.2 Building Modelling
Our building modelling uses a coarse-to-fine approach, i.e., we first detect large building structures, such as major walls and roof surfaces, and only then we search for smaller building parts such as windows. I.e., we first derive building models with level of detail (LOD) 1 and 2, and then we refine these models afterwards by further analysis of each wall.
We start with segmenting the 3D point cloud into small disjunct planar surfaces, then we analyse the topologically adjacent sur-faces, if they fit to a predefined roof model. Previously, our scene segmentation was limited to cuboid buildings (Nguatem et al., 2012), but we have extended our approach significantly.
Similar to other methods, where larger scenes with several build-ings can be modelled, e.g., (Schnabel et al., 2007) or (Monszpart et al., 2015), we detect arbitrary planes in the entire reconstructed scene. To this end, we employ a divide-and-conquer approach, where we divide the scene into small disjunct patches. In each of these local neighbourhoods, we estimate the most dominant plane using RANSAC (Fischler and Bolles, 1981). Planes with similar normal vectors in adjacent neighbourhoods are merged to obtain reliable candidates for walls, roof planes and the ground surface.
In planar landscapes, the ground surface can easily be determined by selecting the largest plane perpendicular to the vertical direc-tion. When the ground plane is removed, the major building planes characterize the scene. We cluster these planes and fit a roof model for each cluster employing (Nguatem et al., 2013). We employ the GRIC-approach (Torr and Davidson, 2003) for our stochastic sampling to limit the influence of outliers. We make use of predefined roof shapes and we selected several typ-ical roof models of German buildings, e.g., pyramid roof, gable roof, or mansard roof. Since all these roof types have a small number of surfaces, we do not consider a punitive term for model complexity in our evaluation scheme, e.g., by considering mini-mum description length (Rissanen, 1978).
recognition and modelling of roof superstructures, such as dorm-ers and chimneys and other buildings parts like balconies, oriels and stairs. Again, the localization of windows is performed by stochastic evaluation (Nguatem et al., 2014) and we are able to fit the most common window styles in Germany: rectangular, arch-shaped and pointed arch-arch-shaped windows.
3. EXPERIMENTS
In this section, we present the results of our tool chain. We start with describing the results of orienting208images acquired by two cameras. Then we show and discuss the results for our dense point cloud. Finally, we present the results of the functional mod-elling, i.e., the surface plane estimation and the window extrac-tion.
3.1 Image Orientation
We acquired208images of a single building by two cameras:
70images were taken manually with a Nikon D800 with a fo-cal length of24mm, the other138images were acquired with a Sony ILCEα7R with a focal length of35mm mounted on a re-motely piloted Falcon 8 UAV. Both cameras capture images with
7 360×4 912pixels, i.e., each image contains more than36
mil-lion pixels (RGB).
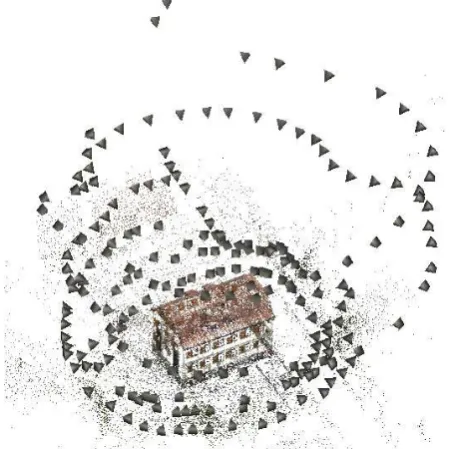
Figure 1. Orientation result of208images (presented as pyra-mids) showing a single building.
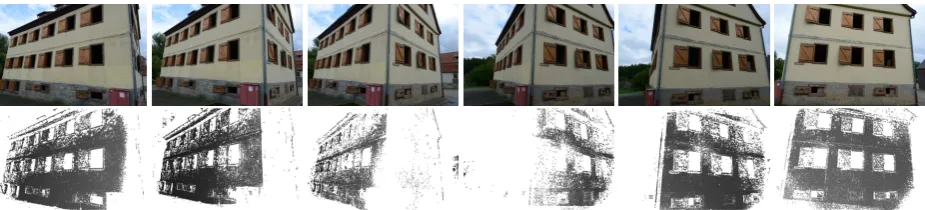
Figure 2. Six views on a building corner and the corresponding SGM outputs (depth maps). There are almost no commonly matched points between the third and the fourth image. But due to sufficiently many corresponding points between images 1 to 3, and 4 to 6, respectively, we are able to reconstruct dense building surfaces.
21minutes on a standard computer with16cores returning the estimations of43 3213D points and the orientation of all208
images, cf. Fig. 1. The result has an average re-projection error of0.45pixels. The returned calibration matrices are
KNikon=
for the Nikon and the Sony camera, respectively, i.e., our ini-tialization is a reasonable approximation. Recent experiments and a comparison with another VisualSFM approach (Wu, 2011, Wu, 2013) are presented in (Mayer, 2015, Michelini and Mayer, 2016).
3.2 SGM and Reconstruction of Dense 3D Point Clouds
SGM took1357minutes, i.e., almost23hours. The large com-putation time arises, because we derive one depth map for each image, containing the fused depth information of all pairwise im-age matches with SGM. The pairwise SGM was calculated on a field programmable gate array (FPGA) Virtex-6 board, the fusion to one depth map was calculated on the CPU. We also down-scaled the images by a factor of2, so that all depth maps have a resolution of3 680×2456pixels.
In our experiments, we used the original implementation of SGM by (Hirschm¨uller, 2008) with census matching cost (Hirschm¨uller and Scharstein, 2009). Although this implementation belongs to the best SGM implementations (high ratio between correctness and performance), we have difficulties in finding the correct cor-respondences on large weakly textured surfaces, in very bright or dark areas, and when looking on the surface at an angle to the normal vector of more than45degrees, cf. Fig. 2. We could not estimate any depth information for all white pixels in the SGM output images.
In the next step, the depth maps for the individual images are fused to obtain a 3D point cloud. The fusion process analyses the data concerning geometric plausibility, so we obtain a point cloud with almost no outliers. Since the approach of (Kuhn et al., 2013) and (Kuhn et al., 2014) divides the scene into smaller parts using an octree, its depth is correlated with the size of the model and the positional accuracy of the individual 3D points.
Due to the large number of pixels, we would obtain extremely many 3D points, if we would reconstruct the scene with the high-est available resolution. In consequence, the 3D models would consist of billions of triangles, and we are not able to visualize it on standard computers.
The 3D model shown in Fig. 3 consists of25 687 0523D points and50 686 350triangles for the entire scene of the building and its surrounding. The reconstruction was computed in approxi-mately14hours, again on the standard PC with16cores. The density of the 3D model is higher than one point per cm3. E.g., the handrail of the stairs is clearly visible. The texture of the mesh could be improved, since the sign left of the door is not readable in the model.
Further results for SGM and the fusion of depth maps into dense 3D point clouds can be found in recently published papers, e.g., (Kuhn et al., 2014) and (Mayer, 2015).
3.3 Functional Modelling
So far, we only presented results of our workflow to demonstrate the generation of our input data, when we derive 3D models from imagery. Nevertheless, our approach for functional modelling is also suitable for LiDAR point clouds which usually have less noise, less outliers and coplanar LiDAR-points appear in a reg-ular grid. Furthermore, the 3D models derived from imagery are relative models, i.e., the point cloud does not have a normalized scale, and we do not know the vertical direction of the scene. Consequently, we manually normalize each 3D model.
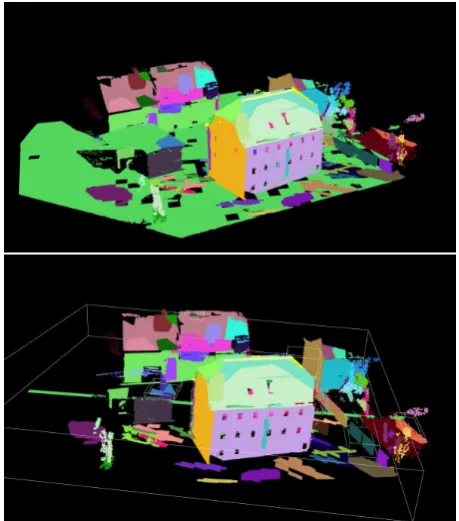
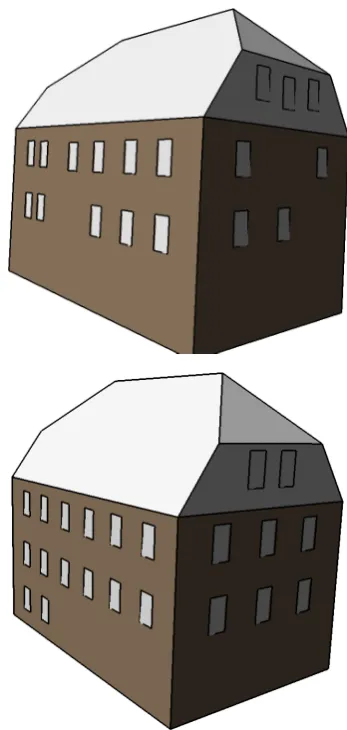
In the first step of functional modelling, we detect all major pla-nar surfaces of the scene, cf. Fig. 4. The largest plane, which is nearly perpendicular to the vertical direction in non-mountain areas, is usually the ground surface of the scene. The rest of the planes is clustered to obtain candidates for building parts and other objects. With these planes, secondly, we can derive building models following (Nguatem et al., 2013). Our output shows all major walls and the half-hipped roof planes, cf. Fig. 5. Cutting off the surfaces on the roof, we also can derive the corresponding LOD 1 from the LOD 2 model. The LOD 2 model was derived in less than two minutes.
Figure 3. Reconstructed dense point cloud with surface mesh containing more than25million 3D points and more than50 mil-lion triangles. This result is not the highest resolution we can obtain, but we are still able to visualise this model. The lower part shows a close view, where details as the sign left of the door or the handrails of the stairs can be recognized.
Regarding our test example, we could localize all typical40 win-dows, cf. Fig. 6. The small windows in the cellar, the closed windows and the windows within the dormers are missing. The derivation of the LOD 3 model with windows was done within one minute.
Further results of the derivation of building models with LOD 1, 2 and 3 can be found in the previous publications (Nguatem et al., 2012), (Nguatem et al., 2013) and (Nguatem et al., 2014). There we also show results of various roof types and window styles which are common for buildings in Germany, e.g., pyramid roof, gable roof and mansard roof, or round arch-shaped and pointed arch-shaped windows.
In this paper, we restrict to only one example with a half-hipped roof and with normal-sized windows, because we want to present our workflow with as many details as possible. Currently, we also test our workflow on publicly available data sets, e.g., the ISPRS benchmark for dense image matching (Nex et al., 2015). Yet, as the roof structures of the buildings of this data set are complex, we see a need for extending our roof modelling towards arbitrary roof structures, cf., e.g., (Xiong et al., 2014).
3.4 Export to CityGML
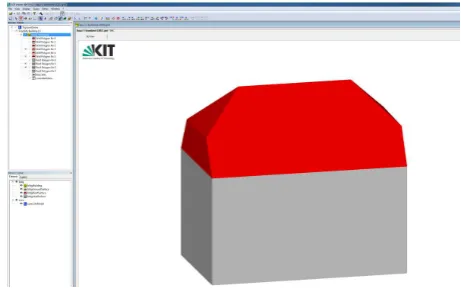
In the last step of our workflow, we export the derived building model to CityGML. We are able import our output in the free CityGML viewer by the Institute of Applied Computer Science
Figure 4. Segmented planes of the test scene with a building with its surrounding.
of Karlsruhe Institute of Technology, the FZKViewer. So far, we have only finished the export of LOD 2 models, cf. Fig. 7.
The export is also done within a few seconds, so the total time consumed for automatic derivation of the building model from
208images is37.5hours, but most of the time has been used for SGM and 3D reconstruction.
4. CONCLUSION AND OUTLOOK
In this paper, we have described an approach for automatic gen-eration of dense 3D point clouds from unsorted image sets and the automatic derivation of building models with levels of detail (LOD) 1 to 3. The modelling of buildings is based on segmenting the 3D point cloud into planes. Then we fit roof models and win-dow models into the data employing the stochastic approaches (Nguatem et al., 2013, Nguatem et al., 2014).
Our approach can easily be extended to other appearances of building parts, e.g., half-spherical and cone-shaped roofs or cir-cular windows. To this end, we have to update the data base for defined roof or window models.
Figure 5. LOD 2 building model. Surfaces of roof model and 3D points in the same view with the model supporting points in yellow and others in green (top), and wireframe model of the same building (below).
REFERENCES
Becker, S. and Haala, N., 2008. Integrated LIDAR and Image Processing for the Modelling of Building Facades. Photogrammetrie–Fernerkundung–Geoinformation 2008(2), pp. 65–81.
Fischler, M. and Bolles, R., 1981. Random Sample Consensus: A Paradigm for Model Fitting with Applications to Image Anal-ysis and Automated Cartography. Communications of the ACM 24(6), pp. 381–395.
Gr¨oger, G., Kolbe, T., Nagel, C. and H¨afele, K.-H. (Eds.), 2012. OGC City Geography Markup Language (CityGML) Encoding Standard. OGC 12-019.
Hirschm¨uller, H., 2008. Stereo Processing by Semi-Global Matching and Mutual Information. IEEE Transactions on Pat-tern Analysis and Machine Intelligence 30(2), pp. 328–341.
Hirschm¨uller, H. and Scharstein, D., 2009. Evaluation of Stereo Matching Costs on Images with Radiometric Differences. IEEE Transactions on Pattern Analysis and Machine Intelligence 31(9), pp. 1582–1599.
Figure 6. LOD 3 model with extracted windows.
Huang, H. and Mayer, H., 2015. Robust and Efficient Urban Scene Classification Using Relative Features. In: 23rd SIGSPA-TIAL International Conference on Advances in Geographic In-formation Systems, GIS ’15, ACM, pp. 81:1–81:4.
KIT, Institute of Applied Computer Science, Karlsruhe Institute for Technology, 2015. FZKViewer 4.5 x64 (Build 853).
Kluckner, S. and Bischof, H., 2010. Image-Based Building Clas-sification and 3D Modeling with Super-Pixels. In: ISPRS Tech-nical Commission III Symposium, ISPRS Archives of the Pho-togrammetry, Remote Sensing and Spatial Information Sciences, Vol. (38) 3A, pp. 233–238.
Kuhn, A. and Mayer, H., 2015. Incremental Division of Very Large Point Clouds for Scalable 3D Surface Reconstruction. In: Proceedings of the IEEE International Conference on Com-puter Vision (ICCV), IEEE/ISPRS 3rd Joint Workshop on Multi-Sensor Fusion for Dynamic Scene Understanding.
Kuhn, A., Hirschm¨uller, H. and Mayer, H., 2013. Multi-Resolution Range Data Fusion for Multi-View Stereo Recon-struction. In: Weickert, J., Hein, M. and Schiele, B. (Eds.): Pattern Recognition (GCPR) 2013, Lecture Notes in Computer Science, Vol. 8142, pp. 41–50.
Figure 7. Model coded in CityGML as viewed by FZKViewer (KIT, 2015).
Scene Classification. In: XXIII ISPRS Congress, ISPRS Annals of the Photogrammetry, Remote Sensing and Spatial Information Sciences, Vol. III-3, accepted.
Kuhn, A., Mayer, H., Hirschm¨uller, H. and Scharstein, D., 2014. A TV Prior for High-Quality Local Multi-View Stereo Recon-struction. In: Proceedings of 2nd International Conference on 3D Vision, pp. 65–72.
Lafarge, F. and Mallet, C., 2012. Creating Large-Scale City Mod-els from 3D-Point Clouds: A Robust Approach with Hybrid Rep-resentation. International Journal of Computer Vision 99, pp. 69– 85.
Lowe, D., 2004. Distinctive Image Features from Scale-Invariant Keypoints. International Journal of Computer Vision 60(2), pp. 91–110.
Martinovic, A. and Van Gool, L., 2014. Hierarchical Co-Segmentation of Building Facades. In: Proceedings of 2nd In-ternational Conference on 3D Vision, pp. 409–416.
Mayer, H., 2014. Efficient Hierarchical Triplet Merging for Cam-era Pose Estimation. In: Xiang, J., Hornegger, J. and Koch, R. (Eds.): Pattern Recognition (GCPR) 2013, Lecture Notes in Computer Science, Vol. 8753, pp. 399–409.
Mayer, H., 2015. From Orientation to Fuctional Modeling for Terrestrial and UAV Images. In: Fritsch, D. (Ed.), Photogram-metric Week ’15, Wichmann/VDE-Verlag, pp. 165–174.
Mayer, H., Bartelsen, J., Hirschm¨uller, H. and Kuhn, A., 2012. Dense 3D Reconstruction from Wide Baseline Image Sets. In: Outdoor and Large-Scale Real-World Scene Analysis. 15th In-ternational Workshop on Theoretical Foundations of Computer Vision, Lecture Notes in Computer Science, Vol. 7474, pp. 285– 304.
Michelini, M. and Mayer, H., 2014. Detection of Critical Cam-era Configurations for Structure from Motion. In: European Calibration and Orientation Workshop (EuroCOW) 2014, ISPRS Archives of the Photogrammetry, Remote Sensing and Spatial In-formation Sciences, Vol. XL-3/W1, pp. 73–78.
Michelini, M. and Mayer, H., 2016. Efficient Wide Baseline Structure from Motion. In: XXIII ISPRS Congress, ISPRS An-nals of the Photogrammetry, Remote Sensing and Spatial Infor-mation Sciences, Vol. III-3, accepted.
Nguatem, W., Drauschke, M. and Mayer, H., 2012. Finding Cuboid-Based Building Models in Point Clouds. In: XX II IS-PRS Congress, ISIS-PRS Archives of the Photogrammetry, Remote Sensing and Spatial Information Sciences, pp. 149–154.
Nguatem, W., Drauschke, M. and Mayer, H., 2013. Roof Re-construction from Point Clouds using Importance Sampling. In: City Models, Roads and Traffic 2013 (CMRT13), ISPRS Annals of the Photogrammetry, Remote Sensing and Spatial Information Sciences, Vol. II-3/W3, pp. 73–78.
Nguatem, W., Drauschke, M. and Mayer, H., 2014. Localization of Windows and Doors in 3D Point Clouds of Facades. In: IS-PRS Technical Commission III Symposium, ISIS-PRS Annals of the Photogrammetry, Remote Sensing and Spatial Information Sci-ences, Vol. II-3, pp. 87–94.
Rissanen, J., 1978. Modeling by Shortest Data Description. Au-tomatica 14, pp. 465–471.
Schmitz, M. and Mayer, H., 2016. A Convolutional Network for Semantic Facade Segmentation and Interpretation. In: XXIII ISPRS Congress, ISPRS Archives of the Photogrammetry, Re-mote Sensing and Spatial Information Sciences, Vol. XLI-B3, ac-cepted.
Schnabel, R., Wahl, R. and Klein, R., 2007. Efficient RANSAC for Point-Cloud Shape Detection. Computer Graphics Forum 26(2), pp. 214–226.
Teboul, O., Kokkinos, I., Simon, L., Koutsourakis, P. and Para-gios, N., 2013. Parsing Facades with Shape Grammars and Rein-forcement Learning. IEEE Transactions on Pattern Analysis and Machine Intelligence 35(7), pp. 1744–1756.
Torr, P. and Davidson, C., 2003. IMPSAC: Synthesis of Impor-tance Sampling and Random Sample Consensus. IEEE Trans-actions on Pattern Analysis and Machine Intelligence 25(3), pp. 354–364.
Verdie, Y., Lafarge, F. and Alliez, P., 2015. LOD Generation for Urban Scenes. ACM Transactions on Graphics 34(3), pp. 30:1– 30:14.
Wenzel, S. and F¨orstner, W., 2016. Facade Interpretation Using a Marked Point Process. In: XXIII ISPRS Congresss, ISPRS Annals of the Photogrammetry, Remote Sensing and Spatial In-formation Sciences, Vol. III-3, accepted.
Wu, C., 2011. VisualSFM: A Visual Structure from Motion Sys-tem. ccwu.me/vsfm/.
Wu, C., 2013. Towards Linear-time Incremental Structure from Motion. In: Proceedings of 1st International Conference on 3D Vision, pp. 127–134.