Nitrogen use efficiency of taro and sweet potato in the
humid lowlands of Papua New Guinea
Alfred E. Hartemink
a,∗, M. Johnston
b, J.N. O’Sullivan
c, S. Poloma
daISRIC, P.O. Box 353, 6700 AJ, Wageningen, The Netherlands bJames Cook University, Townsville Q4811, Australia
cThe University of Queensland, Department of Agriculture, Brisbane Qld 4072, Australia dUniversity of Technology, Department of Agriculture, PMB, Lae, Papua New Guinea
Received 31 May 1999; received in revised form 15 November 1999; accepted 2 February 2000
Abstract
Root crops are an important staple food in the Pacific region. Yields are generally low and inorganic fertilizers are deemed an option to increase root crop production. The effects of inorganic N fertilizers on upland taro (Colocasia esculenta (L.) Schott) and sweet potato (Ipomoea batatas (L.) Lam.) were quantified with the aim to investigate relationships between inherent soil fertility, N uptake, N application rates and crop yield. The research took place on a sandy, Typic Tropofluvents in the humid lowlands of Papua New Guinea. Five levels of fertilizer N (0,100, 200, 300 and 400 kg ha−1) were given in
split applications. The yield of marketable taro corms was not affected by N fertilizer but non-marketable corm yield doubled at high N fertilizer rates. High N applications yielded 8–11 Mg ha−1more taro tops. Marketable and non-marketable sweet
potato yield was negatively affected by N fertilizers. High N applications yielded 26 Mg ha−1 more vines than the control
treatment. Nitrogen fertilizer significantly reduced the harvest index in both crops. When no fertilizer was applied, the total N uptake of taro was 32.0 kg ha−1of which 9.7 kg was taken up in the marketable corms. At 400 kg N ha−1the total N uptake
was 67.5 kg ha−1of which 23% was taken up by the marketable corms. Uptake of N in the marketable sweet potato tubers was
less than 11 kg ha−1and for most treatments more N was taken up in the non-marketable tubers than in the marketable yield.
Up to 156 kg N ha−1was taken up with the sweet potato vines. Despite the negative effect of N on sweet potato yield, sweet
potato had a higher N use efficiency than taro due to a higher above-ground biomass production. The N fertilizer recovery was 25% for the sweet potato but only 9% for the taro indicating considerable N losses, likely caused by leaching. © 2000 Elsevier Science B.V. All rights reserved.
Keywords: Root crops; Inorganic nitrogen fertilizer; Fertilizer recovery; Nitrogen uptake
∗Corresponding author. Tel.:+31-317-471-711;
fax:+31-317-471-700.
E-mail address: [email protected] (A.E. Hartemink)
1. Introduction
Nitrogen is the element most frequently deficient in tropical soils (Sanchez, 1976). It is the only plant nutrient which can be added to the soil by biological fixation (BNF), but for many cropping systems in the tropics, addition of N through BNF is insufficient to
cover the loss of N with crop removal and leaching and denitrification (Giller and Cadisch, 1995; Boddey et al., 1997). Application of N from organic and inor-ganic sources is essential to sustain and improve crop yield in continuous cultivation systems.
Root crops are an important staple food throughout the Pacific region (Parkinson, 1984) and de la Peña (1996) estimated that the area under sweet potato in
Oceania was about 120×103ha, and 47×103ha for
taro. Average yields in Oceania are about 4.8 Mg ha−1
for sweet potato and 7.0 Mg ha−1 for taro. Total
production of these crops increased considerably between the 1960s and 1990s, but the increase did not keep up with the population growth (de la Peña, 1996). Improved production systems are, therefore, required and an important option to increase sweet potato and taro yields is through the use of inorganic fertilizers (de la Peña and Plucknett, 1972; Blamey, 1996) as yields decline under continuous cultivation (Hartemink et al., 2000).
There is fair a body of literature on the use of inor-ganic fertilizers on taro and sweet potato although the information is limited compared to other staple crops. Both taro and sweet potato consume considerable amounts of potassium and responses to K fertilizers are generally recorded (de Geus, 1973; O’Sullivan et al., 1996). In many tropical soils taro and sweet potato yields may be increased using inorganic N fertilizers. Judicious use of inorganic N fertilizers is, however, essential to avoid off-site effects and environmental contamination and to increase farm profitability.
Taro has relatively high N requirements particu-larly during its early growth stages (Manrique, 1994). Nitrogen applications for optimum taro yields are
30–60 kg N ha−1 in the Philippines (Pardales et al.,
1982; Villanueva et al., 1983), around 100 kg N ha−1
in India (Das and Sethumadhavan, 1980; Ashokan
and Nair, 1984) and up to 560 kg N ha−1 in Hawaii
(de la Peña and Plucknett, 1972). Manrique (1994) reviewed the literature on N requirements of taro
and concluded that 100–120 kg N ha−1is required to
attain 95% of the maximum yield.
Sweet potato has high N requirements but can pro-duce reasonable yields in soils of poor fertility (Hill et al., 1990). This may be partly caused by its capacity to fix atmospheric N through association with symbi-otic, non-nodulating bacteria. Recent estimates have shown that as much as 40% of the N uptake of sweet
potato may be derived from di-nitrogen (Yoneyama et al., 1998), although cultivar differences are large. A very wide range of N fertilizer requirements has been reported for sweet potato (Hill, 1984) but much de-pends on the cultivar, soil type and climatic conditions (O’Sullivan et al., 1997).
In most N fertilizer trials with taro and sweet potato, yield is plotted as a function of the amount of N ap-plied which often reveals variable results. It makes in-terpretation of experiments difficult because it is not known how much fertilizer applied to the soil is taken up by the crop and how much is utilized by the storage roots i.e. the marketable product (van Keulen, 1986). Chemical analysis of the harvested material facilitates the interpretation of fertilizer experiments (van Keulen and van Heemst, 1982). It allows a detailed investiga-tion of the efficiency of the N applied in relainvestiga-tion to the amount of N taken up from the soil under unfertilized conditions.
This paper presents an analysis of N use efficiency for taro and sweet potato grown on a sandy soil in the humid lowlands of Papua New Guinea. The relation-ship between inherent soil fertility, N applications, N uptake and crop yield is investigated with the help of the three-quadrant procedure, which was introduced by de Wit in the 1950s (de Wit, 1953) and applied by several others (e.g. Janssen and Wienk, 1990). The procedure has been mostly used to study nutrient use efficiency by grain crops but has, to our knowledge, not been applied for taro and sweet potato. Taro and sweet potato are important staple crops in the humid lowlands of Papua New Guinea and are grown in shift-ing cultivation systems. Taro is commonly the first crop planted after the fallow vegetation is slashed and is followed by one or two crops of sweet potato before the land is reverted to fallow again.
2. Materials and methods
2.1. The site
The research took place during 1996 and 1997 on the experimental farm of the University of Technol-ogy in Lae in the Morobe Province of Papua New
Guinea. The farm (6◦41′S, 146◦98′E) is located at
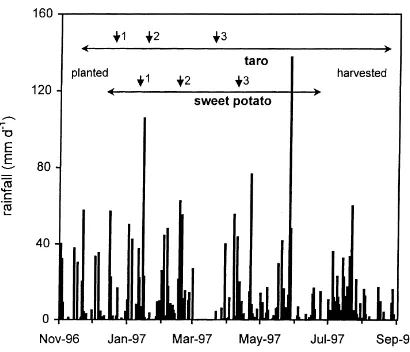
Fig. 1. Daily rainfall (mm) during the experimental period. Vertical arrows indicate timing of N applications.
throughout the year. Average daily temperature is
26.3◦C, with an average minimum of 22.9◦C and
an average daily maximum of 29.7◦C. Annual
evap-oration (US Class A pan) is 2139 mm, and rainfall exceeds evaporation in each month. The climate is classified as Af (Köppen) i.e. a tropical rainy cli-mate with over 60 mm rain in the driest month. During the experimental period 2270 mm of rain was recorded for the taro and 1538 mm for the sweet potato (Fig. 1). An exceptional dry spell occurred in March 1997 in which there was no rainfall for almost 4 weeks.
The soil at the experimental farm is well drained and derived from alluvial deposits. It is classified as a sandy, mixed, isohyperthermic, Typic Tropofluvents (USDA Soil Taxonomy), or Eutric Fluvisol (World Reference Base). Some soil chemical and physical properties of a soil profile at the experimental site are given in Table 1. Airdried soil samples were ground and sieved (2 mm) and analyzed at the National Analytical Chemistry Laboratories in Port Moresby. The procedures for soil analysis were as follows:
pH H2O (1:5 w/v); organic C and total N by Leco
CNS-2000 dry combustion; available P by Olsen;
ex-changeable cations and CEC by 1 M NH4OAc
perco-lation (pH 7.0); particle size analysis by hydrometer (Sparks, 1996). The soils are moderately acid with moderate amounts of exchangeable K and available P but with low levels of total N.
2.2. Experimental set-up and management
The experiment was conducted with taro (Colo-casia esculenta (L.) Schott) local cultivar Nomkoi, and sweet potato (Ipomoea batatas (L.) Lam.) culti-var Markham. The experimental design consisted of
a replicated (n=4) randomized complete block design
with five levels of N (0, 100, 200, 300, 400 kg ha−1)
applied as sulphate of ammonia. The N applications were broadcast over the plots and split into three equal applications given at 35, 62 and 120 DAP (days after planting) for the taro and at 30, 62 and 119 DAP for the sweet potato (see Fig. 1). Split applications of N fer-tilizer give generally higher yields in taro (de la Peña and Plucknett, 1972; Mohankumar et al., 1990) and sweet potato (Mukhopadhyay et al., 1992). In
addi-tion, 100 kg P ha−1(triplesuperphosphate) was given
at planting and 250 kg K ha−1(muriate of potash) was
given at 30 DAP for both the taro and sweet potato. The P and K fertilizers were also broadcasted which is commonly recommended for taro and sweet potato (de Geus, 1973).
Taro was planted at a spacing of 0.5 by 0.8 m
(25,000 plants ha−1) in plots of 4.0 m by 3.2 m.
Planting material consisted of corm apical portions taken from main plants from which the petioles had been cut 0.25–0.30 m above the corm removing the leaf laminae. The taro was planted on 12-11-1996 and harvested at 25-8-1997 (286 DAP). In the taro plots biocides were used to control hawkmoth (Hip-potion celerio L.) and taro leaf blight (Phytophtera colocasiae). Sweet potato was planted at a
spac-ing of 0.4 m×0.8 m (31,250 plants ha−1) in plots of
4.0 m×3.2 m. Planting material consisted of 0.30 m
vines with three to four nodes, and vines were planted at about 0.1 m depth. Planting date was 10-12-1996 and the sweet potato was harvested at 10-6-1997 (182 DAP). The taro and sweet potato plots were weeded manually at regular intervals as weeds may greatly affect the yield in root crops (Gurnah, 1985). Weeds were not removed from the plots to avoid nutrient removal. No mounds or ridges were constructed for the taro and sweet potato which is in accordance with normal farmers’ practises in the area.
At harvest, taro main plants and suckers were separated and counted. For both main plants and suckers, the number of marketable corms (>100 g),
above-ground biomass) were weighed. Three to five marketable and non-marketable corms were taken of each plot for dry matter determination and nutrient analysis. At harvest, sweet potato marketable tubers
(>100 g), non-marketable tubers (<100 g) and vines
were weighed. About 1 kg of vines per plot and three to five tubers were taken for dry matter determina-tion and nutrient analysis. All plant samples were thoroughly rinsed with tapwater followed by distilled
water whereafter they were dried for 72 h at 65◦C in
a forced air oven.
Plant samples were analyzed for nutrient content at the laboratories of the School of Land and Food of the University of Queensland. One subsample was digested in 5:1 nitric:perchloric acids and analyzed for P, K, Ca, Mg, S, B, Mn, Zn and Cu using ICP AES (Spectro Model P). A second subsample was digested according to the Kjeldahl procedure and analyzed for N on an Alpkem Rapid Flow Analyser Series 300.
2.3. Data analysis
Analysis of variance was conducted on marketable, non-marketable yield and above-ground biomass for both taro and sweet potato using Statistix 2.0 for Win-dows software. Standard error of the difference in means was calculated for each harvested portion and the nutrient uptake. For the yield data, the harvest index was calculated as marketable yield/(total tuber
yield+above-ground biomass) based on dry matter.
Nitrogen uptake (in kg ha−1) was calculated as the
N content (in g kg−1) multiplied with the yield (in
Mg ha−1).
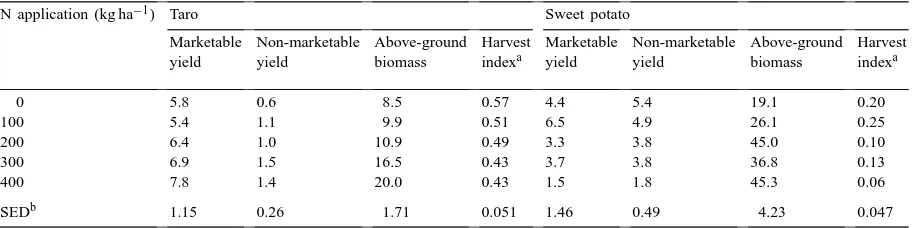
Table 2
Taro and sweet potato yield (Mg ha−1, fresh weight) at different N fertilizer rates
N application (kg ha−1) Taro Sweet potato
Marketable Non-marketable Above-ground Harvest Marketable Non-marketable Above-ground Harvest
yield yield biomass indexa yield yield biomass indexa
0 5.8 0.6 8.5 0.57 4.4 5.4 19.1 0.20
100 5.4 1.1 9.9 0.51 6.5 4.9 26.1 0.25
200 6.4 1.0 10.9 0.49 3.3 3.8 45.0 0.10
300 6.9 1.5 16.5 0.43 3.7 3.8 36.8 0.13
400 7.8 1.4 20.0 0.43 1.5 1.8 45.3 0.06
SEDb 1.15 0.26 1.71 0.051 1.46 0.49 4.23 0.047
aCalculated as: marketable tuber yield/(total tuber yield+above-ground biomass) based on dry matter. bStandard error of the difference in means (12 d.f.).
3. Results
3.1. Crop yield and nitrogen uptake
The yield of marketable taro corms was not af-fected by increased N applications and average yields
were below 8 Mg ha−1 (Table 2). The application of
N increased, however, the yield of non-marketable
corms by 0.5–0.9 Mg ha−1. Above-ground biomass
(tops) was not significantly increased up to 200 kg
N ha−1but higher applications yielded 8–11 Mg ha−1
more taro tops. As N rates increased, taro yield and biomass increased but the harvest index decreased (Table 2).
Marketable sweet potato yield was highest at 100
kg N ha−1 and lowest at 400 kg N ha−1 (Table 2).
Non-marketable yield significantly decreased with increased N applications and the control treatment yielded about three times more non-marketable
tu-bers compared to the 400 kg N ha−1 treatment.
Above-ground biomass was not significantly
in-creased up to 200 kg N ha−1, but higher applications
yielded two times more vines up to 45.3 Mg ha−1.
Sweet potato had a lower harvest index than taro, but the harvest index was significantly reduced to less than 10% with increased N fertilizer rates.
Table 3
Correlation coefficients between N fertilizer and yield components of taro and sweet potato
N fertilizer Marketable yield Non-marketable yield Above-ground biomass
Taro Marketable yield 0.42∗
Non-marketable yield 0.63** 0.22
Above-ground biomass 0.74*** 0.78*** 0.51*
Harvest index −0.65** −0.31 −0.52** −0.78***
Sweet potato Marketable yield −0.51∗
Non-marketable yield −0.85*** 0.62**
Above-ground biomass 0.76*** −0.46* −0.62**
Harvest index −0.64** 0.91*** 0.59** −0.70***
∗,∗∗,∗∗∗indicates significant linear correlation at p
<0.05, p<0.01 and p<0.001, respectively.
When no fertilizer was applied, total N uptake of
taro at harvest was 32.0 kg ha−1 of which 30% was
taken up in the marketable corms (Table 4). At 400 kg
N ha−1 the total N uptake by taro was 68 kg ha−1of
which 23% was found in the marketable corms. Most of the N was taken up by the taro tops and relatively little N in the non-marketable corms. Uptake of N in
the marketable sweet potato was less than 11 kg ha−1,
and more N was taken up in the non-marketable tubers than in the marketable sweet potato yield. Up to 156 kg
N ha−1 was taken up by the vines which was more
than 90% of the total N taken up by the sweet potato (Table 4).
Per 10 Mg ha−1of fresh marketable corms taro
re-moved between 5.0 and 6.8 kg N ha−1. These values
are much lower as reported in the literature (e.g.
Man-rique, 1995). Sweet potato removed per 10 Mg ha−1
marketable tubers between 13 and 31 kg N ha−1.
O’Sullivan et al. (1997) reported N removal of sweet
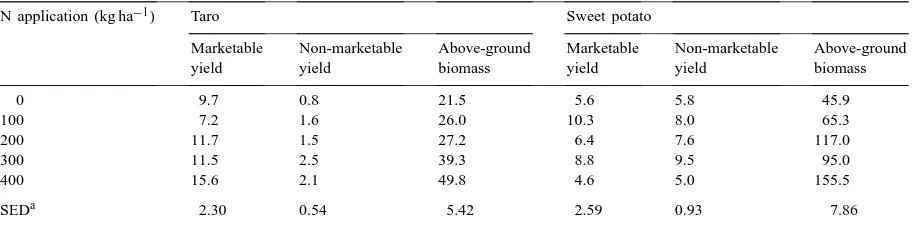
Table 4
Nitrogen uptake (kg ha−1) at harvest of taro and sweet potato at different N fertilizer rates
N application (kg ha−1) Taro Sweet potato
Marketable Non-marketable Above-ground Marketable Non-marketable Above-ground
yield yield biomass yield yield biomass
0 9.7 0.8 21.5 5.6 5.8 45.9
100 7.2 1.6 26.0 10.3 8.0 65.3
200 11.7 1.5 27.2 6.4 7.6 117.0
300 11.5 2.5 39.3 8.8 9.5 95.0
400 15.6 2.1 49.8 4.6 5.0 155.5
SEDa 2.30 0.54 5.42 2.59 0.93 7.86
aStandard error of the difference in means (12 d.f.).
potato tubers to be about 22 kg ha−1 per 10 Mg
tubers ha−1.
3.2. Nitrogen use efficiency
The relationship between inherent soil fertility, N fertilizer rates and yield was investigated with the help of the three-quadrant procedure. With this procedure, fertilizer application and yield relations (quadrant II) are split up into the relationships between N fertilizer rates and N uptake (quadrant IV in Fig. 2), and be-tween N uptake and yield (quadrant I in Fig. 2). These relations have been plotted for the marketable yield of taro and sweet potato (left diagram in Fig. 2) and for the total biomass including non-marketable yield and above-ground biomass (right diagram in Fig. 2).
Fig. 2. Three-quadrant diagram linking N application, N uptake and marketable yield (left diagram) and total fresh biomass yield (right diagram); I. Yield against uptake (Nitrogen Use Efficiency), II. Yield against N rate (Fertilizer Use Efficiency), IV. N uptake against N application rate (Fertilizer Recovery).
sweet potato marketable yield responded negatively to N application whereas the total biomass shows a
plateau at 200 kg N ha−1.
Quadrant I in the left diagram of Fig. 2 shows the N use efficiency (NUE) i.e. kg marketable yield per kg N taken up. Nitrogen use efficiency increases with in-creased N application for both taro and sweet potato. The NUE is about 600 kg marketable tubers per kg N taken up for sweet potato, and about 300 marketable corms per kg N taken up for taro. Nitrogen use effi-ciency of the total biomass was, however, larger for
taro (≈400 kg biomass kg−1N) than for sweet potato
(≈300 kg biomass kg−1 N). As the figure shows, this
is due to a decrease in N uptake of the sweet potato
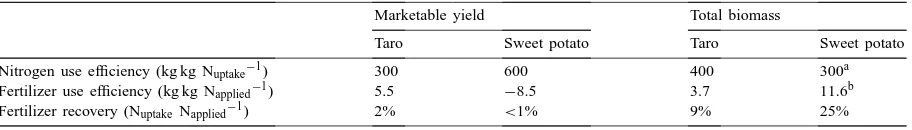
Table 5
Efficiency ratios of marketable yield and total biomass yield for taro and sweet potato (data from Fig. 2)
Marketable yield Total biomass
Taro Sweet potato Taro Sweet potato
Nitrogen use efficiency (kg kg Nuptake−1) 300 600 400 300a
Fertilizer use efficiency (kg kg Napplied−1) 5.5 −8.5 3.7 11.6b
Fertilizer recovery (NuptakeNapplied−1) 2% <1% 9% 25%
aOnly linear part of the curve taken i.e. up to 300 kg N ha−1. bi.d. up to 200 kg N ha−1.
with increasing N applications. The initial slope of the lines (i.e. up to 60 kg N taken up) is the same for both root crops. It indicates that under the given growing conditions the same amount of N is needed to produce 1 Mg of taro or sweet potato biomass.
From the relation between N uptake and N fertilizer application, the N recovery can be calculated (quad-rant IV). There was a low N fertilizer recovery for the marketable yield of taro. Sweet potato showed an irregular N fertilizer recovery pattern. The amounts of N taken up from the soil in the marketable
por-tion when no fertilizer was applied were 9.7 kg ha−1
for taro and 5.6 kg ha−1 for sweet potato. The total
no N fertilizer was applied was 32.5 kg ha−1for taro
and 57.3 kg ha−1 for sweet potato. Hence, it appears
that sweet potato makes better use of the native soil N than the taro. The recovery fraction which is the slope of the line in quadrant IV, was 9% for taro and 25% for the total fresh biomass of the sweet potato. Table 5 presents the calculated efficiency ratios from Fig. 2.
4. Discussion
Marketable taro corm yields were below 8 Mg ha−1
which are low yields but not exceptionally low. Moles et al., (1984) conducted a series of fertilizer experi-ments at rich volcanic soils in the Papua New Guinea province of East New Britain and obtained taro corm
yields between 1 and 18 Mg ha−1. Taro yields on a
high base status Inceptisol close to the University of Technology were slightly higher than reported in this experiment (Hartemink, unpubl. data). Marketable
sweet potato yields were below 7 Mg ha−1which are
low yields for Papua New Guinea (Bourke, 1985b). This may be partly due to the Markham cultivar which is known to give inconsistent tubers yields (P. van Wijmeersch, DAL-Keravat, pers. commun., 1998). Both taro and sweet potato yields are within the average yield range reported for the Pacific (de la Peña, 1996).
The soil at the experimental site was moderately fertile but contained low amounts of total N and yield increases were, therefore, expected. Nitrogen fertil-izer only increased marketable taro yield but decreased marketable sweet potato yield. Apparently, taro is less sensitive to high N whereas high N rates on sweet potato results in more vinebiomass production at the cost of tubers (Bourke, 1985a; Hill and Bacon, 1984). Yield decline at higher N levels are possibly due to inadequate supply of other nutrients or an imbalance brought about by high levels of N fertilizer (de la Peña and Plucknett, 1972).
The efficiency by which the applied N was used (NUE) was low and fertilizer recovery was only 10% for taro and 25% for sweet potato. Since nutrients in the fibrous roots were not measured in the total plant uptake, the actual NUE and fertilizer recovery is higher (Janssen, 1998). Hartemink and Johnston (1998) found that fibrous roots account for 5 and 11% of the total N
uptake of fertilized and unfertilized taro, respectively. Taking these figures in account for the taro, total NUE would only increase with 1%. The low N fertilizer re-covery could be due to other nutrients limiting growth, the loss of N through leaching, the genetic poten-tial of the cultivars used, or the unfavourable weather conditions.
Since N rarely accumulates in the soil, the dif-ference between N applied and N taken up by the biomass is probably lost. For taro the losses are on average more than 90% of the N applied whereas about 75% of the N applied to the sweet potato was lost. Although the N was given in split applications, considerable amounts of N may have been lost by leaching which is likely as rainfall is high and the soils are coarse textured. Within 1 week after the first N application on sweet potato, 181 mm rain fell and this may have leached the first N fertilizer application. The amount of rain following N fertilizer applica-tion at the taro was much lower. Such high N losses have environmental implications causing off-site ef-fects including increased nitrate levels affecting water quality in ground water, streams, rivers and coastal environments. Although this problem is generally well recognised in agriculture of the temperate re-gions (Rodriguez-Barrueco, 1996), it has received little attention in tropical regions where the focus of attention has been predominantly on sustained and increased crop production and not so much on the environmental effects. The results also suggest that it is uneconomical to apply inorganic N fertilizers to taro and sweet potato on coarse textured soils in high rainfall environments.
5. Conclusions
inputs other than inorganic N fertilizer are required for substantial yield increases of taro and sweet potato in the humid lowlands of Papua New Guinea.
Acknowledgements
This work was funded through grants of the Re-search Committee of the University of Technology in Lae and ACIAR Project 9101 on Mineral Nutrient Dis-orders of Root Crops in the Pacific. Assistance of Dr F.P.C. Blamey and Ms J. Mercer of The University of Queensland is kindly acknowledged, and the authors thank Mr M. Maino and Mr G. Gwaidong of the Uni-versity of Technology in Lae for their help in running the experiments.
References
Ashokan, P.K., Nair, R.V., 1984. Response of taro (Colocasia
esculenta (L.) Schott) to nitrogen and potassium. J. Root Crops
10, 59–63.
Blamey, F.P.C., 1996. Correction of nutrient disorders of sweet potato and taro: Fertilizers and soil amendments. In: Craswell, E.T., Asher, C.J., O’Sullivan, J.N. (Eds.), Mineral nutrient disorders of root crops in the South Pacific. Australian Centre for International Agricultural Research, Canberra, pp. 91–95. Boddey, R.M., Sa, J.C.D., Alves, B.J.R., Urquiaga, S., 1997.
The contribution of biological nitrogen fixation for sustainable agricultural systems in the tropics. Soil Biol. Biochem. 29, 787–799.
Bourke, R.M., 1985a. Influence of nitrogen and potassium fertilizer on growth of sweet potato (Ipomoea batatas) in Papua New Guinea. Field Crops Res. 12, 363–375.
Bourke, R.M., 1985b. Sweet potato (Ipomoea batatas) production and research in Papua New Guinea. Papua New Guinea J. Agric. For. Fish. 33, 89–108.
Das, P.N.M., Sethumadhavan, P., 1980. Effect of NPK on corm yield, tuber yield and total yield of Colocasia. In: National Seminar On Tuber Crops Production. Tamil Nadu Agricultural University, Coimbatore, pp. 179–181.
de Geus, J.G., 1973. Fertilizer guide for the tropics and subtropics. Centre d’Etude de l’Azote, Zurich.
de la Peña, R.S., 1996. Root crops in the Pacific Region: their dietary, cultural and economic significance. In: Craswell, E.T., Asher, C.J., O’Sullivan, J.N. (Eds.), Mineral nutrient disorders of root crops in the South Pacific. Australian Centre for International Agricultural Research, Canberra, pp. 19–27. de la Peña, R.S., Plucknett, D.L., 1972. Effects of nitrogen
fertilization on the growth, composition and yield of upland and lowland taro (Colocasia esculenta). Exp. Agric. 8, 187–194. de Wit, C.T., 1953. A physical theory on placement of
fertilizers. Agricultural Research Report 59.4. Staatsdrukkerij, ’s-Gravenhage.
Giller, K.E., Cadisch, G., 1995. Future benefits from biological nitrogen fixation: an ecological approach to agriculture. Plant Soil 174, 255–277.
Gurnah, A.M., 1985. Effects of weed competition at different stages of growth on the yield of taro. Field Crops Res. 10, 283–289. Hartemink, A.E., Johnston, M., 1998. Root biomass and nutrient uptake of taro in the lowlands of Papua New Guinea. Trop. Agric. 75, 1–5.
Hartemink, A.E., Poloma, S., Maino, M., Powell, K.S., Egenae, J., O’Sullivan, J.N., 2000. Yield decline of sweet potato in the humid lowlands of Papua New Guinea. Agric. Ecosyst. Environ. 79, 259–269.
Hill, W.A., 1984. Effect of nitrogen nutrition on quality of three important root/tuber crops. In: Hauck, R.D. (Ed.), Nitrogen in crop production. ASA-CSSA-SSSA, Madison, pp. 627–641. Hill, W.A., Bacon, P., 1984. Fertilizer N use efficiency and
associative N2-fixation of sweet potato. In: 6th Symposium
International Society of Tropical Root Crops, CIP, Lima, pp. 535–542.
Hill, W.A., Dodo, H., Hahn, S.K., Mulongoy, K., Adeyeye, S.O., 1990. Sweet potato root and biomass production with and without nitrogen fertilization. Agron. J. 82, 1120–1122. Janssen, B.H., 1998. Efficient use of nutrients: an art of balancing.
Field Crops Res. 56, 197–201.
Janssen, B.H., Wienk, J.F. (Eds.), 1990. Mechanized annual cropping on low fertility acid soils in the humid tropics. Wageningen Agricultural University Papers. Veenman, Wageningen, pp. 90–95.
Manrique, L.A., 1994. Nitrogen requirements of taro. J. Plant Nutr. 17, 1429–1441.
Manrique, L.A., 1995. Taro, Production principles and practices. Manrique International Agrotech, Hawaii.
Mohankumar, C.R., Sadanandan, N., Saraswathy, P., 1990. Effect of levels of NPK and time of application of N and K on the yield of taro (Colocasia esculenta (L.) Schott). J. Root Crops 16, 33–38.
Moles, D.J., Rangai, S.S., Bourke, R.M., Kasamani, C.T., 1984. Fertilizer reponses of taro in Papua New Guinea. In: S. Chandra (Ed.), Edible Aroids. Clarendon Press, Oxford, pp. 64–71. Mukhopadhyay, S.K., Sen, H., Jana, P.K., 1992. Effect of potassium
on growth and yield of sweet potato. J. Root Crops 18, 10– 14.
O’Sullivan, J.N., Asher, C.J., Blamey, F.P.C., 1996. Diagnostic criteria for nutrient disorders of taro. In: E.T. Craswell, C.J. Asher and J.N. O’Sullivan (Eds.), Mineral nutrient disorders of root crops in the South Pacific. Australian Centre for International Agricultural Research, Canberra, pp. 83–90. O’Sullivan, J.N., Asher, C.J., Blamey, F.P.C., 1997. Nutrient
disorders of sweet potato. ACIAR Monograph No. 48, Canberra. Pardales, J.R., Villanueva, M.R., Cotejo, F.R., 1982. Performance of taro under lowland condition as affected by genotype, nutritional status and population density. Ann. Trop. Res. 4, 156–167.
Rodriguez-Barrueco, C. (Ed.), 1996. Fertilizers and Environment. Developments in Plant and Soil Sciences, Vol. 66. Kluwer, Dordrecht, 581 pp.
Sanchez, P.A., 1976. Properties and management of soils in the tropics. Wiley, New York.
Sparks, D.L. (Ed.), 1996. Methods Of Soil Analysis, Part 3. Chemical Methods. Soil Science Society of America, Madison, WI.
van Keulen, H., 1986. Crop yield and nutrient requirements. In: van Keulen, H., Wolf, J. (Eds.), Modelling of agricultural production: Weather, soils and crops. Pudoc, Wageningen.
van Keulen, H., van Heemst, H.D.J., 1982. Crop response to the supply of macronutrients. Agricultural Research Reports 916. Pudoc, Wageningen.
Villanueva, M.R., Pardales, J.R., Abenoja, E.A., 1983. Performance of taro in the uplands as affected by fertilizer application and population density under different production systems. Philippine J. Crop Sci. 8, 17–22.