GIS AWARENESS FOR SURVEYORS –
A SPATIAL DATA DISTRIBUTION PERSECTIVE
Jung-Hong Hong a, *, Hone-Jay Chu a
a Dept. of Geomatics, National Cheng-Kung University, Tainan, Taiwan – (junghong, honejay)@mail.ncku.edu.tw
KEY WORDS: surveyor, education, digitizing, geospatial data, metadata
ABSTRACT:
The rapid technological growth of GIS, internet and mobile devices has steered a variety of innovated and pioneering applications in the past few years. All of these applications require spatial data that meet specified criteria to ensure the quality of the service content. The traditional role for surveyors was to use surveying technology and instruments to determine the location of phenomena of interests and offer map products to serve as the basis for decision making. As the application demands becomes more variety and instantaneous, the role and responsibility for modern surveyors must be examined. Professional surveyors nowadays must have both the knowledge and skills to produce geospatial data that precisely meet the various application needs and correctly convey their understanding about data to domain users to avoid wrong decision making. This paper discussed how we include such considerations into our curriculum design at the Dept of Geomatics, NCKU. During their studies, students are expected to establish a correct understanding about the role and responsibility of surveyors and develop themselves to be “solution providers” for providing reliable geospatial data.
* Corresponding author.
1. INTRODUCTION
The rapid technological growth of GIS, internet and mobile devices has steered a variety of innovated and pioneering applications in the past few years. For example, even an inexperienced user can now easily access the electronic maps and satellite images of an unfamiliar place via internet-based service platforms like Google Earth or Bing Maps. As internet resources provide “free” information to unrestricted domains of users in such a convenient way, the education of geomatics, regardless what levels they are, have forever changed. Another interesting example is the overwhelming expansion of mobile telecommunication markets, especially the success of those technology based upon smart phones. By simply downloading an APP, we can use smart phones to easily acquire location information with built–in GPS chip and record other types of information with other built-in devices like camera, voice recorder or touchpad. For many applications, this is already sufficient to serve as a mobile device for collecting geospatial data, not to mention it can be also used in Location-Based Service (LBS), where service content from remote servers are retrieved based on the current location of users via internet connection. These technology innovations surely give a tremendous boost to the evolution of education in schools, as the use of data, software and hardware all become much more convenient and inexpensive than before. The most important breakthrough is that this impact is not restricted to professional people who dedicate to the theory, implementation and applications of geospatial technology, any people, any department, any organization who has the need of using geospatial data can all be benefited by the new technology.
Geospatial data is a common and essential component that needs to receive tremendous attention in the above innovated
applications because it has dominant influence on the use of the application. To produce geospatial data that precisely meet the application needs is always regarded as the responsibility and the first priority to surveyors. Surveyors are thus required to receive all kinds of professional training, such that they have sufficient professional knowledge to make a survey plan and ensure the criteria about the quality of the products can be met. A rather restricted viewpoint about the responsibility of surveyors is surveyors turn in the final products (e.g., maps) and leave the remaining works to the organizations that intend to use the data. In the current data sharing environment, this viewpoint is no longer valid because users nowadays can easily search “all” of the available geospatial data, regardless of what their original purpose is. Despite that datasets are still created according to specific purposes, there is no way to predict how it is going to be used. It becomes very risky if users cannot have a correct understanding about the data they access and use. From the perspective of data production, it is hence necessary to examine how surveyors cope with the vast varieties and fast growing of needs from the geospatial community. This paper discusses our viewpoint regarding the role and responsibility change of surveyors, and further uses the lab of the digitization of geospatial data as an example to demonstrate how this viewpoint is incorporated in our curriculum design. The remaining of this paper is organized as follows: section 2 offers a brief overview about the GIS education in the Dept. of Geoamtics at NCKU and our viewpoints about the links between surveyors and GIS-based applications. Section 3 uses the topics of digitizing and distribution of geospatial data in the GIS lab as an example to demonstrate our design approach. Finally, section 4 summarized our major findings. International Archives of the Photogrammetry, Remote Sensing and Spatial Information Sciences, Volume XXXVIII-6/W27, 2011
2. CORE OF CURRICULUM DESIGN
2.1 Brief history of the Dept. of Geomatics at NCKU
The Dept. of Geomatics at NCKU was formerly the Dept. of Surveying Engineering. Established in the year of 1978, Dept. of Surveying Engineering was dedicated to the education of professional surveyors. Students receive solid training from a variety of surveying courses, e.g., plane surveying, geodesy, photogrammetry, cartography, etc., to enrich their professional knowledge and become professional surveyors. As the scope of geospatial technology evolves with the progress of internet, remote sensing and GIS, more advanced courses were added into the curriculum framework. In 2004, the title of the department was officially changed to the Dept. of Geomatics to vividly reflect our major missions for dedicating to the education and training of geospatial professionals. The current domain of interests can be generally categorized into three major domains: (1) geodesy and satellite positioning; (2) photogrammetry and remote sensing and (3) geographic information system. Students are required to take fundamental courses from all three domains, and are encouraged to further pursue advanced studies in any fields they choose. Every domain has its own course map for students to follow. With a strong and excellent foundation in surveying engineering education, becoming a licensed surveyor is often regarded as a minimal requirement for the alumni of this department. Students who have strong commitments and research potential to pursue advanced knowledge about geomatics can continue their students in the master and Ph D. programs.
2.2 GIS curriculum
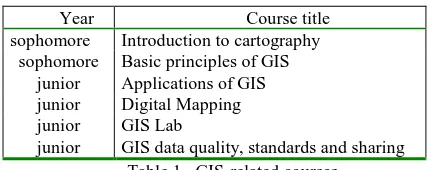
To suffice the needs of GIS training, various topics of GIS-related courses are offered in undergraduate studies (Table 1). Undergraduate students are required to take at least 6 credits of hour of courses from each domain to ensure they have broad knowledge about how geospatial technology is developed and evolved. Since the other two domains are mainly focusing on the acquisition and processing of geospatial data, a link between courses of these two domains and those of GIS must be established and emphasized beforehand. The course “Introduction to Cartography” serves as the foundation for all applications that use maps as the illustration tools. By introducing the basic principles of map making, students learn how to design their own maps that can adapt to application needs and produce maps following predefined mapping specifications. The course of “Basic principles of GIS” offers the basic understanding about GIS. Following the lifecycles of GIS development, we respectively introduce the knowledge about the acquisition, editing, processing, management, analysis, distribution and application of geospatial data. Based upon this basis, the course of “GIS applications” further expands students’ views regarding how geospatial data can be integrated and used in different applications. In addition to these three required courses, the course of “Digital mapping” is designed to address the use of computers on the production of maps in digital format. The course of “GIS Lab” is designed to offer more practical training on different aspects of GIS. The course of “GIS data quality, standard and sharing” focuses on the knowledge to facilitate the sharing of geospatial data via standardized technology Students are expected to develop themselves to be solution providers and team leaders that can actively evaluate the best strategy to the given tasks.
Year Course title
sophomore Introduction to cartography sophomore Basic principles of GIS
junior Applications of GIS junior Digital Mapping junior GIS Lab
junior GIS data quality, standards and sharing Table 1. GIS-related courses
According to the course maps of the department, students are expected to complete all the required courses of the three major domains after their junior years. Some students may continue to pursue advanced studies in GIS fields under the supervision of teachers. These students are trained to be able to apply for job, e.g., project manager, engineer, etc., offered by private GIS consulting firms. Other students may choose to pursue their career as surveyors. Based on the training from GIS-related courses, they are able to use GIS software as tools for the handling and processing of geospatial datasets. Regardless what their choice of professional career is, a correct understanding about the production and distribution of geospatial data is the key to our curriculum design.
2.3 Vision
Via the designed courses, every student graduated from this department is expected to have sufficient professional knowledge and ample hand-on experience to become a professional licensed surveyor. From the perspective of GIS, every student must have a clear and unambiguous understanding about how geospatial data is produced and distributed in the future data sharing environment. Our goals are therefore designed as the following:
1. Students must have the ability to analyze the requirement of tasks at hands with professional knowledge, 2. Students must be able to offer the best strategy by taking advantages of tools available to them, both surveying and GIS.
3. Students must be able to evaluate the quality of their products and the control of error factors during data production.
4. Students must be able to convey their understanding about data to users to avoid wrong decision making.
As an individual course may cover one or two aspects only, we believe a more comprehensive design that encompass all the above four goals in a logical and integrated fashion needs to be introduced in our curriculum. Section 3 demonstrates how we incorporate this requirement in our GIS lab design.
3. CURRICULUM DESIGN
Based on the visions raised in section 2.3, the following discusses the lab design for “Digitizing of geospatial data”. Digitizing was one of the fundamental GIS skills that allow users to extract the spatial information of phenomena of interests from existed medium, e.g., maps and imagery (Chang, 2003). The digitized location information is stored in digital formats for further processing in GIS-based applications. Typical examples in the earlier years were mainly paper maps, e.g., historical maps, topographic maps, cadastral maps, etc. After remote sensing images become powerful resources for collecting instantaneous information of reality and reliable reference for analyzing changes over time, the ability of digitizing becomes a mandatory skill to GIS users. However, International Archives of the Photogrammetry, Remote Sensing and Spatial Information Sciences, Volume XXXVIII-6/W27, 2011
most users simply learn how to “use” the digitizing function without a correct understanding about the factors that may influence the quality of the products. To educate surveyors to offer high-quality digitized geospatial data for later applications, the following factors are included in this lab:
1. The basic workflow of digitizing process 2. The determination of coordinate reference system 3. The choose of common control points
4. The geo-registration procedures
5. The distinct property of various types of data sources 6. The efficient digitizing procedures
7. The evaluation of positional accuracy 8. The topological constraints of digitized data 9. The completeness constraints of digitized data 10. The use of free internet resources
11. The establishment of standardized metadata
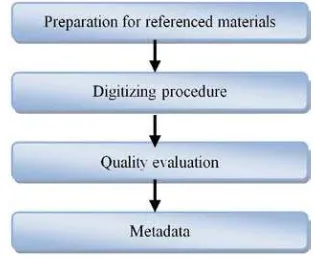
The digitizing process in this lab is composed of four major steps (Figure 1):
Figure 1 The major steps of digitizing process.
3.1 Preparation of referenced data source
Since the digitized results are location information extracted from the referenced materials by human operators, the specification, property and condition of the referenced materials have dominant influence on the digitized coordinates. Students must have thorough understanding about the technical limitation and distinct properties of the referenced materials. Four types of referenced material are used in this lab:
Scan of existing maps
To extract useful information from paper-based maps, a commonly used approach is to scan the maps into digital imagery and use heads-up digitizing approach to acquire the location information. Students are first required to identify the scale, time, context, coordinate reference system (CRS) of the maps. The influence introduced in the scanning process, e.g., resolution, scanner calibration, etc., is also discussed. For those map sheets with no CRS information, students are also required to identify control points from the scanned images for the later process of geo-registration.
Digital RS images
Digital RS images are widely used in current GIS-based applications because of their advantages for offering up-to-date information about reality. Most of the imagery products are already geo-referenced to a specific CRS by their producers, so the procedure of coordinate transformation and selection of control points can be often skipped. Students, however, must be aware of that the ground resolution, time and spectrum will
largely restrict the outcomes of digitizing. As most of the imagery is produced following specific technical specification, commonly used imagery types in Taiwan are introduced.
Google Earth
Google Earth has received increasing attention from both geospatial professionals and ordinary users becasue it not only provides global coverage of the earth, but also historical archives of images at the same place. Furthermore, the use of Google Earth is free to the public. Google Earth thus quickly becomes a popular and inexpensive source from which digitized information can be collected. Despite its advantages, the drawback for Google Earth is its inconsistent quality at different places and users generally are not offered sufficient information to determine its fitness for use. When users are not sure whether the referenced material is reliable or not, the digitized result is also questionable.
Web Map Service
Web Map Service (OGC, 2006) has quickly become an easy way for organizations to publish their data to the internet. With its imagery-based nature, users can easily acquire data from the servers in imagery format and digitize phenomena of interests with tools available from clients’ software. As WMS requires providers to clearly specify its referenced CRS, the procedure is very similar to the procedure for digitizing a RS image. Unlike the above three types of sources, the image returned can be arbitrarily specified by users and can be even superimposed in Google Earth for further comparison. The National Center for High-Performance Computing (NCHC) provides a variety of WMS based on the RS images it collected. Unlike Google Earth, the WMS from NCHS is dedicated to the images of Taiwan. Some of them are the images collected after major natural hazards. This serves as an outstanding resource for students to use free resources and reducing the cost of data acquisition. Figure 2 shows the result after a WMS is opened in QGIS.
Figure 2 Example of digitizing based WMS (QGIS).
Since the results of a digitizing process is stored in vector data format. The teaching goal in this step is to help students to gain a better understanding about the property of various available resources, such that they have knowledge about the limitation of referenced material and the procedure for selecting and preparing for the best referenced material available.
3.2 Digitizing procedure
The digitizing procedure in this lab is restricted to the digitization performed by human operators. A step-by-step International Archives of the Photogrammetry, Remote Sensing and Spatial Information Sciences, Volume XXXVIII-6/W27, 2011
guide for the digitization procedures is first introduced. Four GIS software, namely, MapInfo, AutoDesk Map, Google Earth and QGIS, are used in this lab. Because students are already familiar with the operations of MapInfo in the course of “Basic principles of GIS”, the other software is chosen to increase students’ knowledge about their distinguished design of digitizing functions. Based on their operating experience in the lab, students are asked to give evaluation about the pros and cons for the chosen software. The following questions must be discussed in their reports:
Q: How will the choice of control points affect the digitizing results?
Q: How to detect the error in the registration of control points? Q: How to setup the parameter of snap tolerance during
digitization?
Q: How to reduce duplicated digitizing loading? Q: How to avoid the co-boundary problem?
Q: How to improve the efficiency of the digitizing task? Q: How to ensure all the required data has been digitized? Q: How to ensure the required topological constraints is met? Q: How to deal with the transformation between different
coordinate reference systems?
For example, the following two tasks are specifically designed for students to understand the influence caused by the selection of control points:
Task 1
Given a scanned image of a grid, students are required to complete the following procedures:
1. Carefully digitize the corner points of the grid and specify the correct coordinates of the corner points. 2. Digitize all the grid points and compare the digitized results with their theoretical value.
3. Calculate the RMS based on the difference of the comparisons in step 2.
This task uses a scanned image of grid to offer a theoretical framework as the reference for digitization. Since every digitized coordinate can be compared with its theoretical value, it helps students to understand how accurate their digitizing result can be.
Task 2
With the same scanned grid image, this task ask students to first change the coordinate of one corner points by adding a hypothesized error and then digitize the grid points one more time. When compared with the results of task 1, the major error now comes from the hypothesized error. Students are asked to analyze if such an error can be found during digitization and how to avoid such types of error.
Some of the above GIS software offers specifically designed function to track the co-boundary of two neighbouring polygons, such that they do not need to be digitized twice. Students are required to test and evaluate how this type of function can help to improve the efficiency of digitization. To gain more knowledge about the variety of reference material, students are required to first compare the specification of ortho-images, Google Earth and RS images, then further compare the digitized results from these three referenced materials and discuss the major reasons for causing such differences. When handling a digitizing task, we believe a professional surveyor must be able to
1. Select the best GIS software to complete the task; 2. Design the most effective and efficient digitizing procedures;
3. Reduce repetitive digitizing as much as possible; 4. Control the negative factors to the digitized results; 5. Ensure the quality of the digitized results.
3.3 Data quality
Data quality information serves as the basis for users to determine if the data fits their application needs. As such information can only be provided by people who really involve in the process of producing data, every professional surveyor must learn how to correctly evaluates the quality of the digitized data and unambiguously convey data quality information to users in a standardized way. The categorization of data quality in ISO19113 (ISO, 2002) is introduced and three data quality sub elements, completeness, positional accuracy and logical consistency, are emphasized in this lab:
Completeness (omission and commission)
Completeness denotes the evaluation if all the selected features from the reference materials are digitized without loss (omission) and if no features in the digitized data are included by mistakes (commission). Students are required to evaluate the completeness status of their digitized data by comparing it to the reference dataset. Students in the same group are asked to digitize the same reference material and compare their digitized results. In this step, students learn how to develop a standardized operating procedure for evaluate data quality either by self-checking or reference data. Omission and Commission are evaluated separately.
Positional accuracy (absolute positional accuracy)
Absolute positional accuracy denotes the difference between the digitized coordinate and the coordinate that is regarded as true values. Students are asked to make comparisons between their digitized coordinates and the coordinates of the check points and select appropriate data quality measure from ISO19138 (ISO, 2006) to describe its data quality status.
Logical consistency (topological consistency)
Many applications require the digitized dataset to conform to specific topological constraints, for example, polygons do not overlap with each other, node-edge structure, etc. In addition to the functions students learn to ensure the quality of the digitized results in section 3.2, e.g., the handling of co-boundary situation, students further learn how to verify the data quality status by using specific functions from GIS software. For example, the MapInfo provides a function to detect the overlaps and gaps between polygons. Such tiny polygons can be automatically found and eliminated from the digitized datasets. To ensure the submitted results will meet the specified topological constraints, students must master the skills of selecting and using the variety of topological operations offered by different GIS software.
To successfully convey the data quality information to users, professional surveyors are required to be familiar with the way quality information is created and distributed in geospatial community. This step is designed to guide students to integrate the knowledge they learned from courses of adjustment, engineering statistics and geospatial data quality.
3.4 Metadata.
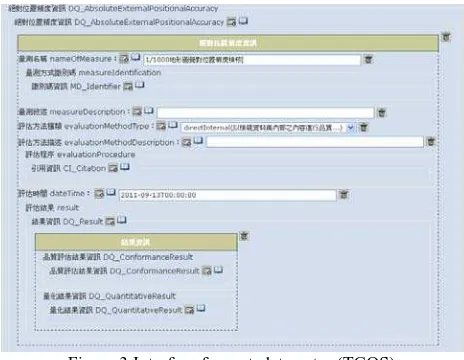
The establishment of standardized metadata is a mandatory requirement for every newly produced geospatial data, so it should also be a mandatory skill to professional surveyors. Compliant with the ISO19115 (ISO, 2003) standard, Taiwan Spatial Metadata Profile (TWSMP) serves as the standard for creating metadata. The metadata entry system (Figure 3) offered by the TGOS (Taiwan Geospatial One Stop) is used for students to establish standardized metadata (TGOS, 2011). In this lab, we particularly focus on the establishment of metadata elements related to data quality. Students are required to carefully summarize the lineage information of digitized data step by step via the metadata elements of process step and cited sources. As a digitizing task will involve a series of procedures and at least one reference material, this lab is a perfect example to let student build a comprehensive understanding about the metadata elements of data quality. Because the status of completeness, absolute positional accuracy and topological consistency has also been evaluated, students also learn how to record their evaluated results with quantitative data quality elements.
Figure 3 Interface for metadata entry (TGOS).
Following the above procedure, students learn how to make a plan for a digitizing assignment and convey information that is useful to users with standardized metadata. In the course of “GIS Lab”, all labs designed for producing or processing geospatial datasets will follow a similar approach, such that students can incrementally increase their knowledge and experience.
4. CONCLUSION
To meet the variety of application demands from the geospatial community, professional surveyors must be aware of the changes to their role and responsibility in the future data sharing and distribution environment. In addition to the solid education and practices they receive from geodesy and remote sensing related courses, we argued that the curriculum design must extend to particularly include issues of data quality and metadata and these two issues must be logically integrated with the training of the production of geospatial data. We demonstrate how we use free on-line resource and various GIS software to help students building thorough knowledge about all the aspects of digitization tasks. More courses dealing with the collaboration of knowledge across different domains should
be added to improve students’ ability to meet the different demands from geospatial applications.
5. REFERENCE
ISO, 2002. ISO19113, Geographic Information - Quality Principles.
ISO, 2003. ISO19115, Geographic Information - Metadata ISO, 2006. ISO19138 – Geographic Information - Data Quality Measure
Chang, K.-T., 2003. Introduction to GIS, 2nd edition, McGraw-Hill.
TGOS, 2011. Taiwan Geospatial One Stop (http://tgos.nat.gov.tw/tgos/)
OGC, 2006. OpenGIS Web Map Server Implementation Specification, v. 1.3.0.