EVALUATION OF WHEAT GROWTH MONITORING METHODS
BASED ON HYPERSPECTRAL DATA OF LATER GRAIN FILLING
AND HEADING STAGES IN WESTERN AUSTRALIA
T. Nakanishi a *, Y. Imai a, T. Morita a, Y. Akamatsu a, S. Odagawa b, T. Takeda c and O. Kashimura c
a
Kokusai Kogyo Co., Ltd. 2-24-1 Harumi-cho, Fuchu-shi, Tokyo, 183-0057, Japan - (taira_nakanishi, yasuteru_imai,
taichi_morita, yukio_akamatsu)@kk-grp.jp
b
Asia Air Survey Co., Ltd. 1-2-2 Manpukuji, Asao-ku, Kawasaki-shi, Kanagawa, 215-0004, Japan -
[email protected]
c
Japan Space Systems. 3-5-8 Shibakoen, Minato-ku, Tokyo, 105-0011, Japan - (takeda-tomomi,
kashimura-osamu)@jspacesystems.or.jp
Commission VIII/6, Agriculture, Ecosystems and Bio-Diversity
KEY WORDS: Hyperspectral imaging, Remote monitoring, Agricultural products, Moisture, LAI
ABSTRACT:
This study estimated the wheat yield, quality, and growth conditions using hyperspectral data of the later grain filling and heading stages. The study area is located in the suburbs of Mullewa, Western Australia. Various data used included spectral reflectance of wheat measured from the ground and those measured using airborne sensors, wheat growth conditions data, such as LAI, SPAD values, and wheat height, and sample analysis data, including biomass, grain nitrogen content rate, leaf nitrogen content rate, and ash content, of the later grain filling and heading stages. This study consisted of (1) selection of estimation items regarding the wheat yield, quality, and growth conditions by correlation analysis of sample data, (2) definition of estimate equations for selected items, (3) verification of estimation accuracy, and (4) development of estimation maps. As a result, head moisture, which is related to the wheat growth conditions, was well estimated using hyperspectral data of the later grain filling stage. At the same time, grain weight, which is related to the wheat yield, and grain nitrogen content rate and ash content, which are related to the wheat quality, were well estimated using hyperspectral data of the heading stage. This study implies that it is possible to visualize the wheat yield, quality, and growth conditions on a regional scale using hyperspectral data.
* Corresponding author.
1. INTRODUCTION
Australia plays a key role to ensure food security of Japan. Approximately 90% of wheat consumed in Japan is imported from overseas countries. Among all countries, Australia is the thrid most important country because raw materials used to produce noodles in Japan are imported mostly from Australia. However, the Australian wheat production is vulnerable to natural disasters such as droughts. Therefore, it is desirable to develop the growth monitoring system to ensure the stable Australian wheat supply in the future.
Profitable agriculture requires efficient and precise estimation method for crop growth monitoring. Spaceborne sensors with a high wavelength resolution can improve the efficiency and precision of the estimation. The Ministry of Economy, Trade and Industry (METI) of Japan plays a leading role in the development of the satellite-borne hyperspectral sensor, HISUI (Hyper-spectral Imager SUIte), and researches on fundamental technology for hyperspectral data's applications in various fields such as energy, natural resources, agriculture, forestry, and the environment. In the field of agriculture, hyperspectral imaging is experimentally used to estimate the yield, quality, and growth of rice and wheat. Accordingly, we evaluated methods to estimate the wheat yield, quality, and growth conditions using ground-based and airborne hyperspectral data of the later grain filling and heading stages in Western Australia.
2. STUDY AREA
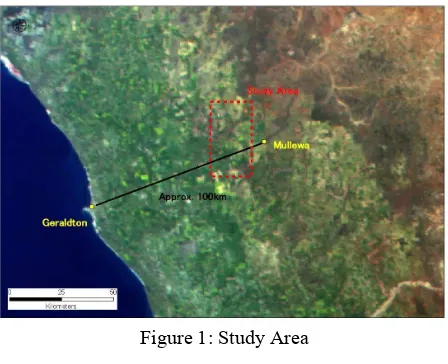
The study area is located in the suburbs of Mullewa, Western Australia (Figure 1). The area is approximately 480km² with mostly flat land features, and is mainly used for wheat, canola, and lupin fields which size is several square kilometers.
Figure 1: Study Area
3. DATA USED
The first field survey was conducted in the late October, which is around the same time as the later grain filling stage of wheat, of the year 2009 (Table 1). Ground-based hyperspectral data International Archives of the Photogrammetry, Remote Sensing and Spatial Information Sciences, Volume XXXIX-B8, 2012
were acquired between October 14th and 16th using the FieldSpec Pro and FieldSpec Pro FR (ASD Inc., the U.S.), portable hyperspectral sensors, while airborne hyperspectral data were acquired in October 29th using the HyMap (HyVista Corporation, Austraria), an airborne hyperspectral sensor.
The second field survey was conducted between the late August and early September, which is around the same time as the heading stage of wheat, of the year 2010 (Table 1). Ground-based hyperspectral data were acquired between August 25th and September 2nd using the FieldSpec 3 FR and FieldSpec Pro FR, while airborne hyperspectral data were acquired in September 6th using the HyMap.
Table 1: Data Used for this Study and Observation Date
First Survey Second Survey
FieldSpec 2009/10/14-2009/10/16 2010/08/25-2010/09/02
HyMap 2009/10/29 2010/9/6
Growth Conditions
Data 2009/10/13-2009/10/15
2010/08/24-2010/09/06, 2010/10/14-201010/19
Sample Analysis
Data 2009/10/16-2009/10/20
2010/08/24-2010/09/06, 2010/10/14-2010/10/19
Data Type Observation Date
3.1 Specifications of Ground-based Hyperspectral Data
To acquire ground-based hyperspectral data and conduct plant sampling, the total 30 and 33 quadrats (10m by 10m) were installed for the later grain filling and heading stage observations respectively. In the field surveys, the reflectance spectra were measured at northwest, southwest, and southeast corners of each sample quadrat. To acquire typical spectral data, two sets of ridge, furrow, ridge and furrow were repeatedly measured from approximately 1m above a head of wheat (Figure 2). The measurement wavelength ranged from 350nm to 2,500nm, and the wavelength resolution was 1nm.
Figure 2: Overview of Quadrat (Left) and Acquisition Method (Right)
3.2 Specifications of Airborne Hyperspectral Data
For the airborne surveys using the HyMap, the flight height was 2,250m, and the number of flight lines was nine. The observation wavelengths ranged from 440 to 2,480nm. The number of bands was 126, and the wavelength resolution was approximately 20nm. The view angle was 60 degrees, and the spatial resolution was about 4.2m.
3.3 Acquisition of Wheat Growth Conditions Data
For the later grain filling stage observation, the Leaf Area Index (LAI) and wheat height were measured at each sample point of the 30 quadrats around the same time as the ground-based reflectance spectra measurement. Wheat samples were also
collected in the field. The number of wheat heads were counted, and the wet and dry wheat weights were also measured. After threshing, the wheat grain weight was measured, and 15 components, including the grain nitrogen content rate, were analyzed.
For the heading stage observation, the LAI, SPAD values, and wheat height were measured in the 33 quadrats around the same time as the ground-based reflectance spectra measurement. Wheat samples were also collected in the field. The number of wheat heads was counted, and wet and dry wheat weights were measured. After threshing, the wheat grain weight was measured, and 17 components, including the leaf nitrogen content rate, were analyzed. For the year 2010, wheat samples were collected again from October 14th to 19th, which is during the harvesting stage. The number of wheat heads, grain weight, and biomass were measured, and 17 components, including the grain nitrogen content rate, were analyzed.
4. METHODS
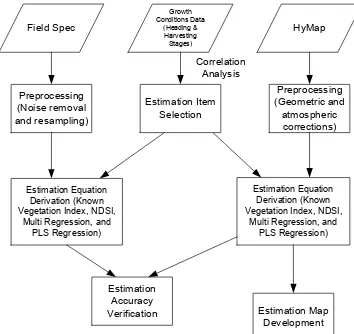
This study involved (1) estimation items selection, (2) estimation equation derivation, (3) estimation accuracy verification, and (4) estimation map development. Regarding the estimation equation derivation, the PLS regression was used for the heading stage observation only (Figure 3).
Field Spec
Growth Conditions Data
(Heading & Harvesting Stages)
HyMap
Preprocessing (Noise removal and resampling)
Estimation Item Selection
Preprocessing (Geometric and atmospheric corrections)
Estimation Equation Derivation (Known Vegetation Index, NDSI,
Multi Regression, and PLS Regression)
Estimation Equation Derivation (Known Vegetation Index, NDSI,
Multi Regression, and PLS Regression)
Estimation Accuracy
Verification Estimation Map
Development Correlation
Analysis
Figure 3: Workflow of this Study
4.1 Estimation Items Selection
The sample wheat data were analyzed to examine correlations between wheat features, and estimation items that are related to the wheat yield, quality, and growth conditions were determined. The sample wheat data of the heading stage were collected around the same time as ground-based and airborne hyperspectral data acquisition. The sample wheat data of the harvesting stage were also analyzed to examine correlations, and estimation items that are related to the wheat yield and quality were estimated.
4.2 Estimation Methods
For the later grain filling stage observation, (1) known vegetation index, (2) normalized differential spectral index (NDSI) (Inoue et al., 2008), and (3) multi regression analysis were examined. For the heading stage observation, (1) known vegetation index, (2) NDSI, (3) multi regression analysis, and (4) PLS regression analysis were examined. Using these estimation methods, correlations between the reflectance International Archives of the Photogrammetry, Remote Sensing and Spatial Information Sciences, Volume XXXIX-B8, 2012
spectra measured using the FieldSpec and the HyMap, and the selected estimation items were examined. Finally, an estimation equation was derived from the analysis results.
4.3 Estimation Accuracy Verification
For estimation items that implied a relatively high degree of conformance, the estimated values and actual measured values were compared, and the estimation accuracy was verified.
4.4 Estimation Map Development
For estimation items that implied a relatively high degree of conformance, estimation maps that cover the entire study area were developed based on the HyMap hyperspectral data.
5. RESULTS AND DISCUSSION
5.1 Selection of Estimation Items
5.1.1 Later Grain Filling Stage
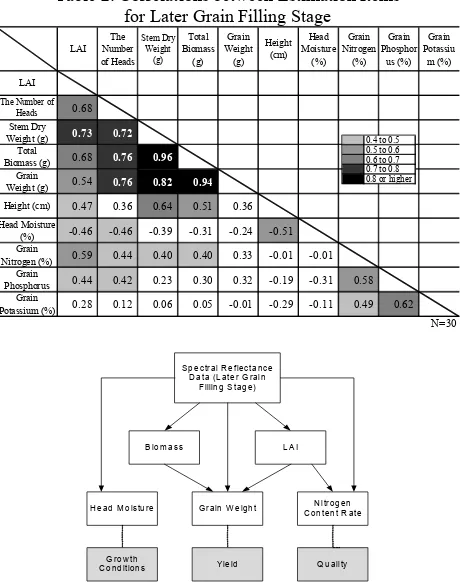
Table 2 shows correlation coefficients between the sample wheat data. For the grain weight, which is related to the wheat yield, an extremely high correlation between the dry stem weight and biomass (the total dry weight of head and stem) was determined (R: 0.9 or higher). The correlation between the grain weight and the number of heads was also determined (R: 0.76). For the grain nitrogen content rate, which is related to the wheat quality, a weak correlation with LAI was determined (R: 0.59). For the head moisture, which is related to the growth conditions, correlations with other estimation items were not determined. Biomass and LAI were also selected as estimation items, and the estimation methods using hyperspectral data were examined for these selected items (Figure 4).
Table 2: Correlations between Estimation Items for Later Grain Filling Stage
LAI
Weight (g) 0.73 0.72 Total
Biomass (g) 0.68 0.76 0.96 Grain
Weight (g) 0.54 0.76 0.82 0.94 Height (cm) 0.47 0.36 0.64 0.51 0.36
Head Moisture
(%) -0.46 -0.46 -0.39 -0.31 -0.24 -0.51 Grain
Nitrogen (%) 0.59 0.44 0.40 0.40 0.33 -0.01 -0.01 Grain
Phosphorus 0.44 0.42 0.23 0.30 0.32 -0.19 -0.31 0.58 Grain
Potassium (%) 0.28 0.12 0.06 0.05 -0.01 -0.29 -0.11 0.49 0.62
N=30
Figure 4: Estimation Items for Later Grain Filling Stage
5.1.2 Heading Stage
Table 3 shows correlation coefficients between the sample wheat data. For the grain weight, relatively high correlations with biomass of the heading stage and biomass of harvesting stage were determined (R: about 0.7). For the grain nitrogen content rate, a very high correlation with leaf nitrogen content rate was determined (R: 0.83), and correlations with LAI and SPAD values were also determined (R: about 0.7). For the ash content, which is related to the wheat quality, correlations with other estimation items were not determined. Biomass, LAI, SPAD values, and leaf nitrogen content rate were also selected as estimation items, and the estimation methods using hyperspectral data were examined for these selected items (Figure 5).
Table 3: Correlations between Estimation Items for Heading Stage
LAI SPAD Length (cm)Culm Biomass (g)Content (%)Moisture Leaf Weight (g)Biomass (g)
Grain
0.34 0.39 -0.24 0.26
Leaf Nitrogen Content Rate (%)
0.63 0.58 -0.12 0.19 0.51
The Number of
Heads
0.51 0.44 0.05 0.56 0.49 0.70
Grain Weight (g)
0.10 0.30 0.50 0.69 0.02 -0.08 0.36
Biomass
0.68 0.72 0.00 0.36 0.64 0.83 0.65 -0.08 0.49
Ash Content
(%)
-0.26 -0.22 -0.40 -0.18 0.35 0.08 0.07 -0.40 -0.23 0.08
N=33
Heading Stage Harvesting Stage
H
Biomass LAI SPAD Leaf Nitrogen
Content Rate
Grain Weight Grain Nitrogen
Content Rate Ash Content
Yield Quality
Spectral Reflectance Data (Heading Stage)
Figure 5: Estimation Items for Heading Stage
5.2 Examinations of the Estimation Methods
5.2.1 Later Grain Filling Stage
Table 4 shows estimation results of the selected estimation items using the three estimation methods. For the head moisture and LAI, the multi regression analysis using the FieldSpec and HyMap showed a relatively high determination coefficient (R²: 0.6 or over). In the multi regression equation for the head moisture, the short wavelength infrared region (SWIR) was selected. However, the previous case study of rice indicated that the reflectance ratio of SWIR increases as the head moisture International Archives of the Photogrammetry, Remote Sensing and Spatial Information Sciences, Volume XXXIX-B8, 2012
decreases (Shibayama and Akiyama, 1989). Therefore, it is possible that a similar situation will occur to the case of wheat. For the known vegetation index for the LAI, the cellulose absorption index (CAI) indicated a relatively high determination coefficient, and the wavelength band around 2,200nm was selected for the multi regression equation.
For the grain weight, nitrogen content rate, and biomass, all estimation methods showed a low determination coefficient. This situation implied that it is difficult to develop an estimation equation.
Table 4: Determination Coefficient for Later Grain Filling Stage
R2 Wavelength (nm) R2 Wavelength (nm)
mNDVI 0.046 705, 750 0.099 705, 750
CAI 0.104 2000, 2100, 2200 0.140 2000, 2100, 2200
NDLI 0.143 1680, 1754 0.003 1680, 1754
0.399 1140, 1190 0.410 1480, 1500
0.380 1220, 1730 0.368 1200, 1430, 1720
rbNDVI 0.042 445, 630 0.076 445, 630
NDNI 0.043 1510, 1680 0.130 1510, 1680
0.445 1640, 1660 0.495 1460, 2130
0.501 1330, 1970 0.540 680, 1980
NDWI 0.128 860, 1240 0.272 860, 1240
WBI 0.631 900, 970 0.430 900, 970
0.571 970 0.226 970
0.547 2010, 2020 0.624 1200, 1280
0.691 750, 1720, 2090 0.840 1720, 2090, 2270
SR 0.237 665, 845 0.331 665, 845
NDVI 0.248 665, 845 0.330 665, 845
mNDVI 0.028 705, 750 0.151 705, 750
SGR 0.023 500 … 599 0.035 500 … 599
PRI 0.192 531, 570 0.094 531, 570
RGR 0.002 500 … 599,
600 699 0.046 500 … 599,600 699
PI2 0.050 695, 760 0.186 695, 760
CAI 0.155 2000, 2100, 2200 0.174 2000, 2100, 2200
NDLI 0.230 1680, 1754 0.009 1680, 1754
0.512 1120, 1220 0.456 1140, 1450
0.545 620, 1770 0.592 1320, 1950
SR 0.123 665, 845 0.347 665, 845
NDVI 0.136 665, 845 0.354 665, 845
mNDVI 0.008 705, 750 0.065 705, 750
SGR 0.038 500 … 599 0.086 500 … 599
PRI 0.479 531, 570 0.331 531, 570
RGR 0.026 500 … 599,
600 699 0.084
500 … 599,
600 699
PI2 0.001 695, 760 0.094 695, 760
CAI 0.529 2000, 2100, 2200 0.509 2000, 2100, 2200
NDLI 0.132 1680, 1754 0.000 1680, 1754
0.538 2130, 2160 0.583 1530, 1600
0.681 1480, 2080, 2270 0.859 680, 1470, 2280 Known Index
■: Determination coefficient of 0.6 or higher Multi Regression
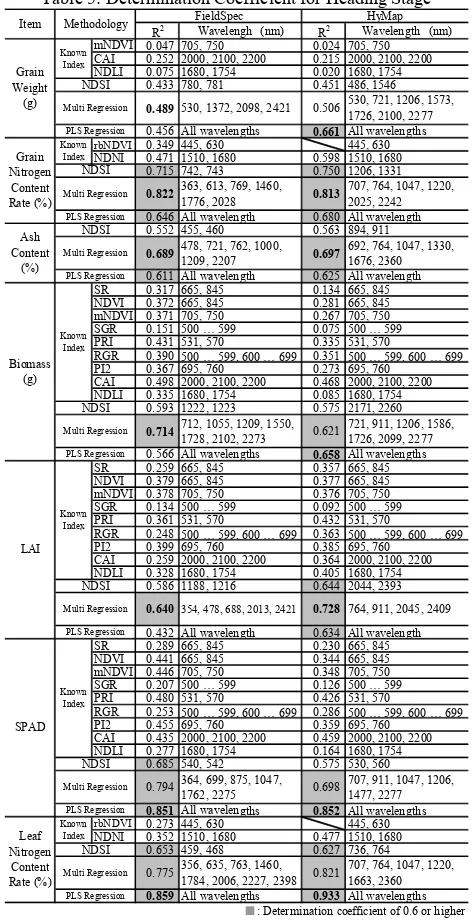
Table 5 shows estimation results of the selected estimation items using the four estimation methods. The grain nitrogen content rate, SPAD values, and leaf nitrogen content rate indicated a high determination coefficient (R²: 0.8 or over). The multi regression analysis was the most appropriate method for the grain nitrogen content rate, while the PLS regression was the most appropriate method for the SPAD values and leaf nitrogen content rate. The grain weight, ash content, biomass, and LAI also indicated a relatively high determination coefficient (R²: 0.6 or over). The multi regression analysis was the most appropriate method for the ash content and LAI, while the multi regression analysis using the FieldSpec was the most appropriate method for the grain weight and biomass. For the HyMap, the PLS regression using the HyMap was the most appropriate method for the same estimation items.
Table 5: Determination Coefficient for Heading Stage
R2 Wavelengh (nm)
R2 Wavelength (nm)
mNDVI 0.047 705, 750 0.024 705, 750 CAI 0.252 2000, 2100, 2200 0.215 2000, 2100, 2200 NDLI 0.075 1680, 1754 0.020 1680, 1754
0.433 780, 781 0.451 486, 1546
0.489 530, 1372, 2098, 2421 0.506 530, 721, 1206, 1573, 1726, 2100, 2277 0.456 All wavelengths 0.661 All wavelengths
rbNDVI 0.349 445, 630 445, 630 NDNI 0.471 1510, 1680 0.598 1510, 1680
0.715 742, 743 0.750 1206, 1331
0.822 363, 613, 769, 1460,
1776, 2028 0.813
707, 764, 1047, 1220, 2025, 2242 0.646 All wavelength 0.680 All wavelength 0.552 455, 460 0.563 894, 911
0.689 478, 721, 762, 1000,
1209, 2207 0.697
692, 764, 1047, 1330, 1676, 2360 0.611 All wavelength 0.625 All wavelength SR 0.317 665, 845 0.134 665, 845 NDVI 0.372 665, 845 0.281 665, 845
mNDVI 0.371 705, 750 0.267 705, 750 SGR 0.151 500 … 599 0.075 500 … 599 PRI 0.431 531, 570 0.335 531, 570
RGR 0.390 500 … 599, 600 … 699 0.351 500 … 599, 600 … 699 PI2 0.367 695, 760 0.273 695, 760
CAI 0.498 2000, 2100, 2200 0.468 2000, 2100, 2200 NDLI 0.335 1680, 1754 0.085 1680, 1754
0.593 1222, 1223 0.575 2171, 2260
0.714 712, 1055, 1209, 1550,
1728, 2102, 2273 0.621
721, 911, 1206, 1586, 1726, 2099, 2277 0.566 All wavelengths 0.658 All wavelengths SR 0.259 665, 845 0.357 665, 845 NDVI 0.379 665, 845 0.377 665, 845
mNDVI 0.378 705, 750 0.376 705, 750 SGR 0.134 500 … 599 0.092 500 … 599 PRI 0.361 531, 570 0.432 531, 570
RGR 0.248 500 … 599, 600 … 699 0.363 500 … 599, 600 … 699 PI2 0.399 695, 760 0.385 695, 760
CAI 0.259 2000, 2100, 2200 0.364 2000, 2100, 2200 NDLI 0.328 1680, 1754 0.405 1680, 1754
0.586 1188, 1216 0.644 2044, 2393
0.640 354, 478, 688, 2013, 2421 0.728 764, 911, 2045, 2409 0.432 All wavelength 0.634 All wavelength SR 0.289 665, 845 0.230 665, 845 NDVI 0.441 665, 845 0.344 665, 845
mNDVI 0.446 705, 750 0.348 705, 750 SGR 0.207 500 … 599 0.126 500 … 599 PRI 0.480 531, 570 0.426 531, 570
RGR 0.253 500 … 599, 600 … 699 0.286 500 … 599, 600 … 699 PI2 0.455 695, 760 0.359 695, 760
CAI 0.435 2000, 2100, 2200 0.459 2000, 2100, 2200 NDLI 0.277 1680, 1754 0.164 1680, 1754
0.685 540, 542 0.575 530, 560 0.794 364, 699, 875, 1047,
1762, 2275 0.698
707, 911, 1047, 1206, 1477, 2277
0.851 All wavelengths 0.852 All wavelengths
rbNDVI 0.273 445, 630 445, 630 NDNI 0.352 1510, 1680 0.477 1510, 1680
0.653 459, 468 0.627 736, 764 0.775 356, 635, 763, 1460,
1784, 2006, 2227, 2398 0.821
707, 764, 1047, 1220, 1663, 2360
0.859 All wavelengths 0.933 All wavelengths
Item
■: Determination coefficient of 0.6 or higher
PLS Regression
The accuracies of grain weight, grain nitrogen content rate, and ash content of the heading stage, and head moisture of the later grain filling stage showed a high degree of conformance, and their estimation accuracies were verified (Table 6).
Table 6: Determination Coefficient Analysis Results
Heading Stage Later Grain Filling Stage Grain Weight ○R2=0.66 × R2=0.31 Biomass ○R2=0.66 △R2=0.59 Grain Nitrogen Content Rate ◎R2=0.81 △R2=0.54 Ash Content ○R2=0.70 -
Leaf Nitrogen Content Rate ◎R2=0.93 -
LAI ○R2=0.73 ◎R2=0.86 SPAD Value ◎R2=0.94 -
Growth
Conditions Head Moisture - ◎R
2
=0.84 Estimation Items
Yield
Quality
■: Time periods appropriate for estimation
5.3 Estimation Accuracy Verification
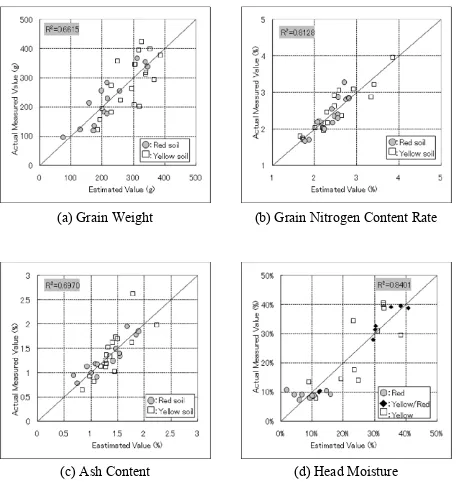
For the grain weight, grain nitrogen content rate, ash content, and head moisture, estimated values and actual measured values were compared. In order to verify influences of soil texture differences, comparison results were separately plotted based on soil color (Figure 6). For example, the head moisture in a red color soil area is usually low (approximately 10%), and the growth speed is generally high. The magnitude relation of quadrats was mostly replicated. At the same time, The grain weight, grain nitrogen content rate, and ash content indicated that the estimated values well corresponded to the actual measured values. The determination coefficients for these items were 0.66, 0.81, and 0.70 respectively. Indirect estimations through the biomass, LAI, and SPAD values showed a good degree of conformance. However, these indirect estimation results did not exceed direct estimation results. For the grain weight, grain nitrogen content rate, and ash content, relations with soil color were not observed.
Figure 6: Comparison Results of Estimated and Actual Measured Values
5.4 Estimation Map Development
Estimation maps of the grain weight, grain nitrogen content rate, and ash content were developed by applying the developed estimation model to the entire HyMap data considering local conditions of the study area. In the same manner, an estimation map of the head moisture was also developed (Figure 7). The estimation map corresponded to the distribution pattern of soil color. The red color soil area indicated a low degree of head moisture, while the yellow color soil area showed a high degree of head moisture. To sum up, it is possible to visualize the wheat yield, quality, and growth conditions on a regional scale using the hyperspectral data of the heading and later grain filling stages.
(d) Head Moisture (a) Grain Weight
(c) Ash Content
(b) Grain Nitrogen Content Rate
(b) Grain Weight (a) HyMap Imagery of Heading Stage
(c) Grain Nitrogen Content
Figure 7: Estimation Maps based on HyMap Imagery
6. CONCLUSION
Estimation methods for the wheat yield, quality, and growth conditions were evaluated using both the ground-based and airborne hyperspectral data of the suburbs of Mullewa, Western Australia. This study revealed that the head moisture was well estimated by the multi regression analysis using the hyperspectral data of the later grain filling stage. This also indicated that the grain weight was well estimated by the PLS regression analysis, and the grain nitrogen content rate and ash content were well estimated by the multi regression analysis using the hyperspectral data of the heading stage. To sum up, this study achieved certain results of the development of the monitoring method for the wheat yield, quality, and growth conditions using hyperspectral data of the later grain filling and heading stages. For the future, the estimation accuracy will be improved by modifying the estimation methods. It is also possible that the estimation methods will be examined in different regions.
7. ACKNOWLEDGEMENT
This study was conducted as part of the project, 'The 2009 and 2010 Research and Development of the Fundamental Technology for Next-generation Satellite Utilizations,' of the former Earth Remote Sensing Data Analysis Center (ERSDAC).
We sincerely thank Dr. Tom Cudahy and Dr. Ian C Lau at the Commonwealth Scientific and Industrial Research Organization (CSIRO) and Mr. Buddy Wheaton and Dr. Daniel Carter at the Department of Agriculture and Food, Western Australia (DAFWA) for their help in the field study and airborne observations.
8. REFERENCES
Imai, Y., Morita, T., Akamatsu, Y., Odagawa, S., Takeda, T., and Kashimura, O., 2011. Evaluation of wheat growth monitoring methods based on hyperspectral data in western Australia. In: IGARSS 2011: IEEE International Geoscience and Remote Sensing Symposium Proceedings, pp. 3338-3341.
Inoue, Y., Peñuelas, P., Miyata, A., and Mano, M., 2008. Normalized difference spectral indices for estimating photosynthetic efficiency and capacity at a canopy scale derived from hyperspectral and CO2 flux measurements in rice. In: Remote Sensing of Environment, vol. 1112, pp. 156-172.
Shibayama, M. and Akiyama, T., 1989. Seasonal visible, near-infrared and mid-near-infrared spectra of rice canopies in relation to LAI and above-ground dry phytomass. In: Remote Sensing of Environment, vol. 27, pp. 119-127.
(d) Ash Content
(f) Head Moisture
(e) HyMap Imagery of Later Grain Filling Stage