PERFORMANCE INVESTIGATION OF A HANDHELD 3D SCANNER
TO DEFINE GOOD PRACTICES FOR SMALL ARTEFACT 3D MODELING
E. Lachat*, T. Landes, P. Grussenmeyer
Photogrammetry and Geomatics Group, ICube Laboratory UMR 7357 - INSA Strasbourg, France (elise.lachat, tania.landes, pierre.grussenmeyer)@insa-strasbourg.fr
KEY WORDS: Handheld 3D scanner, FARO Freestyle3D, Digitization of small objects, Performance evaluation, Comparisons, Archeological artefacts
ABSTRACT:
Handheld 3D scanners can be used to complete large scale models with the acquisition of occluded areas or small artefacts. This may be of interest for digitization projects in the field of Cultural Heritage, where detailed areas may require a specific treatment. Such sensors present the advantage of being easily portable in the field, and easily usable even without particular knowledge. In this paper, the Freestyle3D handheld scanner launched on the market in 2015 by FARO is investigated. Different experiments are described, covering various topics such as the influence of range or color on the measurements, but also the precision achieved for geometrical primitive digitization. These laboratory experiments are completed by acquisitions performed on engraved and sculpted stone blocks. This practical case study is useful to investigate which acquisition protocol seems to be the more adapted and leads to precise results. The produced point clouds will be compared to photogrammetric surveys for the purpose of their accuracy assessment.
* Corresponding author
1. INTRODUCTION
Documentation and study of Cultural Heritage rely more and more on geometry and texture recording, whether it is on large scale sites or small objects. Thanks to the continuous development of materials and techniques for collecting the real geometry of observed scenes, 3D digitization now belongs to the conventional workflow to meet the needs in terms of digital conservation, restoration and visualization. Several acquisition techniques can be mentioned, from terrestrial laser scanning for large expanses to photogrammetry when dealing with detailed objects (Grussenmeyer et al., 2016). On the one hand, Terrestrial Laser Scanners (TLS) are used to collect a large amount of accurate data in a very timely manner. For smaller scale artefacts on the other hand, image-based techniques are most of the time adopted. Next to lower costs of the required material, photogrammetric techniques are boosted by the development of always more powerful algorithms for image processing towards reconstruction of 3D data (Remondino et al., 2014). Given that the use of one acquisition method alone may not always be sufficient in some projects, both methodologies can also be merged in order to overcome their respective limitations and to provide more exhaustive models.
To complete large scale acquisitions with smaller detailed areas or hard to reach places, further sensors known as handheld 3D scanners are available. Examples taken from the literature such as (Hu et al., 2016) or (Zhang et al., 2015) present projects where point clouds coming from TLS and handheld 3D scanners are combined. These devices can rely on different technologies such as structured light, laser triangulation or time-of-flight distance measurement, and their prices vary depending on the devices. However they remain less expensive than mechanical measuring arms for example. Handheld 3D scanners are also mainly appreciated for their ease of use in a wide range of application fields. Most of them do not really require a high experience of the user, who only needs to carefully scan the
whole surface of the observed object in order to avoid the presence of holes in the produced data.
A further valuable aspect while working with most of these sensors is the possible real-time visualization of the acquired data through the manufacturer software. However due to the real-time reconstruction process, the quality of the produced point clouds is often a recurrent issue. A theoretical error model that could be applied to most of handheld scanners is rather hard to define, and it would vary depending on the measurement technique applied. For this reason, works dedicated to the study of handheld 3D scanners (Boehm, 2014; Eiríksson et al., 2016; Kersten et al., 2016; Sánchez et al., 2016) are mainly based on a practical assessment of the data that these devices produce.
The FARO Freestyle3D is a handheld scanner launched on the market in 2015. So far, the literature reporting about its use is rather scarce. It has been used in the works of Bouillod et al. (2016) that are related to aerodynamic studies. Di Pietra et al. (2017) perform point cloud acquisition with the considered device on a sculpture, in order to produce 3D models that are used to investigate the object properties. Both cited contributions are examples of applications of the device.
In this paper, the quality of the data delivered by the Freestyle3D is investigated based on laboratory experiments as well as a real case study. A first section is dedicated to the presentation of sensor specifications and working methods pertained to its use. A second part explores the results of experiments dealing with the influence of the range, color and incidence angle on the measurement. The device has also been applied to capture point clouds of archeological artefacts, which have been surveyed using photogrammetry in parallel. The geometrical accuracy of the data acquired with the handheld scanner is assessed based on the image-based point clouds. Some strengths and weaknesses of digitization using handheld laser scanning and this specific device are finally discussed.
2. MATERIALS AND METHODS
2.1 Freestyle3D technical specifications
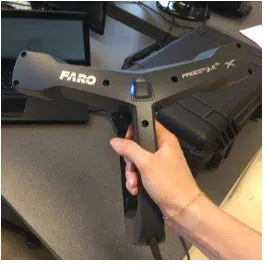
The Freestyle3D (FARO) is a handheld 3D laser scanner designed for dynamic acquisition of dense colored point clouds on surfaces in ranges from 0.5 to 3 m (Figure 1). It is intended for indoor use and has a scanning volume of up to 8 cubic meters. Regarding these specifications, it is foreseen to be applied in professional domains such as architecture and construction, industrial engineering or forensics. The device investigated here is a Freestyle3D X, which is assumed to reduce the noise in the produced point clouds and to improve the 3D point accuracy from 1.5 mm to 1 mm at 1 m range, compared to the initial Freestyle3D version.
Figure 1. Freestyle3D X handheld scanner
The device is composed of a laser projector, two infrared cameras and a color camera that are mounted in a carbon fiber body. According to the manufacturer, a pattern made of points is projected on the surface by the laser, and it is observed by the infrared cameras. The point coordinates are then computed through the triangulation method based on two views of the scene, and color information is used to colorize the point clouds. The measurement principle applied may also indicate the use of a kind of structured light technology since a structured pattern is projected. However, predictably the technology applied by the device is never clearly stated in the manufacturer documentation.
To ensure a precise knowledge of sensor internal parameters, a calibration plate is supplied with the system so that calibration in the field can be easily performed in a few minutes, when necessary.
2.2 3D surveying using Freestyle3D handheld scanner
To perform acquisitions, the Freestyle3D scanner needs to be plugged in a USB port of a computer or a tablet such as Microsoft Surface tablets, which is a more portable solution. The USB connection not only ensures the data transfer to the system, but also the power supply of the device. Thus no wireless communication is possible to transfer the data.
For data acquisition and post-processing, the manufacturer software Scene (FARO) can be used. Two dedicated and separated software known as Scene Capture (for acquisition only) and Scene Process (for post-processing) have also been developed and offer simple interfaces. During the acquisition process, the user follows the real-time collection of the point cloud on the screen (Figure 2). He also gets a real-time feedback on the density and quality of the scanning through a color codification. This is a beneficial aspect especially for
non-expert users, and this helps to avoid the presence of holes in the captured data. In practice, the handheld scanner has to be pointed to the observed scene and slightly displaced from different angles around the object to be digitized. The real-time reconstruction is based on the detection of common points used for the correlation of successive images. No artificial targets are necessary for this purpose, nevertheless specific targets can be printed when challenging scanning configurations are encountered.
Figure 2. Screenshot from Scene Capture software during an acquisition
Before point cloud export, some treatments are performed on the raw data during a post-processing step that is required. Post-processing contributes to improve the quality of the final result through filtering to reduce the noise as well as optimization of the scanning trajectory. Additionally, Scene Process makes it possible to register several point clouds.
3. EXPERIMENTAL REVIEW OF SOME SPECIFICATIONS OF THE HANDHELD SCANNER
The error budget during acquisitions using laser scanning techniques is always composed of errors coming from various sources. Among these, errors due to the object properties (e.g. color) or due to the survey methodology (e.g. range or incidence angle) can be mentioned. In the following, some tests have been carried out with the Freestyle3D laser scanner, in order to analyze the influence of some parameters on the performed measurements.
3.1 Influence of the range
The Freestyle3D scanner is suited for acquisitions up to 3 m range according to its specifications, but it still collects some points at greater distances. To investigate the influence of the range on the measurement, a defined square area of 1 × 1 m on a planar white surface is observed from ranges varying between 0.5 and 4 m in steps of 0.5 m, with an additional observation from 0.75 m range. At each step, the surface is scanned with the device that is hold as perpendicular as possible to marks placed on the ground. A schema of the experiment setup is shown in Figure 3a. The surface considered is a wall that does not present perfect Lambertian reflectance, but it is supposed to be an almost diffusely reflecting surface. As visible in Figure 3b, some stickers have been placed on the square area for helping the device finding corresponding points during the acquisition process, which is challenging when dealing with such a uniform material. At each position of the scanner, the plane has been scanned twice in order to average the computed results. The International Archives of the Photogrammetry, Remote Sensing and Spatial Information Sciences, Volume XLII-2/W5, 2017
(a) (b) (c) (d)
Figure 3. Investigation of factors influencing the measurement: (a) Setup of the experiment dealing with range influence. (b) The considered 1 × 1 m area used for the experiments. (c) Setup of the experiment dealing with the influence of incidence angle.
(d) Color samples and shades of gray used to investigate color influence.
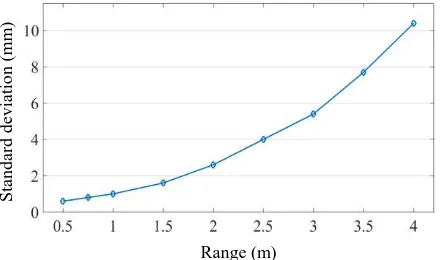
For the practical noise assessment, planes are fitted in the acquired point clouds. A least squares approach is applied to estimate plane parameters using each of the n points which compose the considered point cloud. Residuals are deviations between points and the estimated plane, and they are computed as normal distances between each point and the estimated plane. Thus residuals lead to the computation of a standard deviation for each plane (or each range) considered. Standard deviation characterizes the scattering of measured points around the planar primitive, which is a good indicator for the global precision of the point cloud. The evolution of computed standard deviations with respect to the range is represented by the graph in Figure 4.
Figure 4. Influence of the range on the point cloud precision
The standard deviation increases with the range. This means that the range has a negative influence on the precision of the captured data. However, point clouds acquired at very close ranges (0.5 m and 0.75 m) needed to be rescanned several times, since they suffered from superimposed layers of points that locally provide a “double skin” effect to the point clouds. Besides, range is not the only factor that influences the quality of an acquisition.
3.2 Influence of the incidence angle
While dealing with terrestrial laser scanning data, the measured distance and the returned intensity may vary depending on the incidence angle of the laser beam on the surface. The incidence angle is defined as the angle between the laser beam vector and the normal vector of the considered surface, thus an incidence
angle of 0° represents an observation performed perpendicularly to the surface. Theoretically, for such an angle the most precise results should be obtained, which corresponds to the lowest scattering of points and thus the lowest value of standard deviation. This trend is observed theoretically and experimentally for a TLS as described in (Soudarissanane et al., 2009), where it is exposed that the standard deviation increases with the incidence angle. This can be explained among others by the footprint elongation at larger incidence angles, which deteriorates the range measurements and produces more noise in the point clouds when the laser beam is not perpendicular to the observed surface.
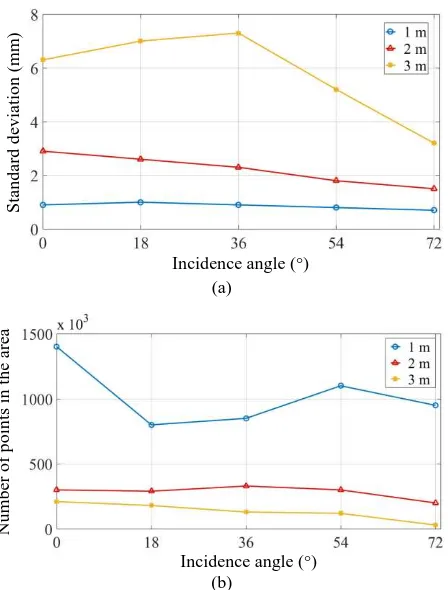
To determine whether the same trend is observed while working with the Freestyle3D handheld scanner, a second test has been carried out. Following the same principle as for the previous experiment, point clouds have been acquired on the same square area of a wall, along different incidence angles. A schematic overview of experiment setup is shown in Figure 3c. This schema illustrates that the acquisitions have been performed at three different ranges, with incidence angles varying from 0° to 72° in steps of 18°. Also applying the same method as before, a standard deviation has been computed for each scanner location. The graph in Figure 5a shows the evolution of the standard deviation with respect to the incidence angle, for 1 m, 2 m and 3m ranges.
At a distance of 1 m, the values of standard deviation do not really vary while incidence angle increases, whereas the standard deviation slightly decreases from 3 mm to 1.7 mm for incidence angles between 0° and 72° at 2 m range. This appears to be contradictory regarding the conclusions obtained with TLS. At 3 m range, the standard deviation first slightly increases up to an incidence angle of 36°, and then decreases. However for such a range, the acquisitions performed at larger incidence angles are probably not reliable since the tracking got lost most of the time.
As shown in Figure 5b, the evolution observed for the standard deviations depending on the incidence angle is not related to the number of points in the datasets, given that the amount of captured points is almost constant for each considered range. These results maybe indicate that a filtering is applied during the acquisition or during the post-processing step to remove points acquired with grazing angles.
Range (m)
S
tan
d
ard
d
ev
iatio
n
(m
m
)
(a)
(b)
Figure 5. (a) Influence of the incidence angle on the point cloud precision (standard deviation). (b) Variation of the number of points in the considered area depending on the incidence angle.
Despite the apparently decreasing standard deviation for larger incidence angles, it should be noted that acquisitions performed at larger incidence angles suffer from other limitations. Indeed, loss of the tracking was often observed for the last two incidence angles of respectively 54° and 72°. Moreover, increasing the angle of incidence during the acquisition also augment the risk to create superimposed layers of points.
3.3 Influence of the color
In lasergrammetric surveys using TLS, the properties of the scanned object surface such as for example its color may have an impact on the distance measured between the sensor and the scene (Voegtle et al., 2008). To investigate the behavior of Freestyle3D handheld scanner measurements towards colored surfaces, a panel containing colored samples has been scanned. The test is limited to red, green and blue colors, as shown in Figure 3d presenting the sample board used for this purpose. A black rectangle with the same dimensions (8 × 10 cm) compared to the colored samples has also been added, as well as some shades of gray. The board has been scanned five times by holding the scanner at a distance of about 70 cm of it.
Each sample has been segmented in the obtained point clouds, and planar primitives have been adjusted in these segmented samples. The standard deviations resulting from the adjustment are the same for the three different color samples. It should be noted that the computed standard deviation is the same than the one computed for a white surface at such a distance. This means that the color does not have any influence on the measured distance, maybe due to the introduction of specific filters within the system.
The result obtained for the black sample is similar compared to the colored ones, with a variation of the estimated standard deviation lower than 1 mm. However the number of points captured on the black sample is significantly lower compared to the three other samples, counting about 8500 points against an average of 18000 points for red, green and blue patterns. Regarding the gray levels, the same conclusion is derived. The standard deviations computed on the small patterns are almost the same, but the number of points in the segmented patterns decreases with the growing darkness of the samples.
3.4 Influence of repeated measurements and scanning duration on a planar surface
The aim of this last test was to investigate the geometrical stability according to the scanning duration or to multiple passes during the scanning process. This analysis is based on an observation of the noise present in the point clouds.
The same white planar surface as before (see Figure 3b) has been scanned by a single displacement of the device in front of the surface, and then by repeating 5 and 10 successive passes within two further respective scanning processes. At a distance of about 1.5 m of the surface, the computed standard deviation does not vary when the number of passes increases. With a standard deviation of about 2 mm, the result is also coherent with the graph presented in Figure 4. The only influence of repeated measurements is the increase of the number of captured points. This amount varies from about 300,000 points when the surface is measured once, to 3 million of points for 5 passes and 7 million of points for 10 successive passes.
The stability has also been investigated within the time. In that case, the scanner has been kept static in front of the surface, during respectively 10, 15, 30, 45 and 60 seconds. It appears that the standard deviations computed in each point cloud are quite stable, given that their variations are lower than 1 mm and thus not significant. As previously described, only the number of the captured points visibly increases with the time, since point clouds contain between 300,000 points for the 10 s long acquisition and 2 million of points for the 1 min long acquisition. Both described experiments make it possible to conclude about the stability of the acquisition process.
4. DIGITIZATION OF SIMPLE GEOMETRICAL SHAPES
Since real objects to which the user can be confronted are often more complex than planes, acquisitions have been performed with the Freestyle3D scanner on further geometrical primitives.
4.1 Adjustment of cylinders in the point clouds
For this study, an object with a cylindrical shape has been scanned by displacing the handheld scanner around the cylinder at an almost constant distance of 1 m. The object has a known diameter of 25 cm. As explained in Section 2, targets are not always required while performing acquisitions with the Freestyle3D device, but some targets can be placed in the scene if necessary. Because of the white uniform color of the object and because of its small radius, some targets have been placed on the cylinder as shown in Figure 6a, in order to avoid that the tracking gets lost due to a lack of texture or to important
a) b)
Figure 6. (a) The cylinder considered in this experiment, with additional targets. (b) Example of a cylindrical primitive
adjusted in a colorized point cloud.
Using the plugin inspired by the works of (Schnabel et al., 2007) and available in the free point cloud processing software CloudCompare, a cylindrical primitive has been fitted in the segmented point clouds. For the 4 tests carried out, the computed radius of the fitted primitive varies between 12.4 and 12.6 cm, which represents a deviation of 1 mm compared to the reality. The scattering of the measured points around the adjusted cylinder is also studied. The mean deviations computed during each adjustment are about 1 mm with standard deviations also equal to 1 mm, which is a quite low value. This means that the geometry of the scanned cylinder is accurately respected in the point clouds acquired here.
4.2 Acquisitions on primitives with parallelepiped shape
To investigate the repeatability of the measurement on non-planar objects, a last experiment has been carried out with the Freestyle3D scanner. It is inspired by the works of (Polo et al., 2012) where the dimensions of sections are compared, knowing that the sections are performed in point clouds issued from repeated acquisitions.
The considered dataset consists of 25 point clouds representing a cardboard box with external dimensions of about 50 × 37 × 19 cm. They have been captured successively in the same conditions, by displacing the scanner around the object at an almost constant distance of 75 cm. The segmented point clouds count between 1.7 and 2.1 million of points. For further analysis, the 25 point clouds have been aligned using an ICP algorithm that delivered a mean error of about 3 mm after the alignment of two consecutive point clouds.
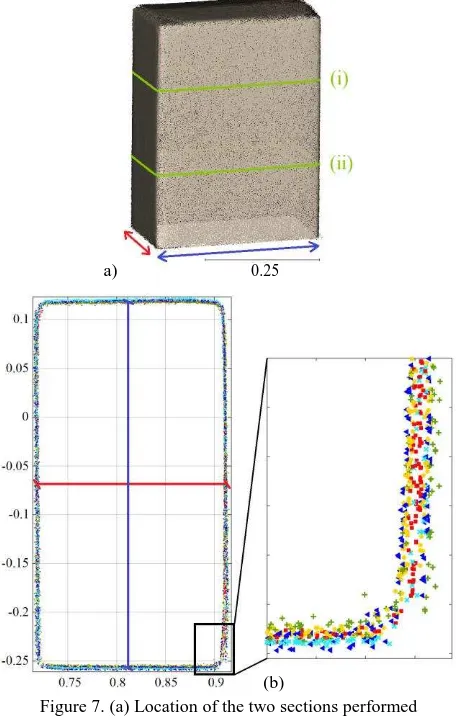
As shown in Figure 7a, two sections have been extracted at the same locations in the 25 point clouds. A first visual inspection consisting in the superimposition of five sections (Figure 7b) shows that the global geometry is respected since all sections present similar dimensions, but the sections do not perfectly overlap as illustrated by the zoom on a corner. Moreover, a thickness is visible on the sides of some sections, due to the presence of overlying layers of points. This unwanted aspect affects the global geometry of the considered point clouds.
To complete this visual inspection, measurements have been carried out between the middles of opposite sides, as depicted by the two lines in Figure 7b. For the box length (blue line), the estimated value varies between 37.2 and 37.8 cm with a standard deviation of 2 mm. A smaller standard deviation of 1 mm is computed for the width (red line), which has been
estimated between 19.3 and 19.8 cm. Depending on the expected precision within a project, this handheld scanner is assumed to provide repeatable results with a possible error of some millimeters.
a)
Figure 7. (a) Location of the two sections performed
in the point clouds of the box. (b) Superimposition of 5 colored sections (i). The surveyed distances are in blue (length) and red (width).
5. APPLICATION TO A REAL CASE STUDY
To complete the previously described laboratory experiments, acquisitions have been carried out in the field on archeological artefacts.
5.1 Context
Well-preserved artefacts have been discovered on a site in the North of France during preventive excavations, constituting impressive archeological finds. The engraved and sculpted stone blocks that have been found on this site were part of a monumental adorned façade of an Antique sanctuary during the Gallo-Roman epoch (2nd century A.D.). The blocks present various dimensions and consist of architectural details and decorative elements, but also human, divine or animal faces that compose remarkable statuary. The digitization of these well-preserved artefacts using photogrammetry, which was the chosen technique, aims at proposing a virtual reconstruction of the facade (Alby et al., 2017). Thus the point clouds captured with the Freestyle3D handheld scanner will only be used to assess the quality of the data it provides.
(b) 0.3
0.25
5.2 Data collection
As explained in the context presentation, point clouds of the artefacts have been collected not only using the handheld scanner, but also through image-based technique. This will make it possible to compare both datasets.
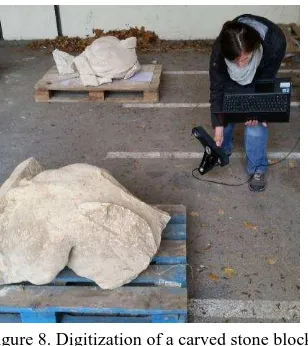
5.2.1 Acquisitions with the Freestyle3D have been performed as shown on Figure 8. The handheld scanner is slightly displaced around the blocks, and a particular attention is paid to avoid the presence of holes in the point clouds when complex parts are encountered. The dimensions of the considered stone blocks vary from about 1.2 × 0.7 × 0.5 m for the largest to 0.7 × 0.6 × 0.3 m for the smallest, thus their volumes are lower than 1 cubic meter. Because of the dimensions of the artefacts, it was possible to manage their digitization in one unique scanning pass that directly results in a complete point cloud of the considered artefact. A total of 10 blocks have been scanned with the Freestyle3D handheld scanner, from which 5 have been selected to be presented in this article due to their diversity in terms of geometry and details.
Figure 8. Digitization of a carved stone block using the Freestyle3D handheld scanner
For the largest and more detailed blocks, another protocol has been tested, consisting in the acquisition of 2 or 3 partial point clouds to be merged in a post-processing step. Besides the necessity to perform the registration as a supplementary treatment, most of the time corresponding point cloud areas do not perfectly overlap, which generates overlying layers of points. This effect is also sometimes observed while trying to get the whole geometry in one unique scan, as illustrated by the sections of point clouds of a box presented in Subsection 4.2. Nevertheless this method without registration is preferred when the object dimensions enable it, because of the time saved when the complete point cloud is directly captured. The registration protocol of several partial point clouds will be considered only when the geometry or the dimensions of the object do not make it possible to perform a unique acquisition.
5.2.2 A photogrammetric survey of the blocks has been
performed in parallel. For each block, between 100 and 200 pictures have been processed using Photoscan (Agisoft). More information about the acquisition and point cloud computation processes can be found in (Alby et al., 2017).
Due to the assumed higher accuracy of the point clouds obtained by image-based techniques, these datasets can be used as reference data to assess the quality of Freestyle3D issued point clouds.
5.3 Quantitative analysis of the produced point clouds
As shown in Table 9, the colored point clouds obtained with the Freestyle3D handheld scanner present a reliable visual aspect. Very fine details are well represented, even if they sometimes suffer from noise as depicted by the largest deviations visible for artefacts a), c) and e). Beyond this visual inspection, the idea is to assess the point cloud accuracy in order to conclude about the geometrical reliability of data captured using the Freestyle3D.
Cloud-to-cloud comparisons have been carried out between the previously described datasets and the ones obtained by image-based technique taken as references. For the cloud-to-cloud distance computations, the free software CloudCompare has been used. The color-coded deviations projected on the Freestyle3D point clouds can be visualized in Table 9 for the five blocks studied. The mean deviations are rather similar for the five blocks presented, varying between 1 and 2 mm. For almost each artefact, a standard deviation of 1 mm is computed. Thanks to these comparisons, it appears that the global geometry of the artefacts is respected in the point clouds captured using the Freestyle3D, presenting a millimetric accuracy.
5.4 Discussion
The practical case study presented before was useful to test some acquisition protocols in the field. It has shown that the handheld scanner is easy to use and delivers in a limited time colored and dense point clouds of the object under study.
Regarding the digitization of the investigated blocks, it was decided to capture their whole geometry in one unique acquisition as their volumes enable it. Nevertheless, merging of several point clouds to digitize one block makes it possible to reduce the presence of holes in the point clouds, especially for complex geometries. This may also reduce the risk of disrupting the acquisition, which is more prevalent while trying to capture the whole object in one time. For this reason, it was sometimes necessary to repeat the acquisition before being able to capture the whole surface, as the tracking can easily get lost when the geometry involves many displacements of the device around the object. However merging several point clouds may cause some thickness in the final point cloud on overlapping areas. In this second case, the result also strongly depends on the merging solution applied, and not only on the acquisition itself.
The main risk for objects with large dimensions being acquired in one time is the potential drift that may occur during the acquisition. The consequence is a mismatch of the digitized surfaces on recovering areas, producing overlying layers of points. This is visible on artefact b), where the green color on the left suggests that only this part of the side is not so close (deviation of about 5 mm) from the photogrammetric model.
Different computers have been used to perform the experiments presented throughout this paper. Variable scanning performances in terms of acquisition speed and loss of the tracking have been noted. This involved the repetition of the acquisitions in some cases especially during archeological artefact scanning, resulting in different point clouds. For this reason, using the tablet recommended by the manufacturer in the Freestyle3D technical documentation seems to be a good choice. It should be noted that we got access to these artefacts exclusively during one mission, thus performing further acquisitions using the recommended hardware combination was not possible.
Artefact
number Point cloud from Freestyle
3D Deviations in the point clouds compared to photogrammetric survey (distances in m)
a)
b)
c)
d)
e)
Table 9. Overview of the point clouds captured using the Freestyle3D scanner for the five considered artefacts, and investigation of their accuracy compared to point clouds produced during the photogrammetric survey.
6. CONCLUSION
The Freestyle3D is a recent handheld scanner that can be used to digitize objects and volumes up to some cubic meters. The experiments carried out all along this article lead to several conclusions, such as the growing presence of noise in the point clouds when the range increases. According to the obtained results, the measurements do not seem to be impacted by the color of the scanned object or by the incidence angle, even if large incidence angles increase the risk that the tracking gets lost. The stability of the reconstruction algorithm has been shown for scans performed with multiple passes, as well as for extended scanning duration.
The scanner has proved to be reliable to retrieve the global dimensions of simple geometrical shapes. Deviations of some millimeters can be observed when acquisitions are repeated on a same object, which may limit its usage as soon as high-precision acquisitions are required. Repeatability is mainly affected by the way the scanning process is handled, since a constant trajectory and a constant velocity are rarely achieved between two successive acquisitions. Another potential risk while repeating passes on the surface or when individual point clouds are registered is the presence of overlying layers of points. The user should be vigilant to this effect which creates a thickness on some areas of the point clouds.
The application of the Freestyle3D scanner to digitize archeological artefacts has highlighted its main benefits. Colored point clouds can be directly captured in a few minutes. Moreover the scanning process supported by the associated software is accessible to users without specific experience in the field of digitization, compared to photogrammetry where some rules have to be respected to generate satisfactory results. As regards the results achieved during the practical case study, the sensor appears to be a good alternative to photogrammetry for projects where a submillimetric precision is not expected. It is well suited for visualization purposes, offering in the same time a millimeter accurate and detailed geometry of the objects.
ACKNOWLEDGEMENTS
The authors would like to thank the colleagues from the National Institute for Preventive Archeological Research (INRAP, France) for giving us the opportunity to record the stone blocks from the Pont-Sainte-Maxence project (Alby et al.,
2017), as well as the “Fondation Groupe EDF” (France) for
financing these studies. The authors also would like to thank M.-A. Dhont, student in surveying involved in the experimental studies.
REFERENCES
Alby, E., Grussenmeyer, P., Guillemin, S., and Brunet-Gaston, V., 2017. Digitization of blocks and virtual anastylosis of an Antique facade in Pont-Sainte-Maxence (France). In: The International Archives of the Photogrammetry, Remote Sensing and Spatial Information Sciences, 26th CIPA Symposium, Ottawa, Canada.
Boehm, J., 2014. Accuracy investigation for structured-light based consumer 3D sensors. Photogrammetrie-Fernerkundung-Geoinformation, 2014(2), pp. 117-127.
Bouillod, A., Oggiano, L., Soto-Romero, G., Brunet, E., and Grappe, F., 2016. Preliminary study: A new method to assess
the effective frontal area of cyclists. In: 4th International Congress on Sport Sciences Research and Technology Support, Porto, Portugal, 6 pages.
Di Pietra, V., Donadio, E., Picchi, D., Sambuelli, L., and Spano, A., 2017. Multi-source 3D models supporting ultrasonic test to investigate an Egyptian sculpture of the Archaeological Museum in Bologna. In: The International Archives of the Photogrammetry, Remote Sensing and Spatial Information Sciences, Nafplio, Greece, Vol. XLII-2/W3, pp. 259-266.
Eiríksson, E. R., Wilm, J., Pedersen, D. B., and Aanæs, H., 2016. Precision and Accuracy Parameters in Structured Light 3-D Scanning. In: The International Archives of the Photogrammetry, Remote Sensing and Spatial Information Sciences, Berlin, Germany, Vol. XL-5/W8, pp. 7-15.
Grussenmeyer, P., Landes, T., Doneus, M., and Lerma, J.-L., 2016. Basics of range-based modelling techniques in Cultural Heritage. In: E. Stylianidis and F. Remondino (eds), 3D Recording, Documentation and Management of Cultural Heritage, Whittles Publishing, pp. 305-368.
Hu, Q., Wang, S., Fu, C., Ai, M., Yu, D., and Wang, W., 2016. Fine Surveying and 3D Modeling Approach for Wooden Ancient Architecture via Multiple Laser Scanner Integration. Remote Sensing, 8(270), 23 pages.
Kersten, T. P., Przybilla, H. J., Lindstaedt, M., Tschirschwitz, F., and Misgaiski-Hass, M., 2016. Comparative geometrical investigations of hand-held scanning systems. In: The International Archives of the Photogrammetry, Remote Sensing and Spatial Information Sciences, Prague, Czech Republic, Vol. XLI-B5, pp. 507-514.
Polo, M.-E., and Felicisimo, A. M., 2012. Analysis of Uncertainty and Repeatability of a Low-Cost 3D Laser Scanner. Sensors, 12, pp. 9046-9054.
Remondino, F., Grazia Spera, M., Nocerino, E., Menna, F., and Nex, F., 2014. State of the art in high density image matching. The Photogrammetric Record, 29(146), pp. 144-166.
Sánchez, A., Naranjo, J. M., Jiménez, A., and González, A., 2016. Analysis of Uncertainty in a Middle-Cost Device for 3D Measurements in BIM Perspective. Sensors, 16(1557), 17 pages.
Schnabel, R., Wahl, R., and Klein, R., 2007. Efficient RANSAC for Point-Cloud Shape Detection. Computer Graphics Forum, 26(2), pp. 214-226.
Soudarissanane, S., Lindenbergh, R., Menenti, M., and Teunissen, P., 2009. Incidence Angle Influence on the Quality of Terrestrial Laser Scanning points. In: The International Archives of the Photogrammetry, Remote Sensing and Spatial Information Sciences, Paris, France, Vol. XXXVIII-3/W8, pp. 183–188.
Voegtle, T., Schwab, I., and Landes, T., 2008. Influences of different materials on the measurements of a Terrestrial Laser Scanner (TLS). In: The International Archives of the Photogrammetry, Remote Sensing and Spatial Information Sciences, Beijing, China, Vol. XXXVII-B5, pp. 1061–1066. Zhang, W., Wang, C., and Xi, X., 2015. 3D Scan of Ornamental Column (Huabiao) Using Terrestrial LiDAR and Hand-held Imager. In: The International Archives of the Photogrammetry, Remote Sensing and Spatial Information Sciences, Taipei, Taiwan, Vol. XL-5/W7, pp. 491-494.