INVESTIGATION OF PARALLAX ISSUES FOR MULTI-LENS MULTISPECTRAL
CAMERA BAND CO-REGISTRATION
J. P. Jhan a, J. Y., Rau a, N. Haalab, M. Cramerb
a Dept. of Geomatics, National Cheng Kung University, No.1, University Road, Tainan City 701, Taiwan – [email protected], [email protected]
b Institute for Photogrammetry, Stuttgart University, Geschwister-Scholl-Strasse 24D, 70174 Stuttgart, Germany – [email protected], [email protected]
KEY WORDS: Multispectral, Multi-lens Camera, Band Co-registration, UAS
ABSTRACT:
The multi-lens multispectral cameras (MSCs), such as Micasense Rededge and Parrot Sequoia, can record multispectral information by each separated lenses. With their lightweight and small size, which making they are more suitable for mounting on an Unmanned Aerial System (UAS) to collect high spatial images for vegetation investigation. However, due to the sensor geometry of multi-lens structure induces significant band misregistration effects in original image, performing band co-registration is necessary in order to obtain accurate spectral information. A robust and adaptive band-to-band image transform (RABBIT) is proposed to perform band co-registration of multi-lens MSCs. First is to obtain the camera rig information from camera system calibration, and utilizes the calibrated results for performing image transformation and lens distortion correction. Since the calibration uncertainty leads to different amount of systematic errors, the last step is to optimize the results in order to acquire a better co-registration accuracy. Due to the potential issues of parallax that will cause significant band misregistration effects when images are closer to the targets, four datasets thus acquired from Rededge and Sequoia were applied to evaluate the performance of RABBIT, including aerial and close-range imagery. From the results of aerial images, it shows that RABBIT can achieve sub-pixel accuracy level that is suitable for the band co-registration purpose of any multi-lens MSC. In addition, the results of close-range images also has same performance, if we focus on the band co-registration on specific target for 3Dmodelling, or when the target has equal distance to the camera.
1. INTRODUCTION
Multispectral (MS) information, including visible (i.e. Red (RED), Green (GRE), and Blue (BLU)) and invisible (i.e. Rededge (REG) and Near Infrared (NIR)) spectral response, are indispensable in the application of precision agriculture. The derived vegetation index is the key to analyze the health of plants, in which more than 70 vegetation indices can be obtained by a combination of broadband and narrowband spectral information in the range 400–1050 nm (Agapiou et al., 2012). Therefore, utilizing multispectral cameras (MSCs) mounted on an UAS (Unmanned Aerial System) for vegetation investigation has the benefits of efficiency and convenience (Sankaran et al., 2015).
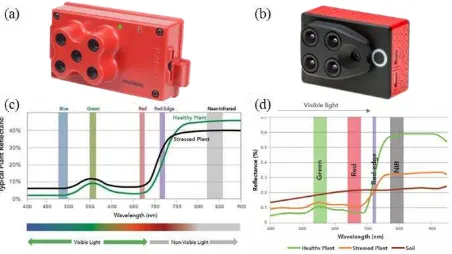
The recent developments of Micasense Rededge1 and Parrot Sequoia2 MSCs have received increased attention from remote sensing users due to both their smaller size and for being the lightest weight in the current market, and because the adopted narrow band is better suited to detecting the plants’ spectral reflectance. As shown in Figure 1 and listed in Table 1, these two cameras both have five lenses and the same sensor size and image resolution, but the Sequoia uses a shorter focal length to acquire a large field of view (FOV) for larger terrain investigation. Figure 1 also depicts the spectral response and bandwidth of Rededge and Sequoia, it shows that Rededge records discrete narrowband RED, GRE, BLU, NIR, and REG spectral information, but the Sequoia only records four narrowband multispectral bands without BLU, and another one can acquire a higher resolution broadband RGB image. Such a combination means that the Sequoia has the benefits of generating a high spatial resolution DSM through the RGB camera and generating orthoimages by triangulating the RGB and MS images together (Jhan et al., 2016).
1https://www.micasense.com/
Figure 1. Multispectral cameras. (a) Rededge. (b) Sequoia. (c) and (d) Spectral response of (a) and (b), respectively.
MSC Rededge Sequoia
Catagory MS MS RGB
Lenses 5 4 1
Focal length (mm) 5.5 3.98 4.88
Sensor size (mm) 4.8 × 3.6 4.8 × 3.6 6.2 × 4.6 Resolution (pixels) 1280 × 960 1280 × 960 4608×3456
Pixel size (µm) 3.75 3.75 1.34
FOV (H° ×V°) 47.1 × 36.2 62.2 × 48.7 64.6 × 50.8 Wavelengths Narrowband Narrowband Broadband Spectral range
(nm) 465–860 530–810 400–700
Bandwidth (nm) 10–40 10–40 100
Weight (g) 150 72
Sizes (cm) 12 × 7 × 5 6 × 4 × 3
Table 1. Specifications of Rededge and Sequoia.
2https://www.parrot.com/
1.1. Motivation and Objectives
The multi-lens structure of a MSC enables users to record discrete spectral bands using separated lenses and specific filters. The image planes are close parallel to each other in order to have the largest overlap ratio (i.e. 90–95%) for generating a multispectral cube. However, the obtained original multispectral images have significant band misregistration effects due to lens distortion and the differing positions and viewing angles of each lens. This results in geometric distortions and ghosting effects in the original multispectral images, which requires image registration for performing band co-registration correction to obtain accurate spectral information for subsequent remote sensing analysis.
Due to the recent developments of MSCs have made them smaller and lighter to meet the limited space and payload capacity of UAS. The number of lenses, spectral response, and viewing angles are differ to each other, to develop an image registration approach for each different multi-lens MSC is a tedious and unnecessary task. Therefore, the objective of this study is to propose a general solution that is adaptive and robust to deal with the band co-registration issues of different type of MSCs.
1.2. Literature Review
Image registration is a technique to transform different image materials into a reference image frame or a certain map projection. The material of images can be different focal length, image resolutions, viewing angles, spectral responses, map projections, and different time series. It has been widely used in band co-registration, image stitching, video stabilization, geolocation etc. Generally, image registration contains four main steps, i.e. (1) feature extraction, (2) feature matching, (3) image transformation, and (4) image interpolation (Brown, 1992; Zitová and Flusser, 2003).
Feature extraction and matching is to find conjugate points in the same area of images in order to construct the connection among images. The detected distinctive features can be corners, blobs or lines of image, which are matched using an area-based (e.g. least-square matching (Gruen, 1985)) or descriptor-based matching procedures (e.g. SIFT (Lowe, 2004), and SURF (Bay et al., 2008)). Therefore, the connection of images can be determined from an image transformation model, in which the coefficients of transformation model are computed through a least-square adjustment of conjugate points. Finally, image interpolation is used to preserve the image radiometric information after transformation.
Various image registration methods for MSCs band co-registration had been proposed in (Jhan et al., 2016; Kelcey and Lucieer, 2012; Laliberte et al., 2011; Li et al., 2015; Saalfeld et al., 2012; Suárez et al., 2009; Yang et al., 2014; Zhang et al., 2016). It shows that the proposed methodology are varies from case to case, since different feature detection methods and adopted image transformation models can be applied.
In addition, there are some software packages and open source program can perform band co-registration of MSCs as well. For example, intelliSky3 developed a software package for Sequoia vegetation index computation. It rely on the EXIF information (i.e. lens distortion, spatial offset, and rotation angles between lenses) of Parrot Sequoia for image transformation, and optimized by a feature point matching procedure. Another one is
3https://www.intelli-sky.com/
ImageJ4, which is an open source image processing program designed for scientific multidimensional images. Various image transformation model are implemented in the program, which utilize SIFT features for estimating the coefficients of image transformation. For the purpose of band co-registration, the elastic image transformation model is suggest to perform band co-registration.
However, we found there is insufficient analysis in related works. First, some researchers adopted similarity or affine transformation for band co-registration, which is unsuitable as all image planes are not exactly parallel. Second is lack of quantitative assessment, in which some researchers evaluate the co-registered images through visual comparisons, or the result is not good enough that larger than sub-pixel level. Fourth and last, the proposed method is only work on specific camera system that may not work on the others.
1.3. Research Methods and Experiments
In this study, we proposed a Robust and Adaptive Band-to-Band Image Transform (RABBIT) that has the following characteristics: (1) suitable for the band co-registration purpose of any MSC system, (2) accuracy assessment with sub-pixels ability are provided, (3) can preserve the center perspective projection geometry of camera for subsequent photogrammetry and remote sensing applications. The RABBIT majorly has three steps: (1) obtaining the camera rig information from camera system calibration, (2) utilizing the calibration results for performing image transformation and lens distortion correction, and (3) the last optimizing the results in order to acquire a better registration accuracy.
Meanwhile, in order to evaluate the performance of RABBIT, both aerial and close-range images acquired from Rededge and Sequoia are utilized for examinations.
2. RESEARCH MATERIAL
This chapter introduces the collected datasets of Rededge and Sequoia, the examples of band misregistration effects, and the examination conditions.
2.1. Datasets
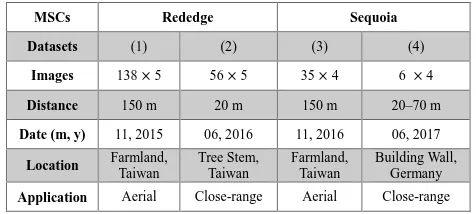
In order to examine the theory and evaluate the performance of the proposed RABBIT, bothRededge and Sequoia are utilized to collect aerial and close-range images. As listed in Table 2, four datasets were acquired with different acquisition dates, target distances, locations, and applications. Dataset (1) and (2) were acquired from same Rededge camera, in which dataset (3) and (4) were acquired from different Sequoia cameras.
MSCs Rededge Sequoia
Datasets (1) (2) (3) (4)
Application Aerial Close-range Aerial Close-range
Table 2. Information of collected multispectral datasets
4https://imagej.net/
2.2. Band Misregistration Effects
Samples of the original multispectral images for each dataset are demonstrated in Figure 2. We can observe that the original multispectral images have significant ghosting effects through false color rendering, in which the Micasense Rededge camera are the most serious. Meanwhile, we can also observe the band misregistration effects between each band caused different amount of band misregistration errors through animated multilayer images as depicted in Figure 3. This illustrates if no band co-registration were conducted, we cannot obtain accurate spectral information for remote sensing analysis.
Figure 2. Band misregistration effects via false color rendering. (a)–(d) are dataset (1)–(4).
Figure 3. Animated band misregistration effects. (Click the play button to watch the animation.)
2.3. Examinations
Two tests are conducted through the datasets listed in Table 2 to evaluate the proposed method, including aerial images examination and close-range images examination.
The aerial images examination is used to prove RABBIT is adaptive and robust for the band co-registration of various MSCs. Datasets (1) of Rededge, and (3) of Sequoia examine this, in which each camera has a different number of lenses and different number of band misregistration errors.
Since the parallax effect is the displacement of the same object viewed along two lines of sight, which represents a potential issue for the band co-registration of multi-lens MSCs. The different mounting positions of the lenses mean that the acquired multispectral imagery has a larger parallax effect for nearby objects compared to more distant objects. This effect can usually be ignored when mounting on a UAS platform, since the object distance is larger than the baseline of two different lenses. Performing band co-registration on the original multispectral imagery acquired from UAS can result in accurate and reliable results. However, the parallax effect becomes significant when images are taken from a shorter distance, especially for close-range applications where the distance between objects may various from a few meters to several hundreds of meters.
Therefore, close-range images examination is used to analyze the parallax effect of band co-registration errors in a close-range environment, which is performed through dataset (2) and (4). The images of dataset (2) were aimed at a tree stem from a distance of 3–5 m to calculate the Normalized Difference Vegetation Index (NDVI) (Rouse Jr, 1974) and reconstruct its 3D model. The dataset (4) were aimed at a building wall from 10-70 m with 10 m steps, which is to evaluate the how the distance difference affect the band co-registration results.
3. METHODOLOGY
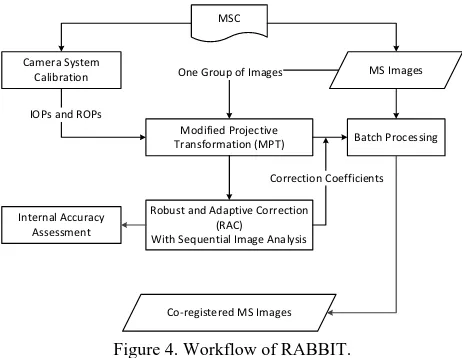
The workflow of RABBIT is shown in Figure 4. It utilizes a MPT model for image plane-to-plane transformation, in which all coefficients are estimated by camera system calibration. Since misregistration errors still exist after MPT, a robust and adaptive correction (RAC) procedure with sequential image analysis is applied to automatically compensate for various systematic errors in camera system calibration. Once we obtain the correction coefficients and camera has high synchronization rate, they can be applied to batch image processing for all images acquired during the same flight mission. If the synchronization rate is not stable, the correction is performed independently.
Modified Projective Transformation (MPT)
Robust and Adaptive Correction (RAC)
With Sequential Image Analysis MSC
Camera System Calibration
IOPs and ROPs
Batch Processing One Group of Images
Co-registered MS Images
Correction Coefficients MS Images
Internal Accuracy Assessment
Figure 4. Workflow of RABBIT.
3.1. Modified Projective Transformation (MPT)
MPT has been adopted for the band co-registration of MiniMCA-12 to transfer multi-sensor geometry into one sensor geometry (Jhan et al., 2016) and the multiple-image stitching of five consumer-grade camera imaging systems is used for large-area mapping (Rau et al., 2016).
Equations (1) and (2) are the mathematical functions of MPT, (��,��) and (����,����) are respectively the image coordinates of the original image sensor and after MPT, and �11–�33 are the elements of the rotation matrix for relative viewing angles between the reference image sensor and others. The lens distortion corrections of each image sensor are (∆�,∆�), and �� and ���� respectively represent the focal length of the original image sensor and the focal length of the co-registered image.
����=−�����11
(��+∆�) +�21(��+∆�)− ���31 �13(��+∆�) +�23(��+∆�)− ���33 (5) ����=−�����12
(��+∆�) +�22(��+∆�)− ���32 �13(��+∆�) +�23(��+∆�)− ���33
(6)
Therefore, band misregistration errors caused by the differences in lens distortion and viewing angles among lenses can all be
corrected simultaneously through MPT, in which the reference image sensor only corrects the lens distortion effect and focal length difference. The image size of MPT is as same as the reference image, meaning that it can keep the image resolution, pixel size and center perspective projection of original image’s geometry
3.2. Camera System Calibration
All the coefficients of MPT are estimated by camera system calibration instead of image matching. This approach is used to calibrate the interior orientation parameters (IOPs, i.e. focal length, principle point coordinates, radial lens distortion parameters, and decentering lens distortion parameters) of each camera for lens distortion correction (∆�,∆�). Moreover, it is used to obtain the relative rotation angles (omega, phi, and kappa) between the reference image sensor and the others to derive the rotation matrix elements (�11–�33) of MPT. Compared with image matching that is used to compute the coefficients from the conjugated points of different bands, camera system calibration has the benefit of obtaining reliable results and rapid image processing efficiency, as image matching may fail when selecting different spectral matching pairs where the spectral response for a vegetation area differs.
3.3. RAC
Due to the uncertainty in the camera system calibration meant that slight band co-registration errors (∆����, ∆����) between two different bands still existed after MPT. In order to understand the systematic effects, we simulated the calibration uncertainty of different factors, including focal length and radial lens distortion respectively has 0.2% and 0.01% difference, and the relative rotation angles (omega, phi, and kappa) were 0.1, 0.1, and 0.03°. The simulation value of each factors was within three times the posterior standard errors after the camera system calibration except for the focal length, which was enlarged 20-fold for better visualization.
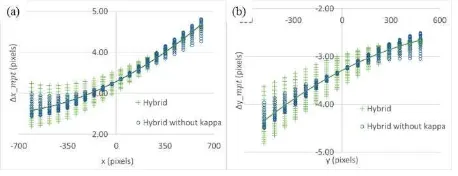
Figure 5 shows the hybrid simulation with and without kappa angle. We can observe there are quadric, scale, and displacement effects after MPT if there is a certain camera calibration uncertainty. These two hybrid errors have a similar pattern but the one without the kappa angle error has a smaller error range. Nevertheless, both hybrid effects have the same best fitting curves, meaning that we can first correct the quadric, scale, and displacement errors through quadratic correction for both x and y directions, then estimate the remaining rotation angle for further correction.
Figure 5. Simulated error distributions in x and y directions. (a) x direction. (b) y direction.
The developed RAC is used to correct the hybrid effects, including the quadric, scale, displacement, and rotation errors caused by uncertainty in the camera system calibration. Equations (3)–(5) are mathematical forms of the RAC in which equations (3) and (4) are the quadratic functions used to correct
the quadric (���,���), scale (��,��), and displacement (��,��) errors in the x and y directions, respectively. Their respective coefficients are obtained through the quadric best fitting of error distributions in the x and y directions. After that, equation (5) can be applied to estimate the error in the kappa angle (�). In which the vector �⃗ (�,�) denotes the image coordinates of a feature point on the reference image, while the vector Δ����⃗r (∆����,∆����) is the image coordinates of the corresponding feature point on the other band with kappa angle error. This results in an isosceles triangle where the length of the two legs and the base are respectively |�⃗| and �Δ�����⃗�. Therefore, we can obtain the base angle from the dot product of the two vectors, and compute � through equation (5). Since one matched point pair can obtain one value, the final kappa angle (�) is averaged through the computed results for all pairs.
�=����+���× (∆����)2+��×�∆�����+�� (3) �=����+���× (∆����)2+��×�∆�����+�� (4)
�= 180−2 × cos−1� �⃗∙Δr����⃗
|�⃗|×�Δ������⃗�� (5)
Therefore, the remaining band co-registration errors caused by uncertainty in the camera system calibration can be adaptively optimized through the proposed RAC if the error distributions between the different bands can be obtained through an image matching procedure. We can obtain correction coefficients for the images acquired in the same flight mission by performing RAC on one group of MS images, and applying the same coefficients to the other groups of MS images through batch image processing if the camera rig is stable.
3.4. Sequential Image Analysis
Sequential image analysis is used to ensure that the image matching procedure can find a sufficient number of conjugate points between different spectral bands to perform RAC. This is because the image matching procedures works well on RGB images, but it is still a challenge task for MS images since the feature extraction results may be different for two different spectral bands. To conquer that, coarse-to-fine approach for image matching are suggest for narrow band multispectral images (Vakalopoulou and Karantzalos, 2014; Ye and Shan, 2014).
3.4.1. Image Matching Sequence: The coarse-to-fine approach is to find an image matching sequence that has maximum similarity of spectral response. The image matching sequence of Rededge camera is REG vs. NIR, REG vs. RED, RED vs. GRE, and RED vs. BLU, where REG is chosen as the reference band. As with Rededge, Sequoia utilizes the same reference band and image matching sequence, except it has no RED vs. BLU. Therefore, RAC is first respectively performed on REG vs. NIR and REG vs. RED to correct the NIR and RED bands, we can then utilize the corrected RED band to correct the GRE and BLU bands. Although error propagation in the image matching sequence is unavoidable, this approach can increase the success rate of image matching that has the minimum error propagation times. In this study, SURF (Bay et al., 2008) feature– based matching is adopted for image matching where blunders are removed if the residual is located outside three times the standard deviation after quadratic curve best fitting. The band co-registration accuracy between two bands can thus be evaluated by the average length of errors (∆����, ∆����).
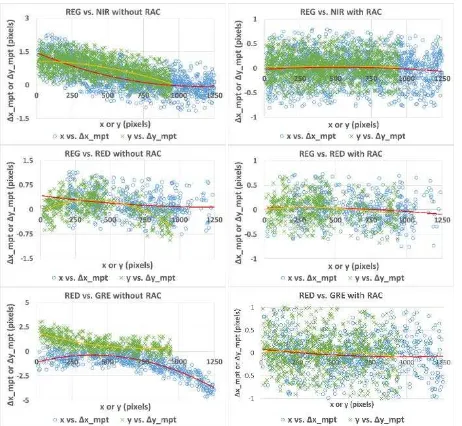
3.4.2. Examples of RAC correction: Examples of error distributions after the sequential image analysis of the Parrot Sequoia dataset (3) are depicted in Figure 6. The red and yellow lines are respectively the best fit curves of the error distributions in the x (blue circle) and y (green cross) directions. This shows that the quadratic effects are similar to the simulated hybrid error effects, as illustrated in Figure 5. Sequential image analysis and applying RAC to each matching pair shows how the systematic errors have mostly been eliminated and the remaining error distributions are all within ±1 pixels. However, the errors after applying RAC still appear uniformly distributed, which is due to the inherent limitation of feature points image matching.
Figure 6. Sequential image analysis of the dataset (3).
4. RESULTS AND ANALYSIS
Before analyses the performance of RABBIT, the comparisons of band co-registration results between different methods are discussed here. Due to intelliSky can perform the band co-registration of Sequoia, in which ImageJ can deal with all camera system. In order to compare the differences of co-registered images, we adopt Sequoia dataset (3) for visual comparison. Due to the obtained result of intelliSky can only provide vegetation index instead of co-registered images, the results of ImageJ and RABBIT are first co-registered and then calculated the same vegetation index for visual comparison.
Figure 7. Visual comparisons of Parrot Sequoia band co-registration results from different methods. (a) intelliSky. (b)
ImageJ. (c) RABBIT. (d)-(e) The enlarged area of the red rectangle in (a)-(c).
As shown in Figure 7, which is the NDVI derived after band co-registration. We can observe that RABBIT is outperform than intelliSky and ImageJ, in which the intelliSky is the worst. The reason is as depicted in the enlarged red rectangle areas, it shows that a sharpen edge on road marking can be observed on the results of intelliSky and ImageJ, meaning there is misregistration effect induces inaccurate NDVI value.
4.1. Results of Camera System Calibration
As listed in Table 3, we summarize the calibration results of Rededge and Sequoia, including the range of IOPs and the range of mean valuesand their standard deviations of ROPs. From the table, we observe the following points:
IOPs
Dataset (1) and (2) (3) (4)
MSCs Rededge Sequoia Sequoia
�� (mm) 5.50 ~ 5.54 3.96 ~ 3.98 3.96 ~ 3.99 �p (pixels) -22.9 ~ 18.1 21.3 ~ 32.1 18.9~ 30.2 �p (pixels) -8.9 ~ 15.6 -4.3 ~ 22.9 -20.7 ~ -11.5
Max. radial distortion
(pixels)
14.6 ~ 16.0 245.5 ~ 248.0 244.7~251.5
ROPs
Rededge Sequoia Sequoia
om
ega Mean -0.039 ~ 0.450 -0.215 ~ 0.213 0.069 ~ 0.112 Std. 0.012 ~ 0.028 0.011 ~ 0.013 0.024 ~ 0.041
p
hi Mean -0.299 ~ 0.150 -0.215 ~ 0.019 -0.014 ~ 0.310 Std. 0.011 ~ 0.030 0.009 ~ 0.014 0.010 ~ 0.017
kapp
a Mean -0.278 ~ 0.045 0.011 ~ 0.019 -0.087 ~ -0.031
Std. 0.008 ~ 0.021 0.003 ~ 0.007 0.005 ~ 0.006
Table 3. Calibrated IOPs and ROPs
4.1.1. IOPs: (1) The focal length among lenses of each MSC is different, it is thus necessary to find a common focal length (����) for eliminating the scale difference. (2) The lens distortion of Sequoia is the most significant as a shorter focal length is adopted. This demonstrates that lens distortion correction is important and needs to be addressed during band co-registration. (3) The lens optical axis of each MSC has significant offset in the x and y direction. For example of Rededge, it has offset of -1.7– 1.4% of image height in x direction, which will induce -22–18 black pixels on the bottom and top of image after MPT.
4.1.2. ROPs: (1) The values of relative rotation angles (omega and phi) are not zero, meaning that the image planes among lenses of each MSC are not exactly parallel. This proves that choosing MPT model is correct for MSC band co-registration. (2) The different Sequoia cameras have different relative rotation angles, meaning that we cannot use the ROPs of one camera to apply to another. (3) The maximum standard deviation among all relative rotation angles is less than 0.04°. This means the calibration accuracy is high, but will still induce different systematic error affects.
Since the correction of rotation, lens distortion, and optical center will introduce invalid pixels around the image border, the image size of the band co-registered images after RABBIT are automatically adjusted to preserve the central perspective projection and keep the maximum contents. The image sizes of the Rededge and Sequoia were cropped to 1210 × 920 and 1280
× 960 pixels with respective adjusted focal lengths of 5.5 and 4.0 mm. Therefore, the image geometry after RABBIT was still suitable for processing through a conventional digital photogrammetric workstation.
4.2. Band Co-registration Results
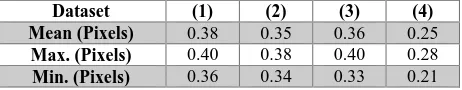
The band co-registration results of each dataset are demonstrated in Figure 8 and Figure 9. The corresponding accuracies are listed in Table 4, which summarizes the mean, maximum (Max.), and minimum (Min.) values among different spectral band image pairs. From the figures and accuracy assessment, we can observe the band misregistration are eliminated after RABBIT, and can achieve sub-pixels accuracy. Meanwhile, compare Figure 8 (c) and (d) with Figure 2 (c) and (d), it shows that the significant distortion effects are corrected, meaning that the obtained co-registration images has no lens distortion effects. Further discussion regarding the examination of aerial images and close-range images are introduced in the following.
Figure 8. Band co-registration results via false color rendering. (a)–(d) are dataset (1)–(4).
Figure 9. Animated band co-registration results. (Click the play button to watch the animation.)
Dataset (1) (2) (3) (4)
Mean (Pixels) 0.38 0.35 0.36 0.25
Max. (Pixels) 0.40 0.38 0.40 0.28
Min. (Pixels) 0.36 0.34 0.33 0.21
Table 4. Accuracy assessment of each datasets.
4.3. Aerial Images Examination
This examination is utilized to prove that RABBIT has the ability for compensating the systematic errors and can be applied for different type of MSCs.
As shown in Figure 10, the labels A and B respectively represent the Rededge and Sequoia cameras, which correspond to the datasets (1) and (3). A0 and B0 are the results after MPT without further correction, in which A1 and B1 are the results after applying RAC. It shows that the band co-registration accuracies of Rededge and Sequoia when RAC was applied had respectively improved from 0.80–1.37 to 0.34–0.38 pixels and 0.49–1.63 to
0.34–0.43 pixels. The results prove that the proposed RABBIT can adaptively compensate for the uncertainty of the camera system calibration, which has uncertainty value of relative rotation angles range in 0.003–0.041degrees.
Figure 10. Band co-registration accuracy of dataset (1) and (3) with and without RAC.
4.4. Close-range Images Examination
The purpose of this examination is to evaluate the influence of the parallax effect for band co-registration in a close-range environment. This is conducted on dataset (2) and (4), in which the images respectively aimed on a tree stem and a building wall.
4.4.1. The imaging distance to the tree stem and the farthest background is in the approximate range of 3–50 meters. As shown in Figure 11 (a), the result of this is fine co-registration on the tree stem with an average accuracy of 0.38 pixels, but larger band misregistration errors of 2.11 pixels remain for background objects. This demonstrates the parallax issue will lead to inconsistent results of band co-registration if the variance of target distance is high. Nevertheless, the band co-registration of tree stem is acceptable for spectral analysis.
Since RABBIT can preserve the center perspective geometry and the co-registration results of tree stem is acceptable, we can thus utilize the co-registered images to generate a 3D NDVI model through Agisoft Photoscan software. For example, we can use REG images as a reference band to generate the 3D tree model. Then, we replace the image texture by NDVI, which is computed from each band co-registered image group. The 3D tree models of the REG band and NDVI are respectively depicted on the left and right hand sides of Figure 11 (b). Thus, it allows a user to measure and visualize the NDVI information of a tree in 3D.
Figure 11. Band co-registration analysis of close-range application and reconstructed 3D NDVI tree model.
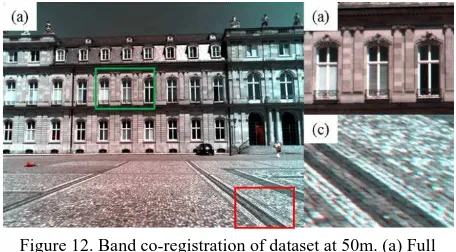
4.4.2. Building Wall: The distance from the building wall is range from 20–70 meters. Figure 8 (d) already show a result of 20 m, and nearly no misregistration can be observed. However, if we look into the result of 50 m as depicted in Figure 12, it shows that band co-registration has good performance on the building wall, in which misregistration effect can be observed on the ground. This is due to the distance between the building wall and the ground target has about 50 m difference. The parallax induce inconsistent misregistration, which can only obtain accurate band co-registration on partial part of image.
Figure 12. Band co-registration of dataset at 50m. (a) Full image. (b) Fine co-registration on building wall. (c)
Misregistration on the ground.
5. CONCLUSIONS
Utilizing MSCs mounted on an UAS for vegetation investigation has the benefits of high efficiency and convenience, but these cameras are restricted by the band misregistration error of the adopted multi-lens structure, which leads to inaccurate spectral observation. In this study, we proposed an image registration method, named RABBIT, which utilizes the camera rig information for image transformation, and together with a correction procedure to compensate the systematic errors caused from the uncertainty of camera system calibration.
In order to evaluate the performance, both aerial and close-range images acquired form Rededge and Sequoia MSCs are utilized to perform band co-registration. From the aerial images examination, it shows that RABBIT is suitable for different types of MSCs that it could achieve sub-pixel band co-registration accuracy. In addition, RABBIT also prove it has better band co-registration results when compare with the current software package and open source program. As for the close-range images examinations, due to the parallax introduces inconsistent misregistration errors when the distance between object and image are different. Unlike global fine co-registration in aerial images, RABBIT can only obtain fine co-registration on partial images where the distance to the image are the same.
In summary, we proposed a general solution for the band co-registration of MSCs that has the benefits of robustness and high accuracy. The proposed RABBIT can also be applied for band co-registration in future MSC products if the camera rig information has been calibrated.
REFERENCES
Agapiou, A., Hadjimitsis, D., Alexakis, D., 2012. Evaluation of broadband and narrowband vegetation indices for the identification of archaeological crop marks. Remote Sensing 4, 3892.
Bay, H., Ess, A., Tuytelaars, T., Van Gool, L., 2008. Speeded-Up Robust Features (SURF). Computer Vision and Image Understanding 110, 346-359.
Brown, L.G., 1992. A survey of image registration techniques. ACM Comput. Surv. 24, 325-376.
Cho, W., Schenk, T., 1992. Resampling Digital Imagery to Epipolar Geometry, IAPRS International Archives of Photogrammetry and Remote Sensing, pp. 404-408.
Gruen, A., 1985. Adaptive least squares correlation: a powerful image matching technique. South African Journal of Photogrammetry, Remote Sensing and Cartography 14, 175-187.
Jhan, J.-P., Rau, J.-Y., Huang, C.-Y., 2016. Band-to-band registration and ortho-rectification of multilens/multispectral imagery: a case study of MiniMCA-12 acquired by a fixed-wing UAS. ISPRS Journal of Photogrammetry and Remote Sensing 114, 66-77.
Kelcey, J., Lucieer, A., 2012. Sensor Correction of a 6-band multispectral imaging sensor for UAV remote sensing. Remote Sensing 4, 1462-1493.
Laliberte, A.S., Goforth, M.A., Steele, C.M., Rango, A., 2011. Multispectral remote sensing from unmanned aircraft: image processing workflows and applications for rangeland environments. Remote Sensing 3, 2529-2551.
Li, H., Zhang, A., Hu, S., 2015. A multispectral image creating method for a new airborne four-camera system with different bandpass filters. Sensors 15, 17453.
Lowe, D., 2004. Distinctive Image Features from Scale-Invariant Keypoints. International Journal of Computer Vision 60, 91-110.
Saalfeld, S., Fetter, R., Cardona, A., Tomancak, P., 2012. Elastic volume reconstruction from series of ultra-thin microscopy sections. Nat Meth 9, 717-720.
Sankaran, S., Khot, L.R., Espinoza, C.Z., Jarolmasjed, S., Sathuvalli, V.R., Vandemark, G.J., Miklas, P.N., Carter, A.H., Pumphrey, M.O., Knowles, N.R., Pavek, M.J., 2015. Low-altitude, high-resolution aerial imaging systems for row and field crop phenotyping: a review. European Journal of Agronomy 70, 112-123.
Suárez, L., Zarco-Tejada, P.J., Berni, J.A.J., González-Dugo, V., Fereres, E., 2009. Modelling PRI for water stress detection using radiative transfer models. Remote Sensing of Environment 113, 730-744.
Yang, C., Westbrook, J., Suh, C., Martin, D., Hoffmann, W., Lan, Y., Fritz, B., Goolsby, J., 2014. An airborne multispectral imaging system based on two consumer-grade cameras for agricultural remote sensing. Remote Sensing 6, 5257-5278.
Zhang, J., Yang, C., Song, H., Hoffmann, W., Zhang, D., Zhang, G., 2016. Evaluation of an airborne remote sensing platform consisting of two consumer-grade cameras for crop identification. Remote Sensing 8, 257.
Zitová, B., Flusser, J., 2003. Image registration methods: a survey. Image and Vision Computing 21, 977-1000.