BORDERLINES: MAPS AND THE SPREAD OF THE WESTPHALIAN STATE FROM
EUROPE TO ASIA PART ONE – THE EUROPEAN CONTEXT
Steve Pickering∗
Graduate School of Law, Kobe University, 2-1 Rokkodai-cho, Nada-ku, Kobe 657-8501 Japan [email protected], http://www.stevepickering.net
∗This research is funded by the Konosuke Matsushita Memorial Foundation, Grant Number 13-G40
KEY WORDS:Borders, maps, Westphalia, state, Europe, Asia
ABSTRACT:
For researchers and students of International Relations (IR), one date looms larger than all others: 1648. The end of the Thirty Years War, formalised by the signing of the Treaties of Osnabr¨uck and M¨unster, led to a period known as the ‘Peace of Westphalia.’ Westphalia represented a fundamental change in the power balance of European politics: instead of the Holy Roman Empire holding supreme authority, power would now rest with states themselves, manifested in terms of sovereignty, territory and equality. One of the chief ways in which these ‘Westphalian’ states would cement this authority was through the use of maps. Before 1648, there was little on a European map to indicate where one country ended and another one began. But after 1648, this all changes: these new Westphalian states are represented with bright colours and clearly marked boundaries, defining borders and becoming an important part in creating the state and justifying its sovereignty. The role which maps have played in the spread of the Westphalian state is only just beginning to be researched. Yet the limited efforts to date have all focussed on Europe. This is unfortunate, as today, while Europe has, according to some observers, moved into a stage in which Westphalia is no longer a useful model with which to understand the state and the ways in which it relates to sovereignty, government, power and the individual, the old Westphalian model of the state has more recently been exported all around the world. Many have contended that while the Westphalian state is no longer relevant to Europe, it was never relevant to the rest of the world. In existing work, the researcher has mapped the spread of the Westphalian state in the twentieth century, using Geographic Information Systems (GIS; see Pickering 2012). This paper, while complementary to the earlier research, will employ a quite different methodology. Having studied hundreds of European maps provided by European libraries, it is clear that the nature of cartography changes before and after 1648: political maps are seen as serving a different purpose (that of solidifying the state) and accordingly, they start using ‘all the tricks of the cartographic trade - size of symbol, thickness of line, height of lettering, hatching and shading, the addition of color’ (Harley 1989: 7). This paper will present findings on the representation of borders on European maps. However, it will do this with the aim of establishing the groundwork for a second project: to analyse the ways in which European maps have influenced how Asian borders are delimited, delineated and demarcated.
1 INTRODUCTION
Throughout the history of cartography, maps have been used to present numerous fictions as reality. This should not necessar-ily come as a surprise; Monmonier (1991: 1) aruges that ‘[n]ot only is it easy to lie with maps, it’s essential’ in his entertainingly titledHow to Lie with Maps. Yet maps are perceived by many people to be unbiased truths (Neocleous 2003: 417421). Indeed, Culcasi argues that ‘a map’s power relies on the myth that a map is an objective, scientific representation of reality’ (Culcasi 2006: 685). One such objective, scientific representation of reality is presented in Figure 1. This is the CIA’s ‘political’ map of Europe for 2012. Each state can be quickly identified thanks to the bright, solid colours and, as can be seen in the detail from the Franco-Spanish border in the lower part of the Figure, the black lines separating each state from its neighbours.1 Yet political maps have not always looked like this.
The recently emerged field of critical cartography gives us the tools to look at maps and try to understand the power they have over our sense of place in the world. This is important: when historical maps are presented as evidence by states arguing over territorial sovereignty of islands or border regions, we can see the remarkable power that maps have. Yet to date, no research has looked at the changing nature of maps at a key period in the history of International Relations – 1648 – and the effect that this
1In CIA maps, black lines are purely for land-based international
boundaries. The points at which states face the sea are outlined in blue.
has had on cartography, and by extension, international politics, today.
2 1648: THE YEAR THE WORLD CHANGED
For researchers and students of International Relations, one date looms larger than all others: 1648. The end of the Thirty Years War, formalised by the signing of the Treaties of Osnabr¨uck and M¨unster, led to a period known as the ‘Peace of Westphalia.’ Westphalia represented a fundamental change in the power bal-ance of European politics: instead of the Holy Roman Empire holding supreme authority, power would now rest with states them-selves, manifested in terms of sovereignty, territory and equality.2
It is the argument of this paper that one of the chief ways in which these ‘Westphalian’ states would cement this newly-found au-thority was through the use of maps. Broadly, before Westphalia, there was little on a European map to indicate where one country ended and another one began. But after Westphalia, this begins to
2In reality, the Treaties of Osnabr¨uck and M¨unster say relatively
lit-tle about these key concepts, yet most of the IR community takes it as a matter of faith that they do. One notable exception to this is Krasner (2004) who insists on referring to ‘Westphalian/Vatellian’ sovereignty, as concepts such as non-intervention were not expressed until a century af-terWestphalia, by the works of Swiss jurist Emmerich de Vattel in 1758. Nevertheless, there is no doubt that Westphalia represents a key moment in European history where a power shift occurs and new concepts regard-ing state supremacy and fixed borders over defined territory are devel-oped.
The International Archives of the Photogrammetry, Remote Sensing and Spatial Information Sciences, Volume XL-4/W3, 2013 ISPRS/IGU/ICA Joint Workshop on Borderlands Modelling and Understanding for Global Sustainability 2013,
Figure 1: CIA, 2012,Europe
change: these new Westphalian states are represented with bright colours and clearly marked boundaries, defining borders and be-coming an important part in creating the state and justifying its sovereignty.
Much of the developing field of critical cartography has focussed to date on Europe. This is unfortunate, as today, while Europe has, according to some observers, moved into a ’post-modern’ stage in which Westphalia is no longer a useful model with which to understand the state and the ways in which it relates to sovereignty, government, power and the individual, the old Westphalian model of the state has more recently been exported all around the world. Indeed, as can be seen in Figure 2, the majority of the world can today be considered to be part of a ‘Westphalian state.’
Many have contended that while the Westphalian state is no longer relevant to Europe, it was never relevant to the rest of the world (see, for instance, Blake 2000). This paper will look at the ways in which a particular type of map has come to dominate the nar-rative. Such maps are usually referred to as ‘political maps,’ but as all maps are ‘political’ it perhaps makes more sense to refer to them as ‘Westphalian maps.’ The emphasis in this paper will be maps of Europe; these will establish the groundwork for future research which will look at the spread of Westphalian maps from Europe to Asia.
3 CAVE! HIC DRAGONES!– BEWARE! HERE BE
DRAGONS!
Black (1997) argues that the borders between states became in-creasingly important towards the end of the eighteenth century. It is worth quoting him at length:
Many European ‘frontiers’ were, as in Spain af-ter the dynastic union of Castile and Aragon (1479) or
Figure 2: The spread of Westphalia, produced as part of a separate GIS project. Pickering, 2012.
Figure 3: The fearsome Pistrum or Phiset: detail from Olaus Magnus, 1572,Carta Marina
Britain after the union of Scotland and England (1603, 1707), essentially domestic-political, most commonly judicial and financial, rather than of any international significance... This mental world changed apprecia-bly as the impetus that the French Revolution gave to nationalism from 1789 altered European political con-sciousness, but already, prior to that, the increasing de-mands of sovereign states helped to reconfigure power relationships within their boundaries, thus making the areas comprehended by state frontiers on maps more real as units.
– Black 1997: 130.
The argument of this paper is that there is indeed much evidence to show that maps were changing to reflect these ‘increasing de-mands of sovereign states’ as far back as the seventeenth century, and that we see an acceleration of this process after the Peace of Westphalia in 1648.
4 BORDER TYPES
which we can see the evolution of the political map. Starting in 1568, this typology of maps and borders is presented below.
4.1 No obvious border
The first type of European political map is one in which there are no obvious borders: there are no dotted/ dashed lines and there is no use of colour. Mountains and rivers, two types of tradi-tionalbona fideboder, are presented, but they do not necessarily indicate the presence of a border. The mapEuropæ brevisby an unknown cartographer, presented in Figure 4 provides a good example.
Figure 4: Unknown cartographer, 1568,Europæ brevis: No obvi-ous border
4.2 Dotted/ dashed border
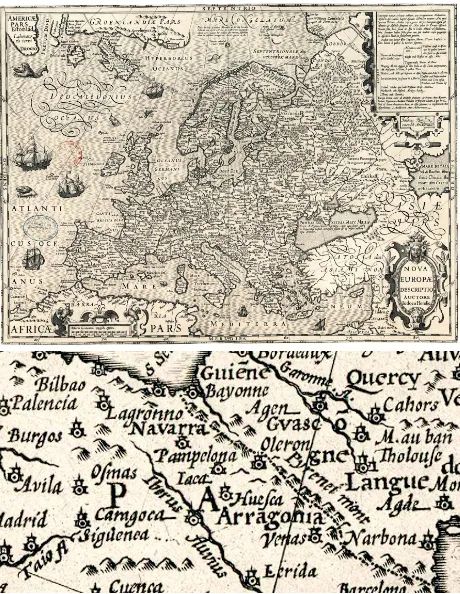
Next, we have dashed or dotted borders. The 1611 map by Jodocus Hondius the elder,Nova Europæ, presented in Figure 5 serves as an example here. Notice how, again, there is no use of colour. This does not mean that a coloured version of this map does not exist; it means instead that the researcher has not found one. The colouring of maps was very much an ‘optional extra’ and it is apparent that many people chose not to pay for this extra ser-vice.Ceteris parabus, we would not expect the colouring of maps to change over time, yet as time progresses, maps become more colourful in several ways, as will be seen.
4.3 Two colour border
As was shown at the beginning of this paper, international bound-aries are presented on CIA maps in black. In a sense, this black line can be imagined as occupying a thing strip of no-man’s land; neither belonging to state A or state B. In a sense, it is hardly surprising that the CIA chooses to represent borders in this way: this is indeed a very good representation of the border between the United States and Canada. The black line takes on a very real
Figure 5: Jodocus Hondius (the elder), 1611, Nova Europæ: Dashed border
sense in this boundary: the actual border between the US and Canada is maintained by a separate body called the International Boundary Commission which is responsible for maintaining the integrity of this boundary. One of the ways in which it does this is by chopping down all the trees when they come within three metres of either side of the boundary.
But the ‘no-man’s land’ is not the only, and nor is it the oldest, way of presenting a map on a page. The next step in the evolution of the European political map is the two-colour border. Figure 6 presents such a map, and in the detail, we can see the border between France and Spain: France’s border is pink, while Spain’s border is green. The pink line indicates ‘this is where France ends’ while the green line would suggest ‘and here is where Spain begins.’ The detail shows that the watercolour artist does not give as much care and attention as the cartographer creating the original engraving: at one point the two lines separate, while at another point, they overlap.
4.4 Two colour border and solid colour states
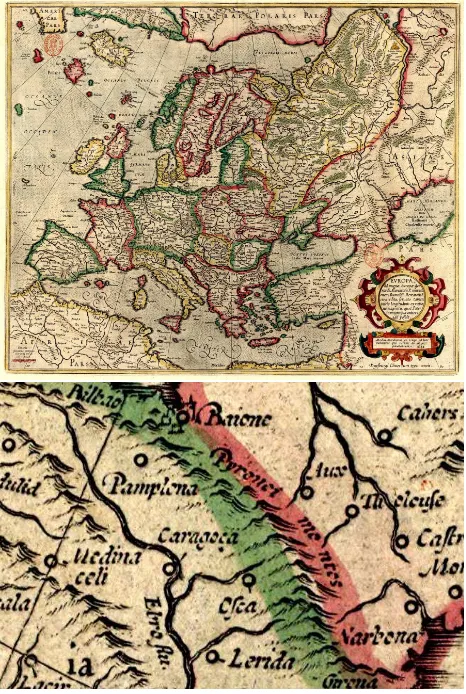
The next big evolution in the European political map is the use of solid colour. Sanson’s 1651 map, just three years after West-phalia, gives a good example (see Figure 7). As has been said, the use of colour in European maps is certainly not new in the seventeenth century. What is new, however, is the use of solid colours to represent the states, with two colour borders to show the boundaries. Here, this is suggesting that the states have uni-form sovereignty or control over a defined territory.
4.5 Tricks of the cartographic trade
As has already been mentioned, while the cartographers them-selves tend to be very careful in creating their map engravings, The International Archives of the Photogrammetry, Remote Sensing and Spatial Information Sciences, Volume XL-4/W3, 2013
Figure 6: Unknown cartographer, 1630,Europa: Two-colour bor-der
the water-colour artists are less so. For various legal and political reasons, the CIA often writes the words ‘boundary representa-tions are not necessarily authoritative’ on its maps, and this is certainly true in Figure 8. The two details are taken from an iden-tical engraving, but have been watercoloured separately. The de-tail on the left determines that Lusace was a part of Bohemia in 1700, while the detail on the right excludes it, and also paints a redundant line on a Bohemian-Moravian mountain range.
But a more obvious case of slapdash water-colour borders can be seen in the detail from an unknown sixteenth century map pre-sented in Figure 9. Here we see that they sea-facing boundary of Spain has been painted in a very haphazard way, at certain points not even touching the land in Spain.
5 FINDINGS: EUROPE
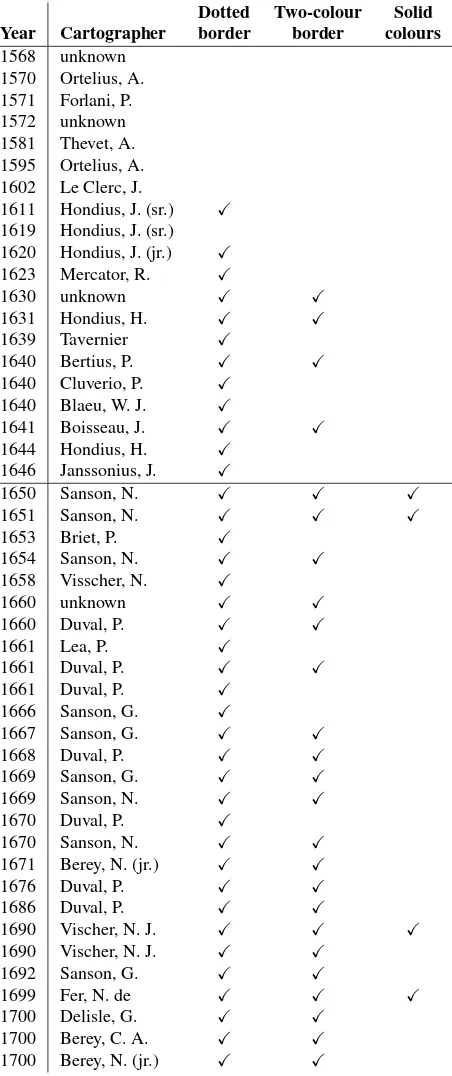
Now that the different types of border representation have been introduced, it is possible to present findings on the distribution of border types across time (see the Table in the Appendix). As can be seen, the frequency of two-colour borders and solid state colour increases after Westphalia (1648).
6 FUTURE RESEARCH: CHINA, JAPAN AND TAIWAN
This paper serves as a foundation on which to research maps in Asia. When did Asian maps start following European bor-der standards? Are Westphalian borbor-ders appropriate within an
Figure 7: Nicolas Sanson, 1651, L’Europe: Two-colour border and solid-coloured states
Figure 8: Guillaume Delisle, 1700,L’Europe: Same engraving, different water-colour borders
Asian context? To answer these questions, maps will be studied in China, Japan and Taiwan.
7 CONCLUSION
chill-Figure 9: Unknown cartographer, c. 16th century, map of Roman Catholic states
ing words Ratko Mladi´c, currently on trial at the Hague for crimes against humanity and genocide, who said that ‘borders are always drawn in blood.’ Fundamentally, we need to ask why lines are drawn on the page in the way they are. Blake (2000: 10) argued that ‘[i]f regions beyond the reach of central government could be plotted on a world map they would provide graphic evidence that the old state system is diseased.’ The remit of governments has always varied across territories and governments. It has been the argument of this paper that, while it could indeed be possible to plot the kind of map Blake is looking for, over three-and-a-half centuries of map development have moved in a different direc-tion, not for any reason specific to the needs of cartography, but because there has been a political incentive to do so. This paper ends with three alternative means of presenting border regions in cartography.
7.1 States fading away
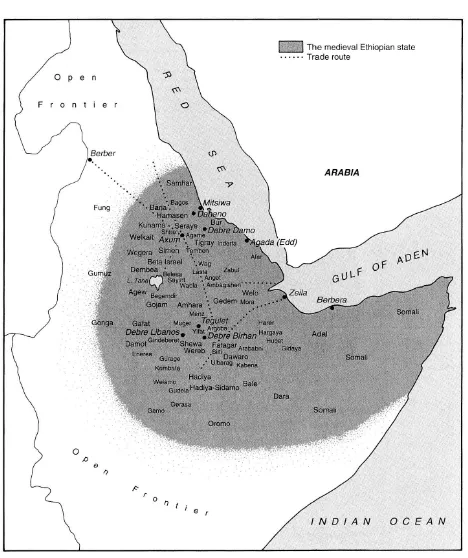
Figure 10: Marcus, 1994,Ethiopia, 1270–1524
The first, presented in Figure 10 is taken from Marcus (1994). Entitled ‘Ethiopia, 1270–1524’ it represents a region defined as the medieval Ethiopian state. Yet rather than abruptly ending, by using a half-tone dither, it simply fades away. This seems a more
useful way of representing the regions referred to by Blake as ‘beyond the reach of central government.’
7.2 Carta Marina and watercolours
Figure 11: Olaus Magnus, 1572,Carta Marina
On the Carta Marina (1572, Figure 11), there is nothing in the engraving of the map to indicate state borders; this is all done through the watercolour painting. The Carta Marina is arguably one of the most beautiful maps in existence, but it is also one of the most interesting. The detail shown in the lower part of the Figure presents Carelia: one of the points at which Finland meets Russia. The water-colour artists has represented the two states with two different colours: yellow and blue-green. Yet in painting the border region, the artist did not let the watercolours dry, so the two have bled into each other at the bordering area, creating a green region. In a sense, this seems another useful way of representing border regions on maps
7.3 Schengen
Inspired by the blurred watercolours on the Carta Marina, it is now possible to come back to the start of this paper. The CIA’s Westphalian map of Europe makes it very clear where one state ends and another begins. Yet with the European Union and the Schengen Agreement, in many ways, this does not seem to be an accurate reflection of political reality. Accordingly, a modi-fied version of the CIA map is presented in Figure 12. Perhaps this can be a model for other political, but not necessarily West-phalian, maps.
The International Archives of the Photogrammetry, Remote Sensing and Spatial Information Sciences, Volume XL-4/W3, 2013 ISPRS/IGU/ICA Joint Workshop on Borderlands Modelling and Understanding for Global Sustainability 2013,
Figure 12: CIA map revisited: Schengenland
8 APPENDIX
9 BIBLIOGRAPHY
Map sources: Biblioth`eque nationale de France; Koninklijke Bib-liotheek; Universit¨atsbibliothek Basel; Kungliga biblioteket - Sveriges nationalbibliotek.
Black, Jeremy, 1997. Maps and Politics. London: Reaktion Books.
Blake, Gerald, 2000. ‘State Limits in the Early Twenty-First Cen-tury: Obervations on Form and Function.’ Geopolitics, Vol. 5, No. 1: 1–18.
Culcasi, Karen, 2006. ‘Cartographically constructing Kurdistan within geopolitical and orientalist discourses.’ Political Geogra-phy, 25: 680–706.
Harley, J.B., 1989. ‘Deconstructing the Map.’ Cartographica, Vol. 26, No. 2: 1–20.
Krasner, Stephen D., 1995. ‘Compromising Westphalia.’ Inter-national Security, Vol. 20, No. 3: 115-151.
Marcus, Harold G., 1994. A History of Ethiopia. Berkeley, CA: University of California Press.
Monmonier, Mark S., 1991. How to Lie with Maps. Chicago: University of Chicago Press.
Neocleous, Mark, 2003. ‘Off the Map: On Violence and Cartog-raphy.’European Journal of Social Theory, 6 (4): 409–425 Pickering, Steve, 2012. ‘Proximity, maps and conflict: new mea-sures, new maps and new findings.’ Conflict Management and Peace Science. Vol. 29, No. 4: 425–443.
Dotted Two-colour Solid Year Cartographer border border colours 1568 unknown
1611 Hondius, J. (sr.) X
1619 Hondius, J. (sr.) 1620 Hondius, J. (jr.) X
1623 Mercator, R. X
1641 Boisseau, J. X X
1644 Hondius, H. X