AN ENSEMBLE CLASSIFICATION APPROACH FOR IMPROVED
LAND USE/COVER CHANGE DETECTION
Menaka Chellasamy a, *, Ty P.A. Ferré b, Mogens Humlekrog Greeve a, Rene Larsen a and Udhayakumar Chinnasamyc a Dept. of Agroecology, Aarhus University, Denmark- 8830 –
[email protected] , [email protected] b
Dept. of of Hydrology and Water Resources, University of Arizona, Tuscon, Arizona 85721-0011 - [email protected]
c
Institute of Remote Sensing, College of Engineering, Chennai – 600025, India, [email protected]
Commission VIII, WG VIII/8
KEY WORDS: Classification, Neural, Satellite, Imagery, Land Use Land Cover, Changes
ABSTRACT:
Change Detection (CD) methods based on post-classification comparison approaches are claimed to provide potentially reliable results. They are considered to be most obvious quantitative method in the analysis of Land Use Land Cover (LULC) changes which provides from - to change information. But, the performance of post-classification comparison approaches highly depends on the accuracy of classification of individual images used for comparison. Hence, we present a classification approach that produce accurate classified results which aids to obtain improved change detection results. Machine learning is a part of broader framework in change detection, where neural networks have drawn much attention. Neural network algorithms adaptively estimate continuous functions from input data without mathematical representation of output dependence on input. A common practice for classification is to use Multi-Layer-Perceptron (MLP) neural network with backpropogation learning algorithm for prediction. To increase the ability of learning and prediction, multiple inputs (spectral, texture, topography, and multi-temporal information) are generally stacked to incorporate diversity of information. On the other hand literatures claims backpropagation algorithm to exhibit weak and unstable learning in use of multiple inputs, while dealing with complex datasets characterized by mixed uncertainty levels. To address the problem of learning complex information, we propose an ensemble classification technique that incorporates multiple inputs for classification unlike traditional stacking of multiple input data.
In this paper, we present an Endorsement Theory based ensemble classification that integrates multiple information, in terms of prediction probabilities, to produce final classification results. Three different input datasets are used in this study: spectral, texture and indices, from SPOT-4 multispectral imagery captured on 1998 and 2003. Each SPOT image is classified individually to produce the classified output and used for comparison. A MLP is trained with the input datasets separately using a backpropagation learning algorithm and prediction probabilities are produced for each pixel as evidence against each LU/LC class. An integration rule based on Endorsement Theory is applied to these multiple evidence by considering their individual contribution and the most probable class of a pixel is identified. Integration of the three datasets by the proposed method is found to produce 88.4% and 84.6% for individual image. The proposed method improves the potential of using SPOT satellite imagery for change detection.
* Corresponding author. This is useful to know for communication with the appropriate person in cases with more than one author.
1 INTRODUCTION
Landscapes are the entities that are often bound to changes in particular encroachment of rural areas by urban growth, clearing of tropical forests, land use intensification and rangeland modifications (Lambin et al., 2003). The driving forces of these LULC changes involves biophysical and socioeconomic attributes such as increase in population, increased run-off and flooding, effect of soil erosion, increased CO2 concentration, climatological changes and biodiversity loss (Mas, 1999; Myers, 1988). The negative impact caused by these factors prevails at both national scale and global scale and its magnitude, pace and spatial reach are often unforeseen. In order to take necessary precautions to confront those negative impacts, excellent knowledge and enhanced understanding of cause-consequence-measurement-assessment of LULC changes is required (Lambin et al., 2003).
The timely and accurate information on landscape changes provides a fundamental input for planning, management and monitoring environmental resources (Serra et al., 2003). Researches states that there is still demand for developing functional and reliable methods for operational work to measure changes on Earth’s surface (Knudsen and Olsen, 2003). National wide CD is a crucial task for many countries in particular member states of European Union (EU). Because every member state has to maintain national wide register/system called Land Parcel Identification System (Matikainen et al., 2012) that contains information about the changes in landscapes. LPIS system is needed for the payment of farming subsidies and it has to be updated yearly. The member states aims at updating the LULC changes at less expense and time.
Numerous literatures on the CD topic exists (Holland and Marshall, 2004; Knudsen and Olsen, 2003; Steinnocher and
Kressler; Walter, 2004) and still being a hot research topic. This study is also one such attempt to address a technique for detecting LULC changes with improved accuracy using satellite imagery (coarse resolution) and machine learning algorithms.
1.1 Background
CD is the process of identifying differences in the landscapes by observing at different times (Singh, 1989). Remote Sensing (RS) has become effective tools to identify these changes. CD process requires multi-temporal datasets to observe the temporal changes on landscapes and thus increase in regular availability of satellite and aerial imagery has been providing potential assistance to detect changes (Alqurashi and Kumar, 2013; Ruiz et al., 2009). One important concern is to select an appropriate CD technique that exploits available multi-temporal images for accurate identification of temporal changes. Several CD techniques are available in the literatures and also their performance has been reviewed (Alqurashi and Kumar, 2013; Coppin et al., 2004; Hussain et al., 2013; Singh, 1989). However these reviews did not extensively examine the suitability of different techniques for different CD applications. Different authors categorized CD techniques on different viewpoints. (Chan et al., 2001) categorized them in to two: pre classification and post-classification based on nature of methods. (Lu et al., 2004) categorized them in to 7 categories based on applications. (Hussain et al., 2013) reviewed another category having two groups: pixel based and object based on the unit of image analysis.
CD based on post-classification comparison is the traditional methodology used by the researchers when there is a need for mapping changes in a detailed level (Hussain et al., 2013). In this method first temporal images are classified individually and then compared to measure changes. Studies by (Bouziani et al., 2010; Im and Jensen, 2005; Jensen, 1996) claims the post-classification comparison as best quantitative CD method since it provides from-to change information. The main advantages of the methodology are given in (Chen et al., 2012): reduced impact of atmosphere, sensor and environmental condition, less impact of multi-sensor images and resulting complete detailed change matrix. Perhaps the change matrix generated is often used as a benchmark for evaluating the emerging CD techniques (Lunetta and Elvidge, 1999). Although post-classification comparison method has many advantages, errors in the individual image classification propagates to the final CD results. Thus the accuracy of the method depends on classification accuracy of individual images (Chan et al., 2001; Dai and Khorram, 1999).
1.2 Contribution
As mentioned above, it is very important to have accurate classified images to map changes. In short, post-classification comparison CD method requires an apt classification technique that produces accurate results. In this paper we propose an approach in this paper to achieve accurate individual classified images. Post-classification comparison technique uses either un-supervised or supervised classification method. However, literatures show that the supervised method generate more classification accuracy than unsupervised classification methods (Lu and Weng, 2007). When a subject of selecting suitable supervised classifier comes in, ensemble classification scheme is being the hottest research topic recently (Aitkenhead and Aalders, 2011; Aitkenhead et al., 2008).
The study demonstrates CD technique based on ensemble post-classification approach using SPOT-4 bi-temporal imagery. The classification methodology used in this paper is called ‘multi -evidence classification approach’. The detailed procedure of the methodology is explained in the following section. The two main components of this paper are i) addressing a multi-evidence ensemble classification technique to generate individual classified images ii) evaluating the contribution of individual evidences for changed LULC classes.
2. THE PROPOSED CHANGE DETECTION APPROACH
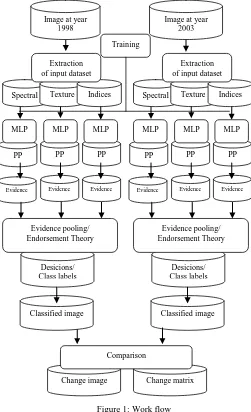
In the proposed post-classification comparison based changed detection, each image was classified using multi-evidence ensemble classification approach and then compared to generate a change map (Figure 1). SPOT-4 imagery acquired during 1998 and 2003 are used initial and final state image respectively. Post-classification comparison between two classified images gives ‘from’ and ‘to’ identifiers. For example: if a pixel from is classified as forest in 1998 image and as building in 2003 image, the CD output gives an idea: the forest pixel changed to building in the final state, provided the accuracy of the classification is at its best. The important components involved in the work flow are explained below.
Image at year
(MLP: Multi-layer perceptron, PP: Prediction probabilities)
2.1 Input dataset
Three different datasets/attributes are derived from SPOT-4 imagery to form three input datasets and are explained below.
2.1.1 Spectral dataset
Spatial details of LULC are characterized by extracting texture from each spectral band of SPOT-4 imagery using Gabor filters (Unser, 1995). The texture features are extracted using Gabor filters in this study. Gabor filters are said to be consistent to the response of human vision system. Gabor textures are frequency and orientation invariant and provide comprehensive features as compared with other traditional texture features. Hence indicating the Gabor features are the promising input for LULC discrimination (Manjunath and Ma, 1996).
In this research work, 5 radial frequencies with values of 2√2, 4√2, 8√2, 16√2 and 32√2 and scaling parameter of 0.5 at 8 different orientations are used for generating filters of different scales. It results 40 Gabor features from each spectral band. First two principle components of 40 Gabor features explaining approximately 86% of variable information are considered as a texture representation of each spectral band. In summary, texture dataset contains 8 bands and forms the second dataset.
2.1.3 Indices
Spectral indices have widely supported numerous studies to characterize the type, amount and condition of LULC (Jackson and Huete, 1991). After reviewing of various spectral indices (Jackson and Huete, 1991; Shamsoddini et al., 2011; Wolf, 2010), the four below listed indices (Table 1) are derived and stacked to use as third input dataset.
2.2 Multi-evidence ensemble classification procedure
Researchers categorised ensemble classification approaches based on different procedure of generating multiple information combined to produce a strong classifier: i) a single classifier
trained with different sets of samples; ii) classifiers with different parameter choices (amount of tree pruning, parameters in learning algorithms); iii) different classifiers trained on the same training set; iv) classifiers with different architectures (like the topology of an ANN); v) a single classifier with different attribute sets. The multi-evidence ensemble classification approach falls in the fifth category. It is also called Endorsement Theory (ET) based classification or classification using evidence pooling. The approach consists of three MLP neural networks each trained with different attributes (Spectral, texture and indices). The three networks are trained with common training datasets and their prediction probabilities are pooled using ET to predict the unknown class labels for image pixels.
The three input datasets (spectral response, Gabor textures, and indices) extracted from SPOT-4 imagery are used in several studies to classify LULC (Novack et al., 2011; Upadhyay et al., 2012). Thus, our proposed approach uses MLP networks trained with three input dataset individually and produce three evidential neural networks. Each network generates prediction probabilities called evidences or beliefs for unknown pixel. The value of the prediction probability ranges from 0 to 1. Evidences are heuristically named: conclusive-belief (positive: [0.9-1], negative: [0-0.1]), prima-facie (positive: [0.8-0.9], negative: [0.1-0.2]), strong (positive: [0.7-0.8], negative: [0.2-0.3]), weak (positive: [0.6-0.7], negative: [0.3-0.4]) and no evidence (any other values) (Aitkenhead et al., 2008). The three evidences are pooled according to a set of rules described in (Aitkenhead et al., 2008) which results in different conclusion to support a particular hypothesis/class. The conclusions are named according to the strength: definite (conclusive evidence), confident (prima facie evidence), likely (strong evidence), indicated (weak evidence) and no evidence (equally balanced). Finally, the class against which the highest strength of conclusion is obtained is used as output class to the pixel. The conclusion can be taken based on individual evidence (if only one dataset produce highest strength of conclusion) or different combination of input datasets (if two or all the three datasets produce the highest strength of conclusion). The detailed procedure of this multi-evidence classification approach is presented in the study by (Chellasamy et al., 2014). The backpropogation learning algorithm with tuned attributes (momentum 0.4, learning rate 0.4) is used for MLP training and prediction.
2.3 Change detection
Once classification of two images is accomplished, the class labels are assigned based on the LULC classes considered. Post-comparison based classification requires the class labels to be the same between temporal imagery. The classified images are compared and a CD map will be created which two classes namely ‘change’ and ‘no change’ class. Quantitative assessment of classified images and CD map is done as the final step.
3. IMPLEMENTATION AND RESULTS
3.1 Study Area
The study area is located in Dronninglund town, Denmark, covering approximately 9900 hectares, centered on the geographical coordinates 57°17’N (latitude) and 10°25’E (longitude). The area of interest is covered by SPOT-4 image acquired on July, 1998 and April 2003. A five year of Table 1. Indices used for the study
period are the centre of interest. The major reason for selecting this study area is construction of Frederikshavnmotorvejen E5 road at Dronninglund. The objective of this study is to map the changes influenced by the new road.
3.2 LULC classes
Seven different classes are found in the study area during two period. As the imagery has coarse resolution, the different crop types are grouped based on their season of cultivation. Also the pathway between each cropland is added to road category. Table 2 shows LULC classes observed during the temporal period.
3.3 Training and Test pixels
Class labels are collected by field visit during the time of image acquisitions. Then point based training samples (75 pixels in each class) and test samples (50 pixels in each class) are selected randomly without overlapping. In order to validate the changes, 200 change pixels and 200 no change pixels are collected manually.
3.4 Results of ensemble classification approach
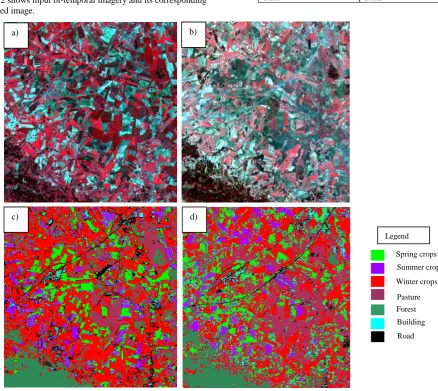
Figure 2 shows input bi-temporal imagery and its corresponding classified image.
1998 2003
Spring crops Peas Potato Barley Rape
Spring crops Peas Potato Barley Wheat
Summer crops Beet Maize
Summer crops Beet Maize Mixed seed
Winter crops Oats Barley Rye Rape Barley
Winter crops Oats Barley Rye Rape Barley
Pasture Pasture
Grass Pasture Seed grass
Forest Forest
Building Building
Road Road
Spring crops
Summer crops
Winter crops
Pasture Forest
Building
Road Legend
a) b)
c) d)
Figure 2: SPOT-4 imagery acquired during a) 1998 and b) 2003. c) and d) are classified image respectively
Table 2. LULC classes in the study area
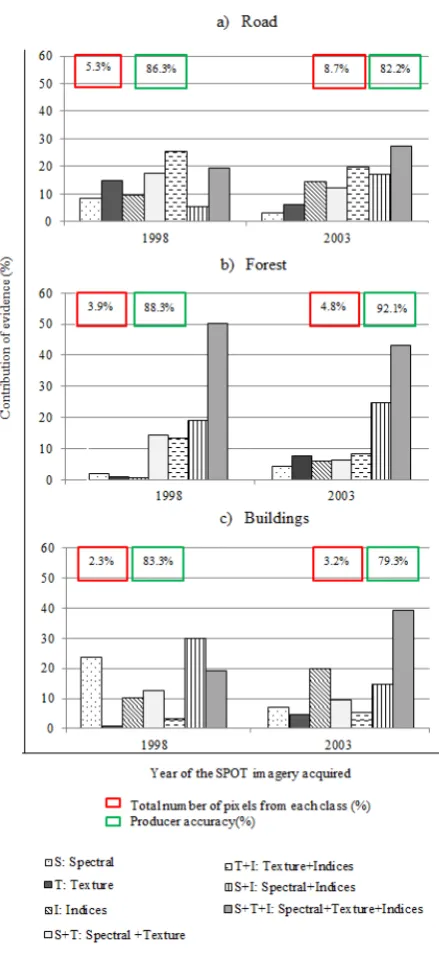
Figure 3. Contribution of input dataset The multi-evidence based classification used the available input
datasets in an ensemble framework unlike stacking them together and feeding in to classifier (winner-takes-all approach). It is evident that the stacked approach underperforms in classification and the back propagation is not robust in accurate prediction while complex stacked input is used (Chellasamy et al., 2014). The multi-evidence approach produced increased Overall Classification Accuracy of 88.4% and 84.6% in comparison to winners-takes-all approach which produced 83.1% and 79.8% for 1998 and 2003 imagery respectively
.
This is because of the disadvantage of MLP in learning from stacked dataset with higher uncertainty. Error in learning propagates throughout multiple layers which yielded less accurate classified results. But the proposed approach utilizes the input datasets separately yielding correct prediction probabilities which counteracts the problem of selecting informative datasets in the traditional approach. From the multi-evidence classification approach, improved Producer Accuracy (PA) for LULC classes are obtained (Table 3). The OCA of classified image from 1998 is higher than that of 2003 as the first image is captured on early summer and the second is from spring season. LULC classes are more discriminable in early summer imagery than from spring because of inability to classify spring crops from summer. But PA of forest is higher in 2003 imagery due to the difficulty in discriminating between pasture and forest. But the spring imagery is good enough to discriminate them, as the pasture is in early stage of growth while forest are rich in chlorophyll content and distinguished spatial structure. All other classes are classified with higher PA in 1998 except winter crops where less difference is.3.5 Contribution of evidences
As mentioned before, multi-evidence based classification approach integrates the multiple inputs effectively to generate accurate classification. The performance datasets that are highly useful for LULC classification are analysed. The strength of evidences and contributions (implying its evidence is responsible for generating final conclusion) give knowledge about which datasets among three are useful for discriminating particular classes. The analysis is done for 50 text pixels for the classes that are found to be changed in the final state imagery
from initial state imagery. The statistics of the analysis are given in Figure 3 and shows how many percentages of conclusions either from single input or combination of inputs are used for classification.
In comparison to early summer imagery, all three datasets are involved to produce maximum number of contribution to take conclusions compare to other combination or individual dataset. All the three dataset produce highest strength of conclusion to decide the class labels for pixels. But it is important to analysis whether these contributions provided are accurate which is not presented here as PA gives an idea about the accuracy of overall contributions. In case of early summer imagery, for road class texture and indices combination contributes more and for buildings spectral and indices combination contributes the maximum. This gives an idea that different combination of datasets is involved in producing class labels for different classes. In case of road class and building, we could also see that the contributions are from individual dataset which implies Class
PA(%)
1998 2003
Spring crops 85.4 78.1
Summer crops 90.6 75.8
Winter crops 84.9 85.3
Pasture 82.7 86.2
Forest 88.3 92.1
Building 83.3 79.3
Road 86.3 82.2
Table 3. Producer accuracy (PA) of classification
all the dataset are not always useful for classification. In comparison to road and building class, for forest class, highest contribution from all the three dataset yielding PA greater than 85%. It shows all the three datasets are good enough to discriminate forest class as they are highly distinct from other classes.
3.6 Changes occurred
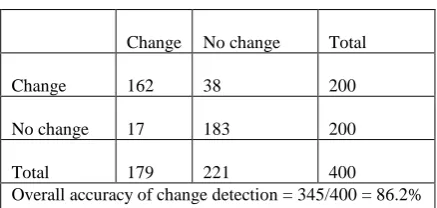
Highest number of pixels from all three crops classes is found to be changed to different crop classes in the final state imagery. This is due to crop rotation. So other classes which are completely changed in to different LULC are: road, forest and buildings (Figure 3). The percentage of pixels of these classes in the imagery of both temporal periods is given in red box. We could see how much percentage of pixels has been increased. In order to validate these change error matrix is calculated with 200 pixels for change and no change class. The accuracy of CD by the proposed method is found to be 86.2% whereas CD map based on winner-takes-all approach is 81.5%.
4 CONCLUSIONS
In this paper, we presented an approach for change detection that comes under post-comparison classification technique. The classification employed is based on ensemble framework that uses spectral, texture and indices input separately to enhance the accuracy of classification. The multi-evidence classification produces classified output whose overall classification accuracy is 88.4% and 84.6% which is greater than that of the output produced by traditional stacking method (83.1% and 79.8%). The approach found to be promising to perform change detection using SPOT-4 images which resulting 86.2% accurate change detection results. The accuracy of classification can be further increased if the multi-seasonal information for each time is included for generating individual classified output which will be the future work.
ACKNOWLEDGEMENTS
The authors would like to thank Danish Ministry of Food, Agriculture and Fisheries for the supplied data
REFERENCES
Aitkenhead, M., Aalders, I., 2011. Automating land cover mapping of Scotland using expert system and knowledge integration methods. Remote Sensing of Environment 115, 1285-1295.
Aitkenhead, M., Flaherty, S., Cutler, M., 2008. Evaluating neural networks and evidence pooling for land cover mapping. Photogrammetric Engineering & Remote Sensing 74, 1019-1032.
Alqurashi, A.F., Kumar, L., 2013. Investigating the Use of Remote Sensing and GIS Techniques to Detect Land Use and Land Cover Change: A Review. Advances in Remote Sensing 2, 193.
Balcik, F.B., Goksel, C., 2012. Determination of magnitude and direction of land use/land cover changes in Terkos Water Basin, Istanbul. Intl Archives of the Photogrammetry, Remote Sensing and Spatial Information Sciences 39, B7.
Bouziani, M., Goïta, K., He, D.-C., 2010. Automatic change detection of buildings in urban environment from very high spatial resolution images using existing geodatabase and prior knowledge. ISPRS Journal of photogrammetry and remote sensing 65, 143-153.
Chan, J.C.-W., Chan, K.-P., Yeh, A.G.-O., 2001. Detecting the nature of change in an urban environment: A comparison of machine learning algorithms. Photogrammetric Engineering and Remote Sensing 67, 213-225.
Chellasamy, M., Zielinski, R.T., Greve, M.H., 2014. A Evidence Approach for Crop Discrimination using Multi-Temporal WorldView-2 Imagery. IEEE Journal of Selected Topics in Applied Earth Observations and Remote Sensing. Chen, G., Hay, G.J., St-Onge, B., 2012. A GEOBIA framework to estimate forest parameters from lidar transects, Quickbird imagery and machine learning: A case study in Quebec, Canada. International Journal of Applied Earth Observation and Geoinformation 15, 28-37.
Chen, J., Gong, P., He, C., Pu, R., Shi, P., 2003. Land-use/land-cover change detection using improved change-vector analysis. Photogrammetric Engineering & Remote Sensing 69, 369-379. Coppin, P., Jonckheere, I., Nackaerts, K., Muys, B., Lambin, E., 2004. Review ArticleDigital change detection methods in ecosystem monitoring: a review. International journal of remote sensing 25, 1565-1596.
Dai, X., Khorram, S., 1999. Remotely sensed change detection based on artificial neural networks. Photogrammetric Engineering and Remote Sensing 65, 1187-1194.
Holland, D., Marshall, P., 2004. Updating maps in a well-mapped country using high resolution satellite imagery, XX. Congress of International Society for Photogrammetry and Remote Sensing (ISPRS), Commission II, Working Group II/6. Citeseer, pp. 12-23.
Hussain, M., Chen, D., Cheng, A., Wei, H., Stanley, D., 2013. Change detection from remotely sensed images: From pixel-based to object-pixel-based approaches. ISPRS Journal of photogrammetry and remote sensing 80, 91-106.
Im, J., Jensen, J.R., 2005. A change detection model based on neighborhood correlation image analysis and decision tree classification. Remote Sensing of Environment 99, 326-340. Jackson, R.D., Huete, A.R., 1991. Interpreting vegetation indices. Preventive Veterinary Medicine 11, 185-200.
Jensen, J.R., 1996. Introductory digital image processing: a remote sensing perspective. Prentice-Hall Inc.
Knudsen, T., Olsen, B.P., 2003. Automated change detection for updates of digital map databases. Photogrammetric Engineering & Remote Sensing 69, 1289-1296.
Lambin, E.F., Turner, B., Geist, H., Agbola, S., Angelsen, A., Bruce, J., Coomes, O., Dirzo, R., Fischer, G., Folke, C., 2003. The causes of land-use and land-cover change: moving beyond the myths.
Lu, D., Mausel, P., Brondizio, E., Moran, E., 2004. Change detection techniques. International journal of remote sensing 25, 2365-2401.
Change No change Total
Change 162 38 200
No change 17 183 200
Total 179 221 400
Overall accuracy of change detection = 345/400 = 86.2% Table 4. Change/No change error matrix
Lu, D., Weng, Q., 2007. A survey of image classification methods and techniques for improving classification performance. International journal of remote sensing 28, 823-870.
Lunetta, R.S., Elvidge, C.D., 1999. Remote sensing change detection: environmental monitoring methods and applications. Taylor & Francis Ltd.
Manjunath, B.S., Ma, W.-Y., 1996. Texture features for browsing and retrieval of image data. Pattern Analysis and Machine Intelligence, IEEE Transactions on 18, 837-842. Mas, J.-F., 1999. Monitoring land-cover changes: a comparison of change detection techniques. International journal of remote sensing 20, 139-152.
Matikainen, L., Karila, K., Litkey, P., Ahokas, E., Munck, A., Karjalainen, M., Hyyppä, J., 2012. The Challenge of Automated Change Detection: Developing a Method for the Updating of Land Parcels. ISPRS Annals of Photogrammetry, Remote Sensing and Spatial Information Sciences 1, 239-244.
Myers, N., 1988. Tropical forests: much more than stocks of wood. Journal of Tropical Ecology 4, 209-221.
Novack, T., Esch, T., Kux, H., Stilla, U., 2011. Machine learning comparison between WorldView-2 and QuickBird-2-simulated imagery regarding object-based urban land cover classification. Remote Sensing 3, 2263-2282.
Ruiz, L.A., Recio, J.A., Hermosilla, T., Sarria, A., 2009. Identification of agricultural and land cover database changes using object-oriented classification techniques, 33rd International Symposium on Remote Sensing of Environment, May, pp. 4-8.
Serra, P., Pons, X., Sauri, D., 2003. Post-classification change detection with data from different sensors: some accuracy considerations. International journal of remote sensing 24, 3311-3340.
Shamsoddini, A., Trinder, J.C., Turner, R., 2011. Quantization of Pinus forest biophysical parameters using WorldView-2, Latin American Geospatial Forum.
Singh, A., 1989. Review article digital change detection techniques using remotely-sensed data. International journal of remote sensing 10, 989-1003.
Steinnocher, K., Kressler, F., Change detection (Final report of a EuroSDR project). EuroSDR Official Publication, 111-182. Unser, M., 1995. Texture classification and segmentation using wavelet frames. Image Processing, IEEE Transactions on 4, 1549-1560.
Upadhyay, P., Kumar, A., Roy, P.S., Ghosh, S.K., Gilbert, I., 2012. Effect on specific crop mapping using WorldView-2 multispectral add-on bands: soft classification approach. Journal of Applied Remote Sensing 6, 063524-063521-063524-063513. Walter, V., 2004. Object-based classification of remote sensing data for change detection. ISPRS Journal of photogrammetry and remote sensing 58, 225-238.
Wolf, A., 2010. Using WorldView 2 Vis-NIR MSI imagery to support land mapping and feature extraction using normalized difference index ratios. DigitalGlobe 8-Band Research Challenge, 1-13.
Xiao, X., Boles, S., Liu, J., Zhuang, D., Liu, M., 2002. Characterization of forest types in Northeastern China, using multi-temporal SPOT-4 VEGETATION sensor data. Remote Sensing of Environment 82, 335-348.