POLARIMETRIC SYNTHETIC APERTURE RADAR DATA FOR CROP COVER
CLASSIFICATION
Ramana K V., Srikanth.P, Deepika.U and Sesha Sai M.V.R.
ASAG, RSAA, National Remote Sensing Centre,
Balanagar, Hyderabad
–
500037. India
[email protected]
KEY WORDS: Polarimetric SAR, Hybrid polarimetry, image decomposition, crop monitoring
ABSTRACT:
The interest in crop inventory through the use of microwave sensors is on the rise owing to need for accurate crop forecast and the availability of multi polarization data. Till recently, the temporal amplitude data has been used for crop discrimination as well as acreage estimation. With the availability of dual and quadpol data, the differential response of crop geometry at various crop growth stages to various polarizations is being exploited for discrimination and classification of crops. An attempt has been made in the current study with RISAT1 and Radarsat2 C-band single, dual, fully and hybrid polarimetric data for crop inventory. The single date hybrid polarimetric data gave comparable results to the three date single polarization data as well as with the single date fully polarimetric data for crops like rice and cotton.
1. INTRODUCTION
Microwave remote sensing offers great potential for monitoring crops especially during the monsoon season due to capability of radar systems to acquire data under all weather conditions. Crop monitoring in India during the monsoon (rainy) season using optical data is difficult due to persistent cloudy conditions. SAR being an active sensor is having the potential to provide information on crops and the recent developments in polarimetry has added new dimensions to the SAR data and also understanding of the SAR and object interactions.
Several ground based scatterometers and sensors flown on aircraft have improved the understanding of the sensitivity of multi frequency and multi polarization radars to target features. Research has proved that the additional polarizations will increase the information content in a SAR dataset similar to using multispectral approaches in the optical region (Mc Nairn and Brisco, 2004, Feilong et al., 2005 and Mc Nairn et al., 2014). The multi-polarized configurations provide more information related to crop structure and condition. The phase and polarimetric parameters does help in understanding the different scattering mechanisms from different surface features in general and crops in particular.
Several studies have demonstrated the utility of temporal SAR amplitude data for rice crop monitoring. (e.g. Hoogeboom, 1983; Kurosu et al., 1995; Premlatha and Rao, 1994 and Chakraborty et al., 2005). Shallower incidence angles (near 40 degree) increase the path length
through vegetation thus maximizing the crop response and better classification capabilities (Le Toan et al., 1984). Levine and Karam (1996) reported that attenuation through vegetation is proportional to vegetation water content.
Study of multi-date alternate polarization ASAR data at varying incidence angles indicated the potential of cross and like polarizations for deriving the information on commencement of agricultural activities, field preparation, estimation and progression of in-season cropped area, discrimination of groundnut and cotton crop (Sesha Sai et al., 2007). Operational procedures were developed for jute crop estimation from temporal HH amplitude data wherein the classification accuracy of around 91 percent was achieved (Haldar et al., 2011, Patnaik and Haldar, 2008). Rice crop forecasting can be advanced with the use of single date fully polarimetric data compared to the use of amplitude data alone from temporal C band SAR data sets. (Srikanth et. al., 2011). The potential of multi frequency SAR data was exploited for detecting the canopy growth due to the variation in penetration capabilities. Wang et al., 2009 studied the growth progress as manifested by change in backscatter in dual-polarized PALSAR data. The current article discusses the use of temporal single polarization data through fully and hybrid polarimetric data for crop discrimination and area estimation.
2. SITE DESCRIPTION
irrigated and rainfed regions respectively in the Guntur test site. The rice crop is transplanted in the month of August and extends upto early September at Guntur test site. While the cotton crop sowings commence from the month of July onwards. In West Godavari district, the rice is the predominant crop grown in both the monsoon and post monsoon seasons supported by the irrigation system of the Godavari delta. Coconut plantations are also widely cultivated in this region.
3. DATA 3.1. Satellite data
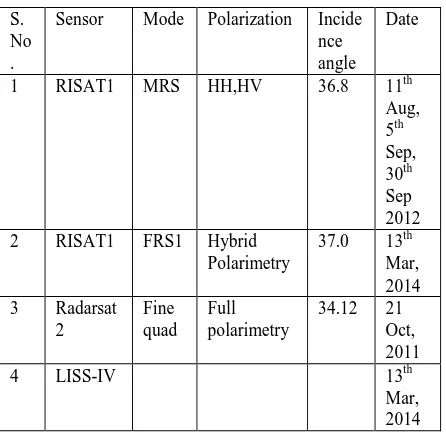
The data from RISAT1 and Radarsat2 sensors were used and the details were given in Table1.
S. No .
Sensor Mode Polarization Incide nce
Table 1. Details of satellite data used.
3.2. Ground Data
Synchronous ground truth data like crop type, phenology, leaf area, plant height and crop sowing/transplantation period were collected from the test sites on all the days of data acquisition.
4. METHODOLOGY
4.1. Pre-processing and decomposition
PolSARPro and ENVI s/w were used for processing of the data sets. The MRS and FRS 1 Hybrid polarimetric data of RISAT1 data was downloaded converted into amplitude format and enhanced lee speckle filter with 5*5 window size was applied to remove the speckle noise. Sigma naught image was generated using calibration constant given in the metadata. Stokes parameters were computed followed by Raney decomposition (Raney, 2007; 2013) of the FRS1 SLC data. The polarimetric decompositions and sigma naught image were geometrically corrected by using historical LISS-IV data of the study area.
The Radarsat finequad data was imported into the coherence matrix as well as amplitude format. The data was
geometrically corrected using the GCP’s given in the
header file using ASF s/w module. The Gaussian-Boxcar Speckle filter with 5*5 size was applied to remove the speckle. The Entropy-Anisotropy-Alpha (H-A-α) (Cloude and Pottier, 1996) decomposition technique was applied on the polarimetric SAR data.
4.2. Classification
The decision rule based classification approach was performed on temporal MRS amplitude data with HH polarization only; minimum distance parallelepiped classifier was used for RISAT1 dualpol and hybrid polarimetric data; Wishart (H-α) classification algorithm was implemented on the (H-A-α) decomposed image of Radarsat2 data; and the LISS-IV optical data was subjected to maximum likelihood classification algorithm. The results were compared with the ground data collected synchronous to the date of pass.
5. RESULTS AND DISCUSSION
The results have been presented in the increasing order of complexity at three levels – use of amplitude data alone, use of fully and hybrid polarimetric data.
5.1. Amplitude data analysis
The use of amplitude data alone for crop discrimination and classification has been attempted in the rice and cotton growing areas of Guntur test site. The back scatter values in HH polarization during the time of puddling/transplantation stage ranged from -18 to -15.0 dB. The backscatter from rice canopy increased with the increase in leaf area and canopy volume from transplantation stage to maximum vegetative to reproductive stage and declined thereafter and can be seen in figure 1a. Similarly for cotton crop, the
The decision rule classifier scheme has been used to pick up the kharif rice area. The areas classified as rice pixels were masked and the minimum distance parallelepiped classifier was performed on the remaining pixels for mapping of cotton cropped areas over the dual pol (HH and HV) data of three dates. The distributions of the rice and cotton crops were depicted in the figure 2 (FCC and classified image). The producer’s accuracy ranged from 91% in case of rice crop and 82 % for cotton crop.
Fig 2. Discrimination of rice and cotton crops from Dual Pol. RISAT1 MRS data
In another approach, the threshold of co-polarisation ratio (HH/VV) greater than 3 dB and the absolute value of VV less than -8.0 dB has been used to detect the rice/ non-rice fields for the data coinciding with the maximum vegetative growth stage (Fig 3). The statistics of rice crop were in agreement to the extent of 85% with that of Wishart (H-α) classifier. Though a spatial match of 85 % is achieved with this method, the error of commission is found to be high and also demanding in terms of post classification smoothening.
5.2. Fully polarimetric data analysis:
The crops respond differently to various polarizations due to their differences in canopy architecture and differences in their water bearing capacities. The crops under study
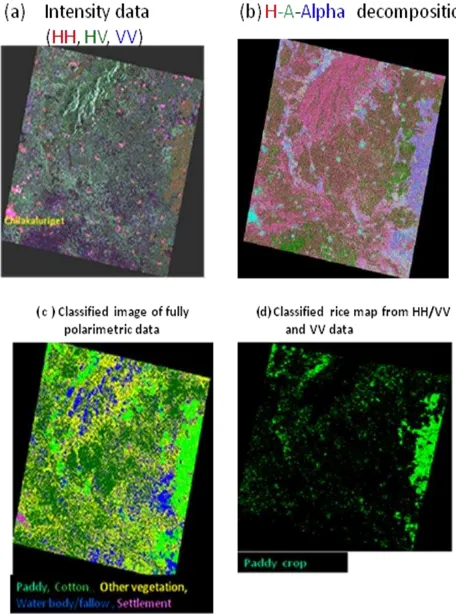
namely rice and cotton are erectophile and planophile respectively. The rice crop is grown under standing water conditions while the cotton crop though irrigated cannot with stand any water logging. An attempt has been made to assess the potential of polarimetric SAR data for inventory of kharif rice and cotton crops. In the process, physical process of the scattering mechanisms occurring in rice and cotton crops at different phonological stages was studied through the use of temporal Radarsat 2 Fine quadpol SAR data. The alpha parameter from H-alpha decomposition for the rice crop is always found to be higher than for the cotton crop throughout the period of study. The producer’s classification accuracy for the rice and cotton was found to be 94% and 87 % respectively from a single date fully polarimetric SAR data.
Fig 3. FCC of the intensity data of the study area (a), H-A-Alpha decomposition image (b) Wishart supervised classification over fully polarimetric data (c) and thresholding of co-pol data for rice crop (d).
5.3. Hybrid polarimetric data analysis:
The RISAT-1, FRS1 data covering part of West Godavari district in which the rice crop is in reproductive stage has been studied. Raney decomposition was performed followed by the application of supervised minimum distance classification of decomposition parameters viz.
Degree of polarization ( ), Relative phase , Degree
.
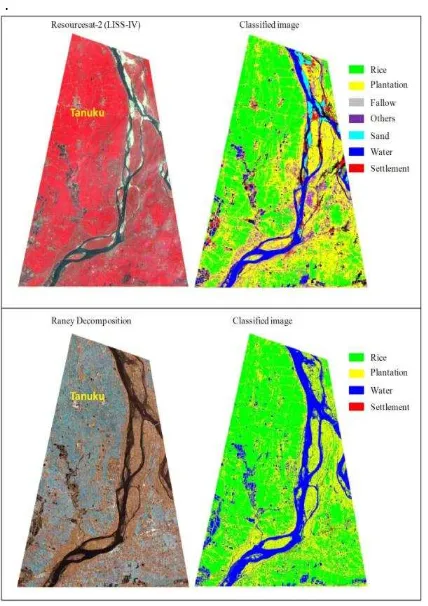
Fig 4. Common area of RISAT-1(Hybrid Polarimetric) FRS data and classified rice map (b) and Resourcesat-2 LISS-IV data covering parts of West Godavari district, AP and the classified Rabi Rice map (a)
The overall accuracy of LISS-IV and RISAT1 FRS data is 90.57 % and 80.41% respectively. While the k statistic for rice class ranged from 0.916 in LISS-IV and 0.855 in FRS data. The commission error in rice class was observed due to similar scattering mechanisms from plantations and peripheries of settlements with that of rice crop in RISAT1 data. The settlements were under classified in FRS data. The rice crop normally has a dominance of double bounce mechanism during the peak vegetative stage and shifts to volume scattering in the later part of the crop growth which is reproductive stage in the current study. The study has demonstrated the potential of single date FRS-1 hybrid polarimetric data for rice crop discrimination. Further, studies need to be carried out to estimate the rice cropped area during the early part of the crop growth stage.
6. CONCLUSIONS
The three date single polarization data gave high accuracy for rice crop compared to the use of single date co-polarization ratio and absolute backscatter values in VV polarization. The fully polarimetric data was found to give high classification accuracy in terms of overall accuracy, producers and users accuracy for rice and cotton crop from a single date data. The single date hybrid polarimetric data gave comparable results to the three date single polarization data but was found to give lower overall accuracy
compared to fully polarimetric data. However, the results are encouraging for individual crops like paddy crop class accuracy. The finding needs to be established in diverse ecosystems.
ACKNOWLEDGEMENT
Authors are grateful to Director, NRSC for providing the necessary support for carrying out the present study.
REFERENCES
Chakraborty M., Manjunath, K.R., Panigrahy, S., Kundu, N. and Parihar J.S., 2005. Rice crop parameter retrieval using multi-temporal, multi- incidence angle Radarsat SAR data, ISPRS Journal of Photogrammetry & Remote Sensing, Vol. 59, pp:310– 322.
Cloude, E. Pottier “A Review of Target Decomposition Theorems in Radar Polarimetry”, 1996. IEEE Transactions
of Geoscience and Remote Sensing, Vol.34, No.2, pp. 498-518.
Dipanwita Haldar, C. Patnaik, Manab Chakraborty, Aniruddha Paul and N. Kundu., 2011. Identification of Tall Fibre Crop (Jute) Using Multi-Temporal RADARSAT Data in Rainfed Areas of Eastern Indogangetic Plain, Vol.11., No.3, Asian Journal of Geoinformatics.
Feilong L., W Qinmin, W Xiaoqin (2005). Identification of rice crop using envisat ASAR in fuzhou, Fujian province,
China. Proc. 2005 Dragon symposium “Mid-term Results”, Santorini, Greece 27 June – 1 July 2005 (ESA SP-611, January 2006)
Hoogeboom, P. 1983. Classification of agricultural crops in radar images. IEEE Transactions on Geoscience and Remote Sensing, DE-23, pp 329-336
Kurosu, T., Fujita, M. and Chiba, K. (1995). Monitoring of rice crop growth from space using the ERS-1 C -band SAR.
IEEE Transactions on Geoscience and Remote Sensing, 33 (4), 1092-1096
Le Toan, T., Lopes. A. and Huet, M. 1984, On the relationships between radar backscattering coefficient and vegetation canopy characteristics, International Geoscience and Remote Sensing Symposium Proceedings, Straburg, France, Aug.27-30, pp.155-160
Levine D.M. and Karam M.A., 1996. Dependence of attenuation in a vegetation canopy on frequency and plant water content. IEEE Transactions on Geoscience and Remote Sensing. 34(5): 1090-1096.
McNairn, H. and Brisco B., 2004. The application of C-band polarimetric SAR for agriculture: a review, Can. J. Remote Sensing, Vol. 30, pp. 525–542.
McNairn, H., Kross.A., Lapen. D., Caves.R. and Shang.J. 2014. Early season monitoring of corn and soyabeans with TerraSAR-X and Radarsat-2. Int. J Applied Earth Observation and Geoinformation. 28. 252-259
using multi-temporal Radarsat SAR data. Scientific Report, EOAM/SAC/RESA/FASAL-TD/35/2008.
Premlatha, M. and Rao, P. P. N.(1994). Crop Acreage Estimation Using ERS-1 SAR Data. Journal of Indian Society of Remote Sensing, 22, pp 139-147
Raney, R.K., 2013. M-chi Decomposition of imperfect hybrid dual-polarimetric radar data. presented at the POLinSAR, Frascati, Italy, 2013
Raney,R.K., 2007. Decomposition of hybrid-polarity SAR data. Proceedings of 3rd International workshop on science and applicationin POLinSAR 2007, pp: 22-26 .
Sesha Sai M.V.R., Hebbar, K.R, Krishna Rao P V, Narasimha Rao PV, Vijayshankar Babu M., Dwivedi.R.S and Roy PS 2007, Potential of alternate polarization
Envisat-ASAR data for crop management. Proc. Conference of JEP towards microwave remote sensing data utilization (JEP-MW). May 15-16, 2007, SAC, Ahmedabad p. 1-77 .. 1-89.
Srikanth P, Ramana K V, Shankar Prasad T, K K Choudhary, Chandrasekhar K, Seshasai MVR and Behera
G “Inventory of irrigated Rice Ecosystem using Polarimetric SAR data”. – ISPRS Archives Vol. XXXVIII-8/W20, p 46-49.