*Corresponding author at : LU&CMD, National Remote Sensing Centre, India
LAND COVER CHANGE DETECTION USING OBJECT-BASED CLASSIFICATION
TECHNIQUE: A CASE STUDY ALONG THE KOSI RIVER, BIHAR
Mohit Modi*, Rajiv Kumar,G.Ravi Shankar andTapas. R.Martha
National Remote Sensing Centre, Indian Space Research Organisation
Hyderabad - 500 037, India (mohit_m, rajiv_kumar, ravishankar_g, tapas_martha)@nrsc.gov.in
KEY WORDS: Multi-resolution Segmentation, OBIA, Feature Space Optimization, Land Cover, Land Cover Change, LULC
ABSTRACT:
Land use/land cover (LULC) is dynamic in nature and can affect the ability of land to sustain human activities. The Indo-Gangetic plains of north Bihar in eastern India are prone to floods, which have a significant impact on land use / land cover, particularly agricultural lands and settlement areas. Satellite remote sensing techniques allow generating reliable and near-realtime information of LULC and have the potential to monitor these changes due to periodic flood. Automated methods such as object-based techniques have better potential to highlight changes through time series data analysis in comparison to pixel-based methods, since the former provides an opportunity to apply shape, context criteria in addition to spectral criteria to accurately characterise the changes. In this study, part of Kosi river flood plains in Supaul district, Bihar has been analysed to identify changes due to a flooding event in 2008. Object samples were collected from the post-flood image for a nearest neighbourhood (NN) classification in an object-based environment. Collection of sample were partially supported by the existing 2004-05 database. The feature space optimisation procedure was adopted to calculate an optimum feature combination (i.e. object property) that can provide highest classification accuracy. In the study, for classification of post-flood image, best class separation was obtained by using distance of 0.533 for 28 parameters out of 34. Results show that the Kosi flood has resulted in formation of sandy riverine areas.
1. INTRODUCTION
In the past few years, there has been a growing interest in the development of automatic change (Bruzzone & Prieto, 2000) – detection techniques for analysis and classification of satellite images. (Aleksandrowicz, Turlej, Lewinski, & Bochnenk, 2014). This interest stems for the fast and easy classification of multi-temporal satellite data. In remote sensing, the task is to map and classify using aerial and satellite imagery. Image classification is an important part for land use/ land cover classification. It is an important tool for examination of digital images to produce a final product and also serve as a major source for several analytical procedures applied to obtain information. The manual methods of interpretation of satellite images and classification of land cover are generally performed based on the observation using the data acquired during three seasons (Monsoon -Kharif, winter - Rabi and summer -Zaid). Object oriented classification is a relatively newer technique for satellite image classification and provides improved classification results as compared to the pixel based and manual approach. Object-based classification takes into account the context, texture etc., apart from the spectral values to provide better classification results. Similar pixels are grouped together to form many different small image objects. In object-based classification, the processing units are no longer single pixels but image objects. Object-based classification is the process of assigning objects to classes. Usually each object is treated as an individual unit. By comparing objects to one another, it is possible to merge groups of similar objects into classes that are associated with informational areas of interest to users of remotely sensed data. These classes form regions on a map or an image so that after classification the digital image can be identified by a colour or symbol.
Classification of remotely sensed data is usually performed by pixel based classification or by manual practice of observation and interpretation. Supervised classification and unsupervised classification are all based on the grey value of pixel itself, in that only the spectral information is used for classification (Xiaoxia, Jixian, & Zhengjun, 2004). They produce unacceptable classification results in extracting the interest objects. These supervised and unsupervised classification methods focus mainly on individual pixels and do not consider the textural information, topological information etc. As spatial resolution of satellite imagery has increased, new software programs have been developed that allow more complex data analysis. Object-based classification technology take advantages, either by classifying groups of like pixels together
or classifying a single pixel based on that pixel‟s relationship to
surrounding pixels, accounting for spectral as well as spatial properties in image. The number and size of the image objects are determined by user controlled parameters namely the scale and colour parameters available in eCognition software. Here, In general, the Object-based classification process can be divided into two main workflows as multi-resolution segmentation and classification of the segments. The classification is initiated by segmenting the image into meaningful objects. Segmentation is the first step in Object-based classification. It divides image into larger number of small image objects by grouping pixels (Blaschke, Burnett, & Pekkarinen, 2004). The definition of Segmentation is
“identification of the edges of the homogenous patches that
subdivide the images into interlocking regions” (ECognition guide). These regions are created based on the spectral values of pixels, as well as through user defined constraints. The segmentation algorithm is a region-merging technique. It begins by considering each pixel as a separate object. Subsequently, The International Archives of the Photogrammetry, Remote Sensing and Spatial Information Sciences, Volume XL-8, 2014
adjacent pairs of image objects are merged to form bigger segments. The merging decision is based on local homogeneity criterion, describing the similarity between adjacent image objects. The process terminates when the smallest increase of homogeneity exceeds a user-defined threshold. The number of image objects formed depends on the scale set by the user. If the scale set is large then lesser number of image objects is formed. Therefore a higher threshold will allow more merging and consequently forms bigger objects, and vice versa. The homogeneity criterion is a combination of colour (spectral values) and shape properties (a combination of smoothness and compactness). In such cases similar classes are more likely to get merged. In segmentation, we have an opportunity to insert any thematic layer to get more fine result.
The knowledge base for the analysis and classification of image objects is the so-called class hierarchy. Within this class hierarchy it is possible to insert features to corresponding individual classes.
2. MATERIALS AND METHODS 2.1 Study Area
The Study area comprises of Supaul district, covering a part of Kosi River, Bihar. The latitudinal extent of the image is 8654‟58” N to 874‟36” N and the longitudinal extent is 2621‟38” E to 2631‟28” E.
2.2 Data Used
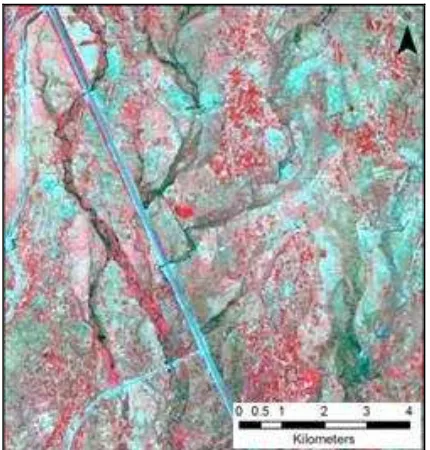
IRS Resourcesat-2 LISS-III multispectral satellite image was acquired during 2004 and 2009 covering an area of Kosi River, Supaul district, Bihar, with spatial resolution of 23 m has been used in the current study (figure 1(a and b). Pre-existing thematic layer on land cover for year 2004 was used for sample point generation. ECognition software 9 has been used for segmentation and object-based classification. To form subset features from the thematic layer for sample point generation, ARC GIS 10.1 has been used.
Figure 1(a): FCC Image for year 2004
Figure 1(b): FCC Image for year 2009
2.3 Methodology
Initially the interested study area images of 2004 and 2009 have been inserted into the software along with three thematic layers. The three thematic layers consist of sample point data for both years respectively and pre existing manually interpreted vector layer of land use /land cover data corresponding to the year 2004.
The methodology adopted in the present study is given in figure 3. Different sample points have been selected corresponding to respective classes from earlier data and optimised it using various features to get an automatic classified result.
Both the images of 2004 and 2009 have been segmented at different scale of 10 and 5 respectively. The segmentation has been done using multi resolution segmentation algorithm in rule based mode. The scale values were determined through an iterative method. For the image of 2004, pre-existing land cover vector layer was used which has given a better segmented image. All band layers were weighted equally for segmentation. The colour/shape was set to 0.5/0.5 and compactness/sharpness was set to 0.3/0.7 for both the images. Colour and shape weightage are inter-connected to each other. If colour has a high value, which means it has a high influence on segmentation; shape must have a low value, with less influence. If both the parameters are equal, then each will have roughly equal amount of influence on segmentation outcome.
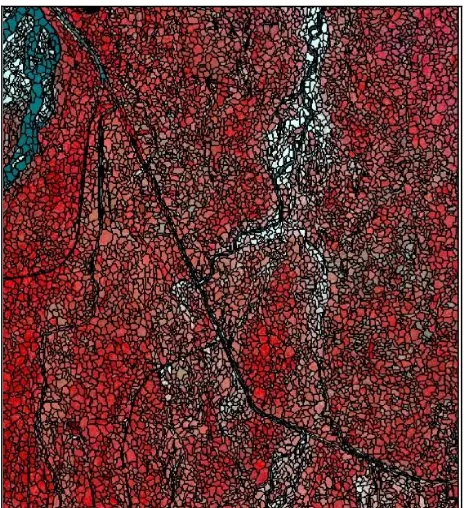
Segmentation results with these parameters are shown in Figure 2(a) and (b). Now for classification, a class hierarchy was prepared. A rule based approach was developed to classify Built-up, Water-bodies, Cropland, Fallow land, Scrubland and Sandy (Riverine) using a nearest neighbourhood (NN) configuration for detailed classification. Feature Space Optimisation (FSO) tool available in eCognition software have been used to calculate optimum feature combination based on class samples. It evaluates the Euclidean distance in feature space between the samples of all classes and selects a feature combination resulting in best class separation distance. The International Archives of the Photogrammetry, Remote Sensing and Spatial Information Sciences, Volume XL-8, 2014
Figure 2(a): Segmented Result for year 2004; Scale:10; Shape:0.5; Compactness: 0.3
Figure 2(b):Segmented Result for year 2004; Scale:10; Shape:0.5; Compactness: 0.3
Thus the obtained dimension features has been used for classification with the help of nearest neighbourhood configuration algorithm. The methodology adopted in the study is shown in Figure 3.
3. RESULTS AND DISCUSSIONS
Arithmetic features such as NDVI, NDWI, MRVI, and Red Ratio were created from the multispectral image to be used as class discrimination criteria during the image classification. Some other features used are mean, standard deviation, Hue, Saturation and Intensity values based on various image layers ; Shape Index and Length/Width based on Geometry; GLCM mean, GLCM entropy, GLDV mean, GLDV entropy values for different image band layers based on texture. Using a set of optimum features ensures that the classes used for LULC classification were discriminated with high accuracy and the dimensionality was for the efficient use of training samples. Feature Selection technique uses different approach involving class separation distance. These optimal features selected are scale dependent. The combination of these features is described as dimension in FSO tool. After compilation of selected features into the class hierarchy, the dimension resulted as 21 and 28 for year 2004 and 2009 respectively (Figure.4 (a) & (b)). The output of minimum class separation distance for the combination of features was obtained as 0.437 and 0.533, respectively.
Figure 4(a): 2004 IMAGE; Dimension: 21; Class Separation Distance: 0.437
Input Satellite Image of 2004 & 2009
Insert Thematic Layer (.Shp file) LULC vector data of 2004 Point Samples on 2004 Point Samples on 2009
Segmentation
2004- Scale –10; shape/compactness: 0.5/0.3 2009- Scale – 5; shape/compactness: 0.5/0.3
Class Hierarchy & Feature Space Optimisation(FSO)
Classification – Nearest Neighbourhood Configuration(NN)
Export Vector Layer & classification View
Figure 3: Methodology flow chart The International Archives of the Photogrammetry, Remote Sensing and Spatial Information Sciences, Volume XL-8, 2014
Figure 4(b): 2009 IMAGE; Dimension: 28 ; Class Separation Distance : 0.533
The class wise area has been represented in Table 1(a) and1 (b). The classified result and its legend has been shown in Figure. 5 (a), (b)and(c).
CLASS AREA (Sq_km)
Fallow Land 100.95
Scrub Land 49.90
Water bodies 18.26
Built-Up 32.54
Cropland 87.92
Table 1(a): Land Cover area of 2004
CLASS AREA (Sq_km)
Fallow Land 54.34
Scrub Land 41.90
Water bodies 17.50
Built-Up 34.20
Cropland 120.06
Sandy Riverine 21.26
Table 1(b): Land Cover area of 2009
Figure 5(a): Classified Image 2004
Figure 5(b): Classified Image 2009
Figure 5(c): LEGEND
The result shows addition of a new Sandy Riverine class which is estimated at 21.26 sq km and depicted in table 1 (b). As the image of 2009 is acquired during the post flood season, the area under Cropland has been increased as the land is very dynamic and fertile. Accordingly the extent of area under Fallow land and Scrubland were reduced during this year.
In nature, no abrupt change occurs; instead the area where one land cover class meets the other land cover class is a transition area and ecologically called as ecotone, containing characteristic species of each community or land cover type, and sometimes species unique to the ecotone itself. So OBIA allows for this area of transition by using fuzzy logic; i.e. the objects that occur within the ecotone belong to, and are considered as member of both classes. Here in Table 2(a) and (b), the mean value shows the fuzzy value of every class according to their number of objects and range of minimum to maximum values.
Class Object Mean Std
Table 2(a): Best Classification result 2004
Class Object Mean Std the number of objects has a range of values with its minimum to
maximum. The maximum value „1‟ represents that the object
has been classified 100% accurately. We can see that the water bodies have the lowest mean values due to its tendency to get flooding event. Feature space optimisation has been used to find out object parameters that have highest contribution to an accurate classification result. Some features like GLCM, GLDV which classifies based on the texture criterion of an object were found to be very useful for classification purpose alongwith the spectral properties. The flood prone areas which were classified under Riverine sands in 2004 were found to be under cropland during 2009 resulting in the increasing in their areal extent. The present method also considers the legacy LULC thematic layers during image segmentation. Application of scale, shape, compactness and legacy LULC vector layers led to a meaningful result in image segmentation, which further helped refining the LU/LC classification. Outcome of the study enabled generating LULC change map using automated method. This automated rule based approach has the advantage of undertaking change detection studies in cost and time effective manner. However, experience in the study shows that in case of an automatic method, ground truth information and previous manual data and
correction can form an important part of classification process. Future research will focus on the automation of selection of NRSC for their consistent guidance and encouragement. The author also would like to thank Sri Kuntal Ganguly (Research Fellow) for his timely support and assistance during this study.
REFERENCES
ECognition Trimble Community(2014). Available online: http://www.ecognition.com/community.
ECognition. Ecognition User Guide and Reference book. http://www.Definiens-imaging.com
Bruzzone, L., & Prieto, D. F. (2000). Automatic Analysis of the Difference Image for Unsupervised Change Detection. Geoscience and remote sensing, VOL.38, p. 12. IEEE
Aleksandrowicz, S., Turlej, K., Lewinski, S., & Bochnenk, Z. (2014). Change Detection Algorithm for the Production of Land Cover Change Maps over the European Union Countries. Multidisciplinary Digital Publishing Institute (p. 6). remote sensing.
Martha, T. R., Kerle, N., Westen, C. J., Jetten, V., & Kumar, K. V. (DECEMBER 2011). Segment Optimization and Data-Driven Thresholding for Knowledge-Based Landslide Detection by Object-Based Image Analysis. IEEE. VOL.49, p. 16. Geoscience and Remote Sensing.
Xiaoxia, S., Jixian, Z., & Zhengjun, L. (2004). A Comparision Of Object-oriented and Pixel-based Classification approaches using Quickbird Imagery. ISPRS ;(p. 4). Beijing.
Blaschke, T., Burnett, C., & Pekkarinen, A. (2004). Image Segmentation Methods for Object-Based Analysis and Classification. In Remote Sensing Image Analysis: Including the Spatial Domain (pp. 211-236). Berlin, Germany: Springer. The International Archives of the Photogrammetry, Remote Sensing and Spatial Information Sciences, Volume XL-8, 2014