GAUSSIAN KERNEL BASED CLASSIFICATION APPROACH FOR WHEAT
IDENTIFICATION
Ridhika Aggarwal, Anil Kumar, P. L. N. Raju and Y. V. N. Krishna Murthy
Indian Institute of Remote Sensing, Dehradun
E-mail: [email protected], [email protected], [email protected], [email protected]
Commission VI, WG VIII/8
KEYWORDS: Temporal, PCM, Kernel, Euclidean Norm (ED Norm), Weighted Constant, Entropy.
ABSTRACT:
Agriculture holds a pivotal role in context to India, which is basically agrarian economy. Crop type identification is a key issue for monitoring agriculture and is the basis for crop acreage and yield estimation. However, it is very challenging to identify a specific crop using single date imagery. Hence, it is highly important to go for multi-temporal analysis approach for specific crop identification. This research work deals with implementation of fuzzy classifier; Possibilistic c-Means (PCM) with and without kernel based approach, using temporal data of Landsat 8- OLI (Operational Land Imager) for identification of wheat in Radaur City, Haryana. The multi- temporal dataset covers complete phenological cycle that is from seedling to ripening of wheat crop growth. The experimental results show that inclusion of Gaussian kernel, with Euclidean Norm (ED Norm) in Possibilistic c-Means (KPCM), soft classifier has been more robust in identification of the wheat crop. Also, identification of all the wheat fields is dependent upon appropriate selection of the temporal date. The best combination of temporal data corresponds to tillering, stem extension, heading and ripening stages of wheat crop. Entropy at testing sites of wheat has been used to validate the classified results. The entropy value at testing sites was observed to be low, implying lower uncertainty of existence of any other class at wheat test sites and high certainty of existence of wheat crop.
1. INTRODUCTION
Classification of the remote sensing imagery has always drawn the attention of researchers. In 1969, ISRO and ICAR jointly carried out a study using multispectral airborne data to identify root wilt disease in coconut (Dadhwal et al., 2002). Since then, one of the core areas of research is to develop techniques for specific crop identification from remote sensing data.
Traditionally, per pixel classification has been used for crop identification. But, the technique holds well only when the spatial resolution of sensor matches the Land Use/ Land Cover class on the ground and there does not exist any spectral mixing at inter-class boundaries. Such an ideal condition is hard to achieve, as for the sensors designed for repetitive coverage have coarser spatial resolution. The problem of occurrence of mixed pixels can be tackled by applying fuzzy based classification approach. The concept of fuzzy set theory was put forward by Zadeh, 1965, to handle the uncertainty in class assignment. The technique generates fractional estimation of classes in a pixel and hence is a better option to generate classified maps with better accuracy using remote sensing datasets.
Bezdek et al., 1981, improved a fuzzy based classification technique; Fuzzy c-Means (FCM) which was proposed by Dunn (1973). The iterative clustering algorithm assigns membership value to a pixel corresponding to all the classes. In FCM, the membership value is a measure of the “degree of sharing” of the pixel for the class. While in the case of PCM; a slightly varied classification technique proposed by Krishnapuram and Keller, 1993, the membership value represents “the degree of belongings or compatibility or typicality” (Chawla, 2010). PCM algorithm has the capability to extract single class and handle the problem of noise and outliers, which commonly exist in the remote sensing data.
FCM and PCM fail to give results with higher accuracy, when the classes are linearly non- separable. In such a situation, inclusion of kernels in the existing algorithms is the solution. Kernels are tools which take data to a higher dimension, such that the classes are linearly separable by a hyper plane. Kernel methods have been used to improve the results of paramedic linear methods and neural networks in various applications (Gómez-Chova et al., 2011). In 2002, Zhang and Chen presented a kernel- based fuzzy c- means clustering algorithm which was tested on spherical dataset and real iris data. Unlike FCM, Kernel based Fuzzy c- Means (KFCM) algorithm could successfully separate the clusters. Kumar et al., 2006, studied the effect of different kernels while generating density estimation using SVM with respect to overall sub-pixel classification accuracy of multi-spectral data.
The spectral response of every Land Use/ Land Cover class is distinct, which is basically dependent on the interaction of electromagnetic radiation with the surface. While using single date imagery it can be a challenge to identify a specific target crop, as the spectral response of the target class may overlap with other class(s).
Analysis of multi- temporal imagery gives a solution to the problem by considering the phenological response of the vegetation (forest, various crops). Misra et al., 2012 used multi- temporal data of LISS- III, AWiFS and TM from Landsat 5 and Possibilistic c- Means classification technique for extracting sugarcane (Plant/ Ratoon) crop in Deoband city, Uttar Pradesh.
number of spectral bands also increases. Hence, to reduce the spectral dimensionality of the data, temporal indices are generated. While, the other advantages of vegetation indices as mentioned in Jensen, 2009, are to maximize the sensitivity of plant biophysical parameters and to radiometrically correct the satellite imagery. Musande et al., 2012, concluded that mixed pixels in coarser data sets can be handled by proper selection of suitable temporal data sets along with appropriate vegetation index and fuzzy classifier. Fuzzy based noise classifier (NC) was used on time series of five vegetation indices (SR, NDVI, TNDVI, SAVI and TVI) derived from AWiFS for cotton crop identification. Overall accuracy of 96.03% was observed for TNDVI indices, using NC. One of the ways to evaluate the accuracy of the classified fractional outputs of coarser resolution imagery could be to carry out image to image accuracy assessment in which higher resolution imagery is pre-requisite. Crop identification is accompanied by a complexity that, previous year reference image cannot be used for accuracy assessment. As such land use classes are dynamic in nature. And fractional output generated from finer resolution temporal data may not be available. In such a case, entropy measurement technique is used. It is generated using membership values from testing sites. Foddy, 1996, used entropy to estimate the uncertainty in the classification. Later, Deghan and Ghassemian, 2006, modified the formula to calculate entropy. This entropy criterion can summarize the uncertainty as a single number per pixel per class in an image.
India is the one of the leading consumer of wheat in the world. Wheat industry undoubtedly holds an important position in the policies of government and lives of the people. Hence, importance of monitoring and mapping wheat cannot be overlooked. The specific crop mapping is essential input for crop acreage and yield estimation.
The basic intent of carrying out this research is to propose a soft classifier algorithm which has the capability to extract single class with better accuracy, dealing with non- linearity within the classes. Specific objectives include (1) to implement specific fuzzy based classifier with and without kernel approach for specific crop identification. , and (2) to evaluate number of temporal images that may be best suited for wheat crop identification. In order to achieve the research objectives, mapping of wheat crop was carried out using fuzzy classification approach with and without kernel based approach on multi-temporal data in Radaur City, Haryana.
2. TEMPORAL VEGETATION INDEX, CLASSIFICATION AND VALIDATION
APPROACH
Crops can be well discriminated based upon their interaction with electro-magnetic radiation. The spectral response of a crop, which is dependent upon chlorophyll and water content is distinct from other crops when observed in time or / and spectral domain. While dealing with multi- temporal dataset of multispectral imagery, classification process is not possible due to bi- dimensional dataset that is spectral and time domain. Hence, to reduce the spectral dimensionality of the dataset, vegetation index images have been generated. The generated image is radiometrically correct and the class of interest is enhanced from the background. The vegetation indices are generally calculated by applying mathematical operations on visible and infrared spectral bands to yield single value, which is an indicator to the amount of vegetation within a pixel
Although there exist many other vegetation indices, but Normalized Difference Vegetation Index (NDVI) has been chosen for the present study. Normalized Difference Vegetation Index (NDVI) was proposed by Kriegler et al. (1969) and the mathematical expression is given by equation (1). The index enhances the class of interest in the imagery and normalizes the effects of differential illumination in the area. The value ranges from -1 to +1, where the negative values represent non-vegetated areas while, positive values represent non-vegetated areas.
emphasizes the representative feature point and de-emphasizes the unrepresentative feature point present in the data.
The objective function for PCM was modified by Krishnapuram& Keller, 1993, which is given by equation (2),
∑ ∑( ) ( ) ∑ ∑ collection of vector of cluster centers,
ij is class membership values of a pixel, c and N are number of clusters and pixels respectively, m is a weighting component (1<m<
), which controls the degree of fuzziness.The class memberships, ij are obtained from equation (3),
⁄
(3)
PCM fails to correctly classify the pixels when the classes are linearly non-separable. Kernel methods are known to deal the situations when the training samples in the data are low and the data has different noise. In this paper a robust supervised fuzzy classification technique; Kernel based Possibilistic c- Means algorithm (KPCM) has been presented. Its basic idea is to transform the low dimensional input data into a higher dimensional feature space via a linear method. After the implementation of kernels, the classes become linearly separable and PCM is performed on the feature space.
The mathematical representation of Gaussian kernel given in Mohamed and Farag, 2004 is given by equation (4). Local kernels are based on distance function and the resultant values are solely influenced by the data that are in proximity.
( ) (4)
Where,
(Euclidean Norm)
(Variance Co-Variance Norm)
(Diagonal Variance Co-Variance Norm)
Hence, the objective function of Kernel based Possibilistic c- Means (Zhang and Chen, 2003) is given by equation (5):
∑ ∑ || ( )||
∑ ∑ (5)
The updated membership value can be computed as given by equation (6);
⁄ ⁄ (6)
The crop cultivated in a field may vary in every sowing season. Therefore, last season data cannot be used as a reference data. Thus, the accuracy assessment of the fractional images generated as output from the various soft classifiers has been done using entropy based criterion. It is an indirect way, but can visualize the pure uncertainty of the classification results (Dehgan and Ghassemian, 2007). Entropy of a pixel can be calculated as given by equation (7) (Dehgan and Ghassemian, 2007).
∑ ⁄ ( ⁄ ) (7)
3. TEST SITE AND DATA USED
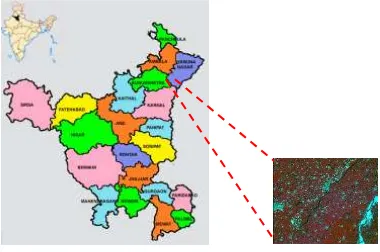
The test site selected for this research work, shown in figure 1, is Radaur City and its surroundings, part of Haryana state. The central latitude and longitude of the study area are 30.001389˚
N, 77.146969˚ E respectively. The main crops grown in the
study area are wheat, sugar cane, rice, and plantations like poplar, mango. For this study, remotely sensed temporal images of Operational Land Imager (OLI) sensor aboard Landsat-8 satellite were selected for wheat crop identification.
Figure 1. Study Area
Total eight cloud free scenes of the study areas were available during the complete phenological cycle of the crop. The datasets for Landsat-8 have been mentioned in Table 1 with standard FCC temporal images been shown in Figure 2.
Landsat 8 –OLI
12 November 2013
Date 1 (D1) 16 February 2014
Date 5(D5)
28 November 2013
Date 2 (D2) 20 March 2014
Date 6 (D6)
14 December 2013
Date 3 (D3) 05 April 2014
Date 7 (D7)
30 December 2013
Date 4 (D4) 21 April 2014
Date 8 (D8)
Table 1. Temporal Landsat-8 Datasets
12 Nov 2013 28 Nov 2013 14 Dec 2013
30 Dec 2013 16 Feb 2014 20 Mar 2014
05 Apr 2014 21 Apr 2014
Figure 2. Study area depicted through temporal Landsat- 8 OLI images
4. METHODOLOGY ADOPTED
Figure 2. Methodology adopted
Figure 3. Methodology Adopted
5. RESULT AND DISCUSSION
Normalized Difference Vegetation Index (NDVI) images were generated from a medium resolution (30.0 m) OLI sensor data. These were used to generate temporal spectral wheat crop growth profiles. The spectral growth curve at the training site has been shown in figure 4.
Figure 4. Spectral growth curve of wheat at training site
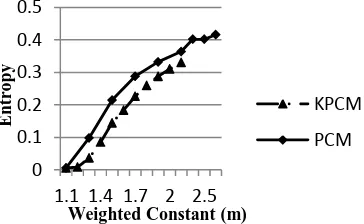
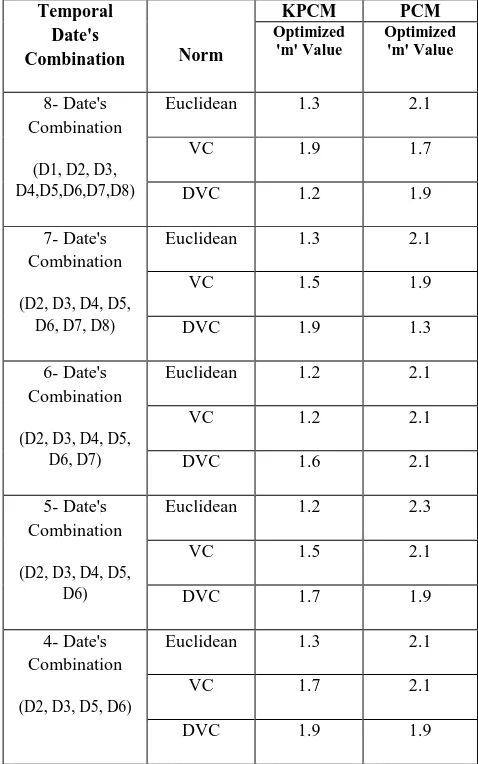
The weighted constant; m was optimized for 8-, 7-, 6-, 5-, 4- date’s combination using PCM and KPCM for Euclidean, Variance- Covariance norm and Diagonal Variance- Covariance norm. The graphs shown in figure 5a and 5b depict the variation in entropy as m was varied for 8- and 5- date’s combination. The weighted constant for KPCM in the case of 8- and 5- date’s combination has been optimized at 1.3 and 1.2 respectively. While, in the case of PCM optimized 'm' was observed at 2.1 and 2.3 respectively.
Figure 5a. m vs. Entropy for 8- date’s combination
Figure 5b. m vs. Entropy for 5- date’s combination The figure 6a, is the output result obtained from Gaussian Kernel based Possibilistic c-Means for Euclidean norm, with 8- date’s combination. Many of the fields could be identified after weighted constant (m) was optimized in comparison with the results obtained from PCM, as shown in Figure 6b.
Figure 6a. 8 Date’s Combination (KPCM-ED Norm); optimized m= 1.3
Figure 6b. 8 Date’s Combination (PCM-ED Norm); optimized m= 2.1
While, as the number of date for classification was lowered down to 5, in which the data that corresponds to variation in sowing and harvesting were dropped led to better results. Figure 6c represents the result from KPCM for Euclidean Norm, in which the testing and training sites of wheat gives higher membership values and thus wheat fields were well identifiable. Whereas, in figure 6d, output from PCM classifier the membership values corresponding to the testing and training wheat sites did not have high membership values.
0 0.2 0.4 0.6 0.8
N
D
V
I
Temporal Landsat-8 Data
NDVI
0 0.1 0.2 0.3 0.4
1.1 1.4 1.7 2 2.5
En
tr
o
p
y
Weighted Constant (m)
KPCM
PCM
0 0.1 0.2 0.3 0.4 0.5
1.1 1.4 1.7 2 2.5
En
tr
o
p
y
Weighted Constant (m)
KPCM
PCM Landsat-8 OLI Temporal Data
Temporal NDVI Database
Creation of Training Data
Supervised Soft Classification
Experiments Conducted:
1. Possibilistic c- Means classification with Euclidean, Variance- Covariance and Diagonal Variance- Covariance norm
2. Kernel based Possibilistic c- Means classification approach. Gaussian Kernel with Euclidean, Variance- Covariance and Diagonal Variance- Covariance norm
Figure 6c. 5 Date’s combination, for three different norms, viz.; Euclidean Norm, Variance- Covariance (VC) Norm and Diagonal Variance Covariance (DVC) Norm.
Table 2. Optimized 'm' Value for PCM and KPCM
6. CONCLUSION
From the results of the carried out research, it is evident that multi-temporal images are competent to identify specific crop; wheat. It has been observed that to identify wheat crop, it is not necessary to have all the temporal imagery covering the complete phenological cycle of the crop. This study concludes, 5 dates combinations which represents tillering, stem extension, heading and ripening growth stages of the wheat crop was sufficient to use as temporal dates data to identify majority of the wheat fields in the study area. For accurate classification it is necessary to optimize the value of weighted constant for both the classifiers (PCM and KPCM). The weighted constant for 5 dates combination data using KPCM classifier was optimized at 1.2. It was observed that wheat pixels from background pixels were well separable in the case of KPCM- Euclidean norm as compared to PCM results and other norms. The value of entropy when weighted constant was successfully optimized was found to be low, indicating lower uncertainty in the classified results.
REFERENCES
Bezdek, J. C., Coray, C., Gunderson, R., and Watson, J., 1981. Detection and characterization of cluster substructure I. Linear structure: fuzzy c-lines. SIAM Journal on Applied Mathematics, 40(2), pp. 339-357.
Chawla, S., 2010. Possibilistic c-means-spatial contextual information based sub-pixel classification approach for multi-spectral data. University of Twente Faculty of Geo-Information and Earth Observation (ITC), Enschede.
Dadhwal, V. K., Singh, R. P., Dutta, S., and Parihar, J. S., 2002. Remote sensing based crop inventory: A review of Indian experience. Tropical Ecology, 43(1), pp. 107-122.
Dehghan, H., and Ghassemian, H., 2006. Measurement of uncertainty by the entropy: application to the classification of MSS data. International journal of remote sensing, 27(18), pp. 4005-4014.
Dunn, J. C., 1973. A Fuzzy Relative of the ISODATA Process and Its Use in Detecting Compact Well-Separated Clusters, Journal of Cybernetics 3, pp. 32-57.
Foody, G. M., 1996. Approaches for the production and evaluation of fuzzy land cover classifications from remotely-sensed data. International Journal of Remote Sensing, 17(7), pp. 1317-1340.
Gómez-Chova, L., Muñoz-Marí, J., Laparra, V., Malo-López, J., and Camps-Valls, G., 2011. A review of kernel methods in remote sensing data analysis. Optical Remote Sensing, pp. 171-206. Springer, Heidelberg.
Jensen., J. R., 2009. Remote Sensing of the Environment. 2nd Edition. Pearson Education, pp: 382-399.
Kriegler, F. J., Malila, W. A., Nalepka, R. F., and Richardson, W., 1969. Preprocessing transformations and their effects on multispectral recognition. Remote Sensing of Environment, VI ,Vol. 1, pp. 97
Kumar, A., Ghosh, S. K., and Dadhwal, V. K., 2006. Study of mixed kernel effect on classification accuracy using density estimation. Mid-term ISPRS symposium, ITC.
Misra, G., Kumar, A., Patel, N. R., Zurita-Milla, R., and Singh, A., 2012. Mapping specific crop-A multi sensor temporal approach. Geoscience and Remote Sensing Symposium (IGARSS), 2012 IEEE International, pp. 3034-3037.
Mohamed, R., and Farag, A. A., 2004. Mean field theory for density estimation using support vector machines. Seventh International Conference on Information Fusion, Stockholm , pp. 495-501.
Musande, V., Kumar, A., Kale, K. V., and Roy, P. S., 2012. Temporal Indices Data for Specific Crop Discrimination using Fuzzy Based Noise Classifier. XXII ISPRS Congress in Melbourne,
Zhang, D., and Chen, S., 2002. Fuzzy clustering using kernel method. International Conference on Control and Automation, 2002.
Zhang, D. Q., and Chen, S. C., 2003. Kernel-based fuzzy and possibilistic c-means clustering. Proceedings of the International Conference Artificial Neural Network, Istanbul, Turkey. pp. 122-125.