GLOBAL LAND COVER CLASSIFICATION
USING MODIS SURFACE REFLECTANCE PROSUCTS
Kiyonari Fukue, Haruhisa Shimoda
Tokai University Research and Information Center, 2-28-4 Tomigaya, Shibuya-ku, Tokyo 151, Japan - (smd, fku)@keyaki.cc.u-tokai.ac.jp
Commission VII, WG VII/4
KEY WORDS: Global, Land Cover, Classification Algorithm, Multi-temporal, Multi-spectral, Co-occurrence Matrix, Non- Parametric Classifier
ABSTRACT:
The objective of this study is to develop high accuracy land cover classification algorithm for Global scale by using multi-temporal MODIS land reflectance products. In this study, time-domain co-occurrence matrix was introduced as a classification feature which provides series signature of land covers. Further, the non-parametric minimum distance classifier was introduced for time-domain co-occurrence matrix, which performs multi-dimensional pattern matching for time-time-domain co-occurrence matrices of a classification target pixel and each classification classes. The global land cover classification experiments have been conducted by applying the proposed classification method using 46 multi-temporal(in one year) SR(Surface Reflectance) and NBAR(Nadir BRDF-Adjusted Reflectance) products, respectively. IGBP 17 land cover categories were used in our classification experiments. As the results, SR and NBAR products showed similar classification accuracy of 99%.
1. INTRODUCTION
Land cover maps of global or continental scale are basic information for many kinds of applications, i.e. global change research, modeling, resource management, etc. Several kinds of global land cover maps has been generated, such as IGBP DISCover Global Land Cover, UMD Global Land Cover, and MODIS Land Cover, etc., and these products have been distributed widely. However, accuracies of these global land maps were not sufficiently high. Most of these land cover maps were generated mainly using NDVI and its seasonal changes. However, NDVI data lose most of information contents which were originally included in many channels.
The objective of this study is to develop high accuracy land cover classification algorithm for global scale by using multi-temporal MODIS land reflectance products. There are two kinds product of Surface Reflectance 8-Day L3 product and Nadir BRDF-Adjusted Reflectance 16-Day L3 product. Both are composed of 7 spectral bands (620-670nm, 841-876nm, 459-479nm, 545-565nm, 1230-1250nm, 1628-1652nm, and 2105-2155nm) with 500m ground resolution. The former is the atmospheric corrected surface reflectance, while the latter corrects the BRDF effects in addition to the atmospheric correction. In this report, these products are called SR product and NBAR product, respectively.
2. STUDY AREA AND SOURCE DATA SET
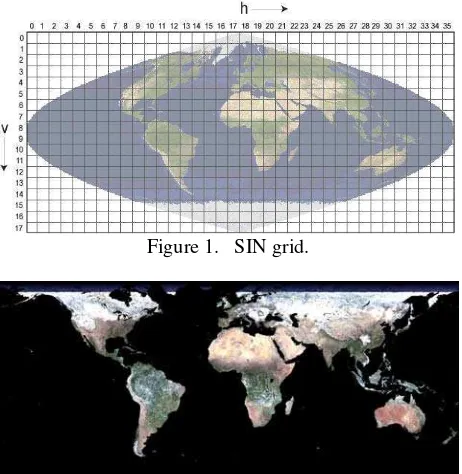
The target area set in this study covers 140゚(from 70゚ north to -70 ゚ south) and 360 ゚ for latitude and longitude direction, respectively. The region is covered by about 280 sinusoidal projection(SIN) grids which are distribution granule of SR and NBAR products (as shown in Figure 1). The SR and NBAR products of about 280 SIN grids were mosaicked and transformed to geographic longitude-latitude coordinate system
with 0.005 degree interval as shown in Figure 2. This processing was performed by using MODIS Reprojection Tool (MRT) which has been distributed from Land Processes DAAC. Because SR and NBAR products have been produced in eight-day period, mosaic images of 46 scenes were generated as classification target data set for one year of 2007.
Figure 1. SIN grid.
Figure 2. A result of mosaic and geometric transform.
( the scene of 2007.01.01)
3. PROPOSED CLASSIFICATION ALGORITHM
The International Archives of the Photogrammetry, Remote Sensing and Spatial Information Sciences, Volume XLI-B7, 2016 XXIII ISPRS Congress, 12–19 July 2016, Prague, Czech Republic
This contribution has been peer-reviewed.
3.1 Classification Feature
In this study, time-domain co-occurrence matrix was introduced as a classification feature which provides time-series signature of land covers. Each elements (i, j) of the time-domain co-occurrence matrix is defined as probability that two pixels with a specified time-separation delta-t in the same spatial position have pixel value i and j. Conventional co-occurrence matrix(that is spatial domain co-occurrence matrix) represents spatial texture while the proposed time-domain co-occurrence matrix represents time-series signature.
Figure 3a shows pixel values of annual time-series data conceptual. The time-domain co-occurrence matrices shown in Figure 3b are derived from this time-series data in the case of one month separation. That is, a time-series changing pattern of pixel values produces the corresponding probability distribution pattern in the matrix. Time-domain co-occurrence matrix takes advantage of robustness against data loss and noise derived from cloud and undesirable fluctuation of calculated reflectance values.
(a) annual time-series
(b) time-domain co-occurrence matrices Figure 3. Conceptual examples of time-domain
co-occurrence matrix.
In our experiments, two kinds of pixel value were examined. The first one is surface reflectance. The second one is spectral cluster that is extracted by clustering in seven spectral bands for 46 scenes data set. It is expected that spectral clusters absorb undesirable fluctuation of surface reflectance. And time separation delta-t from one to six months were examined in order to search proper delta-t.
3.2 Classifier
The non-parametric minimum distance classifier was introduced for time-domain co-occurrence matrix. Cosine distance dn(x,c) between a pixel-x and a training class-c were examined in this experiments. The distance dn(x,c) are defined as Eq.(1).
Mx,b(i,j) is a component (i, j) of the time-domain co-occurrence matrix measured from band-b in time-series data set for a pixel-x. Mc,b(i,j) is that measured from band-b time-series data set for the training area of a class-c.
In our experiments, spatial fuzzyfication was applied to Mx,b(i,j) in order to improve reliability of Mx,b(i,j) which is sparse matrix. Figure 4 shows concept of the fuzzyfication and its membership function. The spatial fuzzyfication decreases fluctuation of geometrical location of a pixel pair with a time-separation delta-t.
0.07 0.1 0.07
0.1 0.32 0.1
0.07 0.1 0.07
Figure 4. Figure 4 Concept of spatial fuzzyfication and its membership function
4. CLASSIFICATION EXPERIMENTS
4.1 Land Cover Category
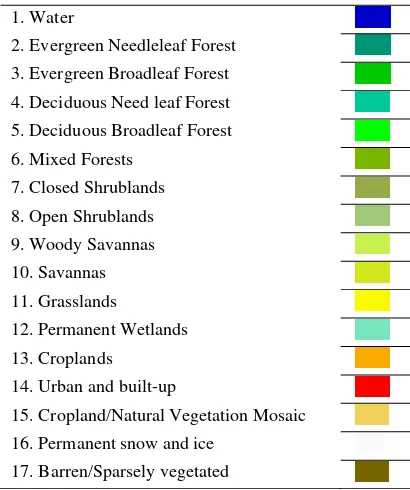
Table 1 presents the land cover categories which are same with IGBP Land cover categories. These 17 categories were used in our classification experiments.
Table 1. Land cover categories(IGBP legend). 1. Water
2. Evergreen Needleleaf Forest 3. Evergreen Broadleaf Forest 4. Deciduous Need leaf Forest 5. Deciduous Broadleaf Forest 6. Mixed Forests
7. Closed Shrublands 8. Open Shrublands 9. Woody Savannas 10. Savannas 11. Grasslands
12. Permanent Wetlands 13. Croplands
14. Urban and built-up
15. Cropland/Natural Vegetation Mosaic 16. Permanent snow and ice
17. Barren/Sparsely vegetated
dn x,c = 7
b=1 i j
M2 x,b i,j
7
b=1 i j
M2c,b i,j 7
b=1 i j
Mx,b i,j Mc,b i,j
delta-t
fuzzy pixel crisp pixel
(a)spatial fuzzy pair (b)membership function
The International Archives of the Photogrammetry, Remote Sensing and Spatial Information Sciences, Volume XLI-B7, 2016 XXIII ISPRS Congress, 12–19 July 2016, Prague, Czech Republic
This contribution has been peer-reviewed.
4.2 Training and Accuracy Estimation
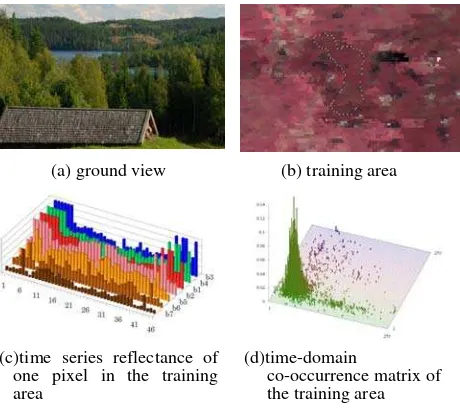
84 classification classes were prepared for IGBP 17 categories, because each category consists of several classification classes. About 9,000 pixels on the average for each class and about 400,000 pixels in total have been extracted as training data. Figure 5 and Figure 6 show examples of training data for "evergreen needleleaf forest" and " barren/sparsely vegetated", respectively. Figure 7 shows examples of obtained time-domain co-occurrence matrix for "deciduous needleaf forest" and " savannas".
(a) ground view (b) training area
(c)time series reflectance of one pixel in the training area
(a) ground view (b) training area
(c) time series reflectance of one pixel in the training area
(d) time-domain occurrence matrix of the training area Figure 6. Training data example for "barren/sparsely vegetated".
Classification accuracies were measured by using test samples of 300 pixels that were sampled randomly from training area of each individual class.
(a)"deciduous needleaf forest" (b) " savannas" Figure 7. Examples of obtained time-domain co-occurrence
matrix.
4.3 Classification Results
Because the cosine distance classifier has always produced several percent higher mean producer's classification accuracy than that of the Euclidean distance classifier regardless of the time-separation delta-t, only the results when the cosine distance is used is shown in the following. When time-domain co-occurrence matrix is defined with reflectance, the highest accuracy of 95%-96% has been obtained for SR and NBAR products when time-separation delta-t is about 3 months as shown in Figure 8.
Time Separation Delta-t [month]
SR NBAR
96%
95%
Figure 8. Classification accuracies obtained by time-domain co-occurrence matrix which is defined with
30 60 120 250 500 1000 2000 4000 8000
C
Figure 9. The relationship between the number of clusters and classification accuracies obtained by time-domain co-occurrence matrix which is defined with spectral cluster. When time domain co-occurrence matrix is defined with spectral cluster, classification accuracies are increased according to the number of clusters as shown in Figure 9. The
The International Archives of the Photogrammetry, Remote Sensing and Spatial Information Sciences, Volume XLI-B7, 2016 XXIII ISPRS Congress, 12–19 July 2016, Prague, Czech Republic
This contribution has been peer-reviewed.
highest accuracy of about 99% has been obtained for SR and NBAR products when time-separation delta-t is about 4 months as shown in Figure 10.
Time Separation Delta-t [months] SR (8000 clusters)
NBAR (8000 clusters) 99.3%
99.0%
Figure 10. Classification accuracies obtained by time-domain co-occurrence matrix which is defined with 8000 spectral clusters.
The time-domain co-occurrence matrix defined with 8000 spectral cluster shows 3%-4% higher classification accuracy than that of the time-domain co-occurrence matrix defined with reflectance.
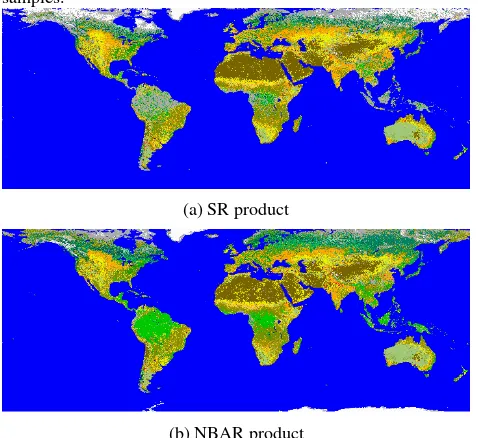
MOD12Q1 and MCD12Q1 of MODIS land cover product which are respectively produced from SR and NBAR products showed classification accuracy of 81% and 96%, respectively. That is, the classification accuracy obtained by the time-domain co-occurrence matrix which is defined with spectral cluster is 3%-18% higher than that of MODIS land cover products. Classification accuracies of MODIS land cover product were measured by using same test samples. Because test samples were extracted from training area for classification of SR and NBAR products, it is fundamentally presumed that the accuracy of MOD12Q1 and MCD12Q1 products is lower than that of our classification results. However, we consider that these classification accuracies of SR and NBAR products showed good performance of the proposed simple classification method. Figure 11 shows the classification results obtained by cosine distance classifier in the case of the highest accuracy.
5. CONCLUSIONS
Land cover classification for global scale were performed by using two kinds of multi-temporal MODIS reflectance products. The proposed method using the time-domain co-occurrence matrix and the non-parametric minimum distance classifier showed good classification performance compared with MOD12Q1 and MCD12Q1 MODIS land cover product.
The highest classification accuracy was obtained when the non-parametric cosine distance classifier was driven by the time-domain co-occurrence matrix defined with spectral cluster and three or four months time-separation. And also, it was cleared that Surface Reflectance 8-Day L3 product and Nadir BRDF-Adjusted Reflectance product showed similar classification accuracy of 99% for IGBP-17 land cover categories.
Future study should be carry out in our classification scheme in order to examine stability of classification for multiple years
and to validate classification accuracy with more suitable test samples.
(a) SR product
(b) NBAR product
Figure 11. Land cover classification results.
ACKNOWLEDGEMENTS
This study was supported by the JAXA GCOM-C project under contract "JX-PSPC-422935".
REFERENCES
Bartholome, E. and Belward, A. S., 2005, GLC2000: a new approach to global land cover mapping from Earth observation data. International Journal of Remote Sensing, Vol. 26, No. 9, 1959–1977, May.
De Fries, R. S., Hansen, M., Townshend, J. R. G. and Sohlberg, R., 1998, Global land cover classifications at 8 km spatial resolution: the use of training data derived from Landsat imagery in decision tree classifiers, International Journal of Remote Sensing, vol. 19, no. 16, 3141-3168.
Gir, C., Zhu, Z., 2005, Bradley Reed, A comparative analysis of the Global Land Cover 2000 and MODIS land cover data sets. Remote Sensing of Environment, 94, 123–132.
Friedl, M.A., McIver, D.K., Hodges, J.C.F., et al., 2002, Global land cover mapping from MODIS: algorithms and early results. Remote Sensing of Environment, 83, 287–302
Hansen, M. C., Defries, R. S., Townshend, J. R. G. and Sohlberg, R., 2000, Global land cover classification at 1 km spatial resolution using a classification tree approach. International Journal of Remote Sensing, vol. 21, no. 6 & 7, 1331–1364, November.
Loveland, T. R., Reed, B. C., Brown, J. F., et al., 2000, Development of a global land cover characteristics database and IGBP DISCover from 1 km AVHRR data. International Journal of Remote Sensing, vol. 21, no. 6 & 7, 1303–1330, November Alan Srahler, Doug Muchoney, etc., 1 May 1999. MODIS Land Cover Product Algorithm Theoretical Basis Document (Version 5.0)
The International Archives of the Photogrammetry, Remote Sensing and Spatial Information Sciences, Volume XLI-B7, 2016 XXIII ISPRS Congress, 12–19 July 2016, Prague, Czech Republic
This contribution has been peer-reviewed.