ENTITIES AND FEATURES FOR CLASSIFCATION OF AIRBORNE LASER SCANNING
DATA IN URBAN AREA
S. Xu*, S. Oude Elberink, G. Vosselman
Faculty of Geo-Information Science and Earth Observation, University of Twente, Netherlands - (xu26860,
oudeelberink, vosselman)@itc.nl
Commission IV, IV/4
KEY WORDS: Classification, Feature, Segmentation, Point Cloud
ABSTRACT:
We aim at efficiently classifying ALS data in urban areas by choosing an optimal combination of features and entities. Three kinds of entities are defined, namely, single points, planar segments and segments obtained by mean-shift segmentation. Various features are computed for these three entities. All derived features are assigned to different steps of our method. Our method is composed of a sequence of rule based classifications. After a rule based classification for planar segments and a context rule based classification for walls and roof elements 85% of the data are well classified. Errors mainly appear in the area where rules are difficult to define, such as vegetation close to walls and above roofs. To eliminate these errors, we first group all the points in these areas into segments using mean shift, and then search for segments with potentially misclassified points using a distance ratio. These mean shift segments are then re-classified using another rule based classification. The overall quality of our classification method reaches to 98.1%.
* Corresponding author.
1. INTRODUCTION
Classification is a difficult and important task in various applications of data from Airborne Laser Scanning (ALS) in urban areas (Niemeyer et al. 2011). The challenge for a good classification result is to define suitable entities and features. A part of existing classification tasks is implemented on point based features (or pixel-based features). These methods offer information of each point (pixel) with its neighbours to obtain accurate classification results. Other works proposed to use segment or voxel based features, which aim at speeding up the computation. Although features were analyzed, compared and selected in literature (Chehata et al. 2009), entity selection is seldom discussed.
Therefore, we propose an approach to classify ALS data in urban area by using combination of different types of entities and their features. The classes used are roofs, walls (including balconies), roof elements on top of roofs, vegetation, ground surface, water surface and others (corresponding colours used for these classes in the figures are: yellow, pink, orange, dark blue, light green, light blue and white). Three kinds of entities are defined, and their features are used in different phases of our classification.
2. RELATED WORK
Classification methods on DSM can be found at (Matikainen et al. 2007; Rutzinger et al. 2006; Rottensteiner et al. 2004). Matikaninen et al. (2007) used a list of features calculated from DSM segments and a classification tree to extract buildings in urban areas. Rutzinger et al. (2006) chose crisp thresholds for features derived from DSM segments to detect buildings.
Different from these two segment-based methods, Rottensteiner et al. (2004) achieved a per-pixel classification using Dempster-Shafer Fusion.
For classification methods that directly run on 3D point clouds, typical entities are points, segments and voxels. Methods using point based features can be found at (Lafarge and Mallet 2011; Niemeyer et al. 2011). Lafarge and Mallet (2011) used features generated from points with its neighbours. These features were then normalized and tested in an energy function. Choices of class labels were made by minimization of the energy function. Niemeyer et al. (2011) combined the feature with contextual information of each point and conditional random field was used for classification.
Works based on segments are (Wei et al. 2009; Darmawati, 2008; Lim and Suter, 2008). Normalized cut was used to classify segments derived by mean shift in Wei’s work. In Darmawati’s method rule based classification was run on planar segments derived by surface growing. Pulse count information was used to separate building and vegetation in urban areas. Lim and Suter (2008) used over segmentation results and multi-scale conditional random field to classify point clouds.
Methods using voxel features can be found in (Lim and Suter, 2009). They first grouped points into big units, namely, super voxels and then features were derived by aggregating features of the points within voxels. Lim and Suter (2009) used a multi-scale conditional random field among voxels, and within each voxel.
Although all these approaches provide convincing results, they use only one kind of entity for their classifications. If different ISPRS Annals of the Photogrammetry, Remote Sensing and Spatial Information Sciences, Volume I-4, 2012
entity based features are used in a classification for different utilizations, high quality classification and efficient computation may be combined.
3. ENTITIES AND FEATURES
3.1 Three Types of Defined Entities
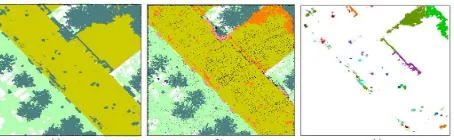
We defined three kinds of entities (Figure 1), namely, single points (a), planar segments (b) and segments obtained by mean-shift segmentation (c). Features of single points are derived from either the point itself or from a set of neighbouring points within some radius. Planar segments are obtained by a surface growing segmentation (Vosselman et al. 2004). Segment features are derived from properties of the segment or by aggregating features of the points within a segment. Every point in a segment has the same feature values. The same holds for the segments derived by Mean Shift segmentation (Comaniciu and Meer, 2002; Ferraz et al. 2010). Because of different segmentation algorithms, the grouping of points to segments, and also the segment feature values are different.
Figure 1. Three types of entities used in our paper
3.2 Features Definitions
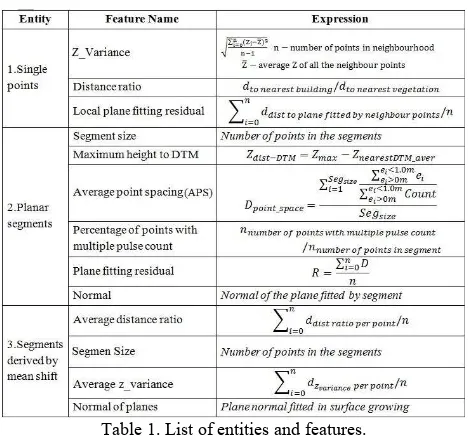
For these three entities various features are computed. The mathematical expressions for each feature are listed in Table 1 and feature behaviours are analyzed in the following sections.
Table 1. List of entities and features.
3.2.1 Features for a Point: Point based features are employed as either a feature for classification of a single point or as a feature that is aggregated to a segment feature for a segment based classification. We calculated three point based features.
Z-variance is the variance of the Z-coordinates of the
neighbourhood points. It is introduced mainly to separate roof
elements and vegetation above roofs (distributions of two classes are shown in Figure 2 (a)). A likelihood probability density function (Figure 2 (b)) is generated from 56 tiles of reference data with a total of 9,236,374 points. Points that are more likely to be vegetation covering roofs provide positive probability values and points with negative values are more likely to be roof elements.
Distance ratios are calculated based on the results of the rule
based classification for planar segments. Assuming that all points are labeled correctly, points that are nearer to vegetation and further away from roofs are more likely to be vegetation points. This feature is used as an input feature for Mean Shift, and is also used as a feature for the resulting segments.
Local plane fitting residuals represent the roughness of a plane fitted to a point and its neighbours. Planar objects like roofs tend to have a smaller value than irregular objects like vegetation.
(a) (b)
Figure 2. (a) Normalized Z-variance Histograms; (b) Likelihood function of vegetation covering roofs and roof elements.
3.2.2 Features for Planar Segment: Planar segments are derived by a surface growing algorithm. Their features are used in first rule based classifier to gain a coarse classification result.
Figure 3. Planar Segments Derived by Surface Growing (a) Surface growing segmentation on a tree (different colours show different segments); (b) and (c) are two segments from (a); (d) one segment from roof; (e) one segment from water surface; (f) one segment from ground surface. The APS in (d) is smaller than (b) and (c), APS in (f) is smaller than in (e).
The size of each segment approximately indicates the area of
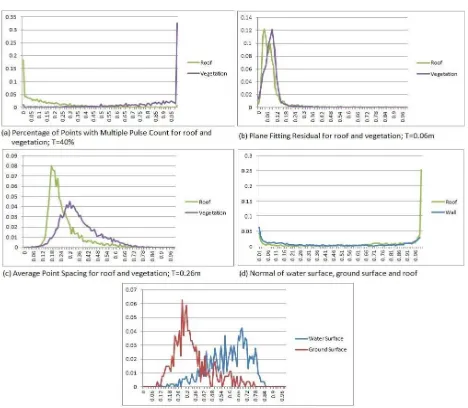
segment and is expressed by the number of points in the segment. Maximum height to nearest DTM points allows the distinction between high objects (roofs and vegetation) and low objects. Average point spacing (APS) is dedicated to separate water from ground surface (Figure 3(e)(f)). It also shows a significant difference in value for planar segments of vegetation and building roofs (Figure 3(b~d)). Because vegetation is over-segmented into multiple planar segments, the APSs for these segments are larger than for roof segments. This provides a solution to ALS data without pulse count information. The ISPRS Annals of the Photogrammetry, Remote Sensing and Spatial Information Sciences, Volume I-4, 2012
values of Percentage of points with multiple pulse count
differentiate between vegetation and roof segments. Combinations of APS and pulse count information improve the detection rate of vegetation. Different behaviours of these features are shown in distinguished colours in Figure 4.
Figure 4. Behaviours of planar segment features. (Red colour - low value, green colour - high value). All the behaviours of features for objects above ground are shown in group (1), white points are DTM points; feature behaviour for ground and water is shown in (2), white represent no points.
3.2.3 Features for Mean Shift Segment: A single entity type cannot easily represent complicated objects. For example, there is no unique characteristic of building walls because of various types of walls and because of different appearance of laser points on walls caused by the scanning angle. A unique property of walls is that they are always below the nearest building roofs. Similar property holds for roof elements. However, areas with vegetation that are near or covering building roofs are frequently seen in complex urban scene (Figure 5 (a)). This vegetation is easily incorrectly classified as roof elements or walls. For these areas, points that share the same topological relationship with the same building roofs are grouped to one component (Figure 5 (b)). A Mean Shift segmentation is performed per component to re-cluster points according to their locations and features (Figure 5 (c)). The distance ratio, X-, Y- and Z-coordinate are the input features for Mean Shift.
Figure 5. (a) Building roofs with vegetation and roof elements, the latter misclassified as vegetation. (b) All points above the roof are classified as roof elements after using context information. (c) These points are re-clustered (different colours represent different clusters) by Mean Shift, which splits the vegetation points and roof elements.
For the resulting clusters that are defined as segments derived by mean shift, four attributes (Listed in Table 1) are calculated
by aggregating the point feature values within the segment. Another rule based classification is run on these segments.
4. CLASSIFICATION STRATEGY
Our method is composed of three rule based classification phases. Different entity features are used in each phase. Initially, data is filtered into ground and objects above ground with LAStools (http://www.cs.unc.edu/~isenburg/lastools/). Planar
segment based features are used in the first rule based
classification to speed up the classification and to get an approximate separation into ground, water surface, vegetation, roofs and others. Context rules are then used to classify walls and roof elements. After these steps, we found that errors mainly appear in the places where rules are difficult to define and used features are not sufficient to make correct distinctions, such as vegetation covering building roofs. To eliminate these errors, we search for locations with potential misclassifications that are near vegetation points. Mean Shift derived segment features and Point based features are used in the last rule based classification which is only run in these locations
4.1.1 Classification for Planar Segments: Definitions (Table 2) are given to each class of interest according to the appearance of real objects, namely rules, which help us initialize the classification. With these defined rules, a classification tree (Figure 6) is built up to classify the data. Thresholds on the nodes of the tree are either given by the common knowledge or by the feature distribution statistic analysis (Figure 7).
Table 2. Definitions of classes in the rule based phase.
The tree starts with objects above ground. Tall objects and low objects are initially separated and other planar segment features are used in sequence. Water and ground surface are classified using the average point spacing. Unsegmented points are treated as one-point segments.
Figure 6.Classification Tree in rule based process. ISPRS Annals of the Photogrammetry, Remote Sensing and Spatial Information Sciences, Volume I-4, 2012
Figure 7. Normalized histograms of each planar segment feature value. These histograms indicate the thresholds for
classification tree.
4.1.2 Context Rule based Classification: Assuming that all large roof points are correct, walls and roof elements are classified according to the context information.
The context information defined in this paper is that walls are always near and below roofs, and that roof elements are always near and in a higher location than roofs. Following this rule, we associate each point with the nearest roof point and check their topological relations. For complicated buildings such as tall buildings connected to low buildings, the classification of wall points will be incorrect if the lower roof is nearer than the higher roof (Pink points in Figure 8(a)).
Therefore, we employed two preferences to relate wall and roof element points to the right roof points. First, for each wall point, association with a roof point is preferred when its neighbourhood contains both roof and ground points. Second, association with a highest roof point is preferred when roof points from tall and low building are in the neighbourhood. With these two preferences, the defined context is correctly executed and walls and roof elements are separated (Figure 8(b)).
Figure 8. Complex building. (a) The wall points are wrongly classified as roof elements (orange), which are caused by random choice of roof points; (b) Points in rectangles are correct (pink) by choosing correct corresponding roof points.
4.1.3 Classification for Mean Shift Segments: After the process of planar segments classification and the context rule classification, three categories of errors may occur. The first kind of error occurs if features insufficiently distinguish the classes. The second type of error is caused by the context rule classification of wall and roof elements. Vegetation covering the roof is wrongly classified as roof elements. This is one of the main errors and it can be corrected. The third kind of error happens on the boundaries of the data tiles, where an object is cut. This leads to changes in the segment feature values as well as to a lack of context. This can be corrected by processing tiles with overlapping areas to keep the integrity of most objects.
In this phase, we aim at correcting the second and third type of errors. For the second error we segment possible erroneous points with Mean Shift and re-classify them with new segments and the corresponding features (Process shown in Figure 9). Mean Shift is a non-parametric clustering method that runs in feature space, which does not require the prior knowledge of cluster (segment) numbers and can form any shape of segments. Possible misclassification locations are determined as points that are classified as wall and roof elements. Mean shift is run on these points to re-organize the points so that all points that are very close to vegetation points are clustered as one unit, and these units of points have the highest likelihood to be part of vegetation. Figure 10 demonstrates this process.
Figure 9. Further process for segments derived by mean shift
Figure 10. Second Type Error Correction. The second type of error in (c) is caused by context rule classification (orange points are vegetation points that are wrongly classified as roof elements).
As the classification was performed tile by tile, roof corners at tile boundaries may form small segments. These small segments are often misclassified. For third kind of error, we generate 5 m wide overlaps with the 8 neighbours of the processed tile. These overlap areas participate in the classification. However, only the results within processed tile are stored. Figure 11 indicates the elimination of third type of error.
(a) (b)
Figure 11. Correction of the third type error. In red rectangles, the labels are different, (b) is processed with overlaps. Roof points that are wrongly classified as vegetation (a) are corrected in (b), and ground surface that are assigned as others (a) are corrected in (b).
5. RESULTS AND ANALYSIS
We tested our entities and features on a 1.5km2 dataset acquired in 2010 in Rotterdam, Netherlands with a point density of about 40 points/m2, and the completeness and correctness of the classification results are calculated point by point on 56 randomly selected tiles with a total of 9,236,374 points. Meanwhile, we tested our features with and without “pulse count” information and tile overlaps, and the results are compared.
5.1 Results for Classification
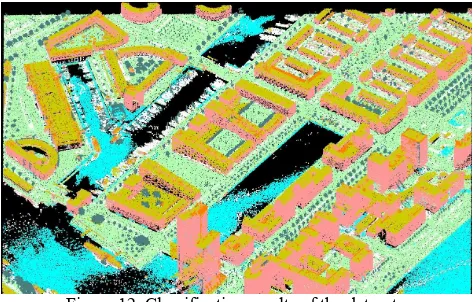
The overall result of classification for the dataset is shown in Figure 12. Several instances for complicated scenes are shown in Figure 13. Correct instances are connected buildings with different heights (a), building walls with different shape of balconies (b), building roof covered by vegetation (c), ground surface and dense water surface (d) and building roof cut by tile boundary (e). Incorrect classification results of vegetation, roof, wall and water are shown in Figure 13(f~i).
Figure 12. Classification results of the dataset.
Completeness and correctness are computed (Table 2), and confusion matrix (Table 3) for each class is calculated on the reference data (typical harbour objects like cranes, boats and bridges were not considered). Completeness and correctness are
both high. With the confusion matrix we analyzed the errors for each class of interest and divided the errors into four types.
Figure 13.Some classification results. (a~e) are correct, (f~i) show some incorrect results in red rectangles.
Type A error is the error caused by the limitations of our algorithm, such as the classifiers. Type B error is the error caused by the filtering algorithm from LAStools. Type C error refers to errors caused by the data quality, such as data absorption on top of roofs and lack of data by occlusion. Type D error is caused by insufficient context information, such as walls that are far away from the roof. All the errors are assigned to these four types in the confusion matrix. Type A and Type B errors affect most of the classes’ accuracy.
Table 2. Classification results per class.
Table 3. Confusion matrix labelled with dominant error type.
5.2 Impact of pulse and tile boundary
Pulse count is considered as a useful feature for vegetation classification. However, particularly in summer when vegetation may be too dense to generate multiple echoes of laser pulses. The use of tile overlaps keeps the integrity of the objects. In order to assess how much the pulse count information and tile overlaps will improve the detection rate and accuracy, we classified the data with pulse count and tile ISPRS Annals of the Photogrammetry, Remote Sensing and Spatial Information Sciences, Volume I-4, 2012
overlaps and without them and compared the results on the reference data.
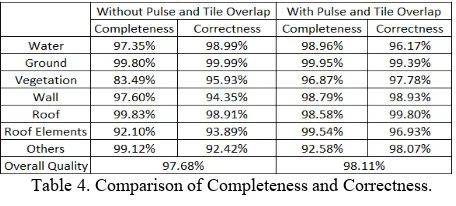
Table 4 shows that the overall quality of classification is improved by 0.4% after tile overlaps and pulse count information are added. The completeness of vegetation gained 13.4% improvement by adding the pulse count information and tile overlaps. However, no evident improvement of correctness is obtained. For walls, no distinct enhancement of completeness is obtained, but the correctness is raised by 4.5% after adding pulse count information and tile overlaps.
Table 4. Comparison of Completeness and Correctness.
6. CONCLUSION
In our research it is identified that accurate results can be obtained using rule based methods on ALS data if suitable entities are defined, features are properly chosen and data is filtered accurately. Average Point Spacing is sensitive to the point density of data. Strip overlaps in the planar segment that decrease the value of point spacing effect the classification results of vegetation and water surface. This could be improved by correcting feature values in strip overlaps. In dense vegetation areas, classification using only APS results in a low completeness of vegetation. Pulse information and the tile overlaps can improve the detection rate of vegetation but do not increase the accuracy of vegetation. They make a small, but significant improvement to the overall quality of our classification.
It is notable that the accuracy result shows a lower completeness for class others, which indicates incorrect classification of “others” to the other classes. The confusion matrix (Table 3) indicates that most other points are classified as vegetation points. This is caused by lack of a class definition for poles and wires in urban areas. Meanwhile, there are some tree classification errors (Figure 13 (f)) in our results. These errors are caused by wrong classification of vegetation to roofs during the planar segment classification phase. The surrounding points are therefore wrongly classified as walls and roof elements in the context rule classification.
Our classification performs well on large point clouds with or without pulse count information. These results will be used for object based change detection in urban areas in the future.
REFERENCE
Chehata, N., Guo, L., Mallet, M., 2009. Airborne lidar feature selection for urban classification using random forests. In: The International Archives of the Photogrammetry, Remote Sensing
and Spatial Information Sciences, Pairs, France, Vol. XXXVIII,
Part 3/W8, pp.207-212.
Comaniciu, D. and Meer, P., 2002. Mean shift: a robust approach toward feature space analysis. IEEE Transactions on
Pattern Analysis and Machine Intelligence, May, 24(5), pp.
603-619.
Darmawati, A. T., 2008. Utilization of multiple echo information for classification of airborne laser scanning data. Master’s Thesis, International Institute for Geo-Information Science and Earth Observation (ITC), Enschede, the Netherlands.
Ferraz, A., Bretar, F., 2010. 3D segmentation of forest structure using a mean-shift based algorithm. On: Image Processing
(ICIP), 2010 17th IEEE International Conference, Hong Kong,
China, 26-29 September, pp. 1413-1416.
Lafarge, F and Mallet, C., 2011. Modeling urban landscapes from point clouds: generic approach. Report: INRIA-00590897, Version 1-5 May, Laboratoire I3S, France.
Lim, E. H. and Suter, D., 2008. Multi-scale conditional random fields for over-segmented irregular 3d point clouds classification. On: IEEE Computer Society Conference on
Computer Vision and Pattern Recognition Workshops, 23-28
June, Anchorage, AK. Vols 1-3, pp. 856-862.
Lim, E. H. and Suter, D., 2009. 3D terrestrial lidar classifications with super-voxels and multi-scale conditional random fields. Journal of Computer Aided Design, 41(10), pp.701-710.
Matikainen, L., Kaartinen, H., Hyyppä, J., 2007, Classification tree based building detection from laser scanner and aerial image data. In: The International Archives of the Photogrammetry, Remote Sensing and Spatial Information
Sciences, Espoo, Finland, Vol. XXXVI, Part 3/W52,
pp.280-287.
Niemeyer, J.; Mallet, C., Rottensteiner, F., Sörgel, U., 2011. Conditional random field for the classification of lidar point clouds. In: The International Archives of the Photogrammetry,
Remote Sensing and Spatial Information Sciences, Hannover,
Germany, Vol. XXXVIII, Part 4/W19, pp. On CD-ROM.
Rottensteiner, F., Trinder, J., Clode, S., Kubik, K.., 2004, Fusing airborne laser scanner data and aerial imagery for the automatic extraction of building in densely built-up areas. In:
The International Archives of the Photogrammetry, Remote
Sensing and Spatial Information Sciences, Istanbul, Turkey,
Vol. XXXV, Part B3, pp. 512-517.
Rutzinger, M., Höfle, B., Geist, T., Stötter, J., 2006. Object based building detection based on airborne laser scanning data within GRASS GIS environment. In: Proceedings UDMS 2006:
Urban Data Management Symposium, Aalborg, Denmark.
Chapter 7, Part II, pp.37-48.
Vosselman, G., Gorte, B.G.H., Sithole, G., Rabani, T., 2004. Recognising structure in laser scanner point clouds. In: The International Archives of Photogrammetry, Remote Sensing and
Spatial Information Sciences, Freiburg, Germany, Vol. XXXVI,
Part 8/W2, pp. 33-38.
Wei, Y., Hinz, S., Stilla, U., 2009. Object extraction based on 3d-segmentation of lidar data by combining mean shift with normalized cuts: two examples from urban areas. In: Urban
Remote Sensing Event, 20-22 May, pp. 1-6.