UNDERSTANDING CROP GROWING PATTERN IN BARDHAMAN
DISTRICT OF
WEST BENGAL USING MULTI-DATE RISAT 1 MRS DATA
Neetu, Meghavi Prashnani, Dhiraj K. Singh, Rakesh Joshi, and S. S. Ray
Mahalanobis National Crop Forecast Centre, DAC, MoA, Pusa Campus, New Delhi
([email protected], [email protected], [email protected], [email protected], [email protected])
KEY WORDS: RISAT-1 MRS, Multi-date data, Rice, Jute, Growing pattern
ABSTRACT:
Information on crop phenology is essential for evaluating crop productivity and crop management. Phenological phases of rice and jute show great inter-annual variability and also large spatial distribution in West Bengal. Hence, it is essential to map the pheonological patterns. In this study spatio-temporal monitoring of the growing pattern of rice and other crops was carried out using multi-date RISAT-1 MRS data in the major rice growing region of Bardhaman district of West Bengal. RISAT-1 provides C band (5.3Ghz) SAR data. The MRS (Medium Resolution ScanSAR) mode data with HH polarization having spatial resolution of 25 m and swath 115 km was used for this study. Total fifteen sets of MRS SAR data (with repetivity of 25 days) covering a complete year (May, 2013 to April, 2014) was used. Pre-processing of multi-date MRS data included georeferencing, calibration, image-image registration and speckle removal using Lee filter. Groundtruth collected during various cropping seasons (pre-Kharif, Kharif and Rabi) were used to generate crop signature pattern based on which hierarchical decision based models could be formed for classification. The periodic backscatter pattern of different crops and crop sequences were analysed. Accuracy of rice crop classification was higher by using 4-date data, compared to 3-date data. Rice transplanting patterns (Early, Normal and Late), both for Kharif and Rabi, could be identified using multi-date data. Major transplanting period for Kharif Rice was Early August and that of Rabi Rice was Early February.
1. INTRODUCTION
Phenology is the study of recurrent biological events and the causes of their temporal change due to biotic and abiotic forces (Lieth, 1974). Crop growing pattern mainly has relation not only to weather and variety, but also to the regional planting habit. As regards plants, phenological studies provide an understanding of the timing of the main seasonal events, such as bud-burst, flowering, leaf colouring or leaf fall. Characterization of vegetation phenology at regional, national and global scales has been recognized as important for many scientific and practical applications (Upadhyay et al., 2008).
Field observations and satellite data are important tools for understanding phenological responses. Multi-temporal satellite images composites are now of standard use in land cover classification of large areas at regional and global scales (Carrao et al., 2008; Ray et al., 2014). Sensitivity of SAR to canopy geometry and moisture can be suitably exploited not only for crop discrimination but also to get crop area (Bush and Ulaby, 1978; Chakraborty et al., 2006). Differential attenuation of grain crops of HH versus VV-Polarization have been studied (Attema and Ulaby, 1984 and Le Toan et al, 1984).
Multi-Date SAR data has been successfully used to discriminate different crops, especially rice, from other covers (Brown et al., 1984; Parihar et al., 1998). These data were used to study the temporal backscatter coefficient of the several crops in relation to their growth stage. Macelloni et al (2001) also found results in modelling the backscatter for the wheat crop during its various growth stages and estimated the cover under wheat.
RISAT-1, India’s first SAR satellite has been proven to be very useful in various applications (Chakraborty et al., 2013). The MRS data of RISAT-1 has been very successfully used for operational crop area assessment of rice and jute crops (Ray et al., 2014).
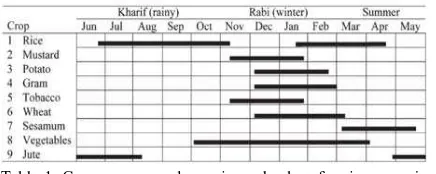
West Bengal state of India is a major rice growing region of the country. In many parts of the state, Rice is grown in multiple seasons (Table 1). Other crops which are grown in sequence with rice include Jute, Potato, Rice, Mustard, etc. Because of this multiple rice sequence and also wide variations in the spatio-temporal pattern of growing of rice, it is a very ideal case of using muti-temporal SAR data for studying the cropping season in West Bengal.
Table 1. Crop seasons and growing calendar of major crops in the study area (Source: Panigrahy et al., 2014)
2. STUDY AREA AND DATA SETS
The study area includes a few blocks of Bardhaman District of West Bengal. Bardhaman district is situated in the central part of south Bengal. It is surrounded by Birbhum, Murshidabad and Dumka of Jharkhand on the north, Nadia on the east, Hooghly, Bankura and Purulia on the south. This part of West Bengal is major in Kharif Rice, Rabi rice and Potato growing area but less in Jute, sugarcane and Til (Sesame) growing. Bardhaman has Damodar river and near river mostly potato crop is grown in winter season. Net sown area of the district is 64.74% of total geographical area. Hence the district is rich in agriculture production.
The RISAT-1 satellite operates at a frequency of 5.3 GHz (C-band). Multi-date RISAT-1 MRS (18 m resolution) C-band HH polarized data have been used for this study. Fifteen sets of The International Archives of the Photogrammetry, Remote Sensing and Spatial Information Sciences, Volume XL-8, 2014
ISPRS Technical Commission VIII Symposium, 09 – 12 December 2014, Hyderabad, India
This contribution has been peer-reviewed.
SAR data were acquired on different dates covering various crop seasons. Details of SAR data according to crop periods are given below in Table 2. Data was used ranging from 3-May, 2013 to 19-April, 2014 at 25 days interval.
Date Major crop of
Table 2. Dates of SAR date used in the study.
3. METHODOLOGY
3.1 SAR Data Pre-processing
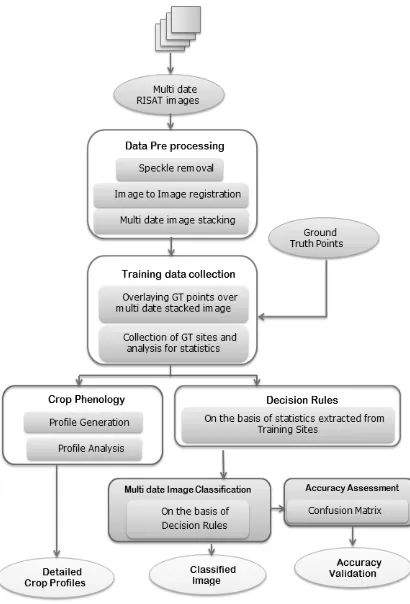
The pre-processing (speckle removal, image to image registration) of multi-date RISAT-1 data was carried out in FASALSoft and in ERDAS Imagine 2011software. FASALSoft is an indigenous software developed by Space Applications Centre (SAC, ISRO), Ahmedabad. Speckle suppression was carried out using Enhanced Lee filter with a 5x5 window size. The data calibration was carried out using the antenna gain and offset values obtained from the header file and the incidence angle array generated using radar analysis package. Geo-referencing of all the dates data was carried out using second order polynomial model in the FASALSoft software. Analysis process was done in ERDAS Imagine software. The multi-temporal co-registered SAR data was used to identify different crops and other land use based on the ground truth collected from the fields during different crop growing periods. The ground truth sites were marked on the image and the multi-temporal signatures were analysed from the mean and standard deviation values of the backscatter. The flow chart of the procedures is presented in Figure 1.
3.2 Ground Truth Collection
Jute crop is sown in last week of March to mid-April, Kharif Rice in the last week of June to third week of August and Rabi Rice in the first week of January to third week of March in the study area. The ground truth information was collected, once during each crop period, using smartphone and android based application developed by National Remote Sensing Centre (NRSC), Hyderabad. The ground truth information included crop parameters like field size, crop cover, other competitive crop and expected sowing and harvesting date, soil parameter like moisture status, and photographs of the field. The parameters were uploaded real time on Bhuvan Server for use by the analyst in MNCFC.
Figure1. Flowchart of methodology followed in this analysis.
4. RESULTS AND DISCUSSION
From the ground truth information, classification of multi-temporal data was carried out with hierarchical decision rule classification technique, based on the statistics of mean backscatter and deviation from mean. After masking out the water, settlement, urban and fallow land by the decision rules, the vegetation area was then discriminated into different crops based on the temporal backscatter response. The understanding of the interaction of SAR data with rice and jute crops and knowledge of their plant morphology, cultivation practices and field environment were used for the development of the decision rules. The logical model was coded in model maker macro language of ERDAS Imagine software, which classified the rice, jute and potato areas as well as other non-crop areas. Detailed methodology for crop classification using multi-date SAR data is presented in Chakraborty et. al, (2006).
4.1 Accuracy assessment for 4-date and 3-date SAR data for rice
Satellite dates of data acquisition depend upon the crop calendar as mentioned in the Table 1. Although we have acquired the RISAT-1 MRS data throughout the year to cover the entire sequence of crops grown in the area, as far as rice is concerned, we studied the optimum number of dates of data required to improve the accuracy. Rice classification was attempted using both 3-date and 4-date SAR data. The analysis showed that, both overall accuracy and kappa coefficient were for rice classification using 4-date data compared to 3-date data (Table 3). In the Figure 2, it can be seen that some pixels were misclassified (Blue colour) when analysis was done using three The International Archives of the Photogrammetry, Remote Sensing and Spatial Information Sciences, Volume XL-8, 2014
ISPRS Technical Commission VIII Symposium, 09 – 12 December 2014, Hyderabad, India
This contribution has been peer-reviewed.
dates but these pixels could be removed using four date classification (Green Colour).
Table 3: Accuracy comparison between 4 date and 3 date classification
Figure 2: Classified image of three date data (Blue) overlaid on classified image for four dates (Green)
4.2 Rice (Kharif and Rabi) Temporal Pattern
Rice is the most important crop of the district. Paddy covers maximum of the gross cropped area and is grown both in Kharif and Rabi season. Other crops grown in the region include jute (summer), potato (early Rabi) and oilseeds (Rabi). Five differently behaving sites of window size 4 x4 km were chosen and their signatures were collected based on ground truth (Figure 3a). Temporal profile of different area of different blocks are shown in figure 3b and corresponding crop pattern followed in different blocks, as found from ground truth and available literature are shown in table 4.
Major cropping patterns in Bardhaman district include paddy-wheat-vegetables, paddy – potato – sesame, paddy – vegetable – mustard and jute – paddy – vegetables (Anonymous, 2009), out of which some of the patterns could be identified using multi-date SAR data.
Site Block Crop Sequence
1 Mangalkote
Early Kharif Rice-Potato- Fallow/Vegetables
2 Kalna I Jute-Normal Kharif Rice-vegetables
3 Bhatar
Vegetables/fallow-Normal Kharif Rice- Fallow/vegetables- early Rabi Rice
4 Kalna II
Jute- Kharif rice- Fallow- late Rabi Rice
5 Raina I Kharif rice-Potato-Rabi Rice
Table 4. Crop pattern followed in selected zones of Bardhaman district.
(a)
(b)
Figure 3. a) 5 sites selected with different cropping pattern and (b) their temporal in SAR data
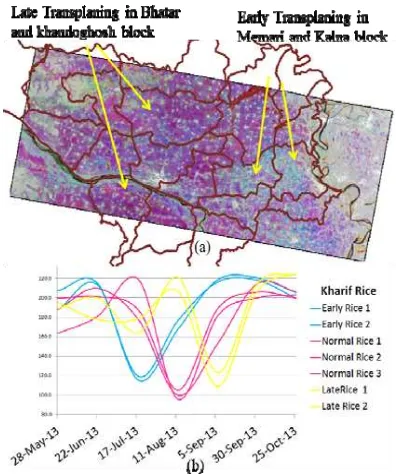
4.3 Spatial Distribution of transplanting pattern of Rice
Figure 4 shows the spatial distribution of transplanting date of rice in the study area. The magenta colour is for late rice and cyan colour shows early rice transplantation. Corresponding colours also represent the signature profile in the graph for early and late rice, respectively. It can be seen that there is early transplanting in Memari and Kalna block and mostly late transplanting in Bhatar block of Bardhaman district. It can also be concluded that mostly kharif rice is transplanted in the month of August in Bardhaman district.
Figure4. Spatial distribution of transplanting pattern The International Archives of the Photogrammetry, Remote Sensing and Spatial Information Sciences, Volume XL-8, 2014
ISPRS Technical Commission VIII Symposium, 09 – 12 December 2014, Hyderabad, India
This contribution has been peer-reviewed.
5. CONCLUSION
Rice is the most important crop of the Bardhaman district. Mult-date C band SAR data of RISAT-1 was analysed for rice classification and assessment of rice growing pattern. Higher classification accuracy was obtained when 4 date was used instead of conventional 3 date data. Different cropping patterns followed in different blocks of district could be identified using multi-date SAR data. Spatial distribution of transplanting date of rice crop was also mapped, which showed that Kharif rice is mostly transplanted during 15th July to 15th August, in the study area. Thus, multi-date SAR data not only could be used for rice crop classification but also assessing the growing pattern.
ACKNOWLEDGEMENTS
The authors are also grateful to Sh. Sanjeev Gupta, Joint Secretary, Department of Agriculture and Cooperation for constant encouragements. Thanks are due to State Agriculture Department Officials who have collected Ground Truth.
REFERENCES
Anonymous. 2009. Annual Report, 2005-06, Department of Agriculture, Government of West Bengal, Writers’ Buildings, Kolkata-700 001. 174 p.
Attema, E.P.W., Ulaby, F.T., 1984. Vegetation modeled as a water cloud. Radio Science, 13, pp. 357-364.
Brown, R .J., B. Guindon, P. M. Teillet & D. G. Goodenough, 1984. Crop Type Discrimination from Multi-temporal SAR Imagery, Proceedings, 9th Canadian Symposium on Remote Sensing, St. Johns, Newfoundland, pp 683-691.
Bush, T. T., Ulaby, F. T., 1978, An Evaluation of Radar as a Crop Classifier, Remote Sensing of Environment, 7, pp 15-36. Carrao, H., Gonçalvesc, P., Caetanoa, M. 2008. Contribution of multispectral and multitemporal information from MODIS images to land cover classification. Remote Sensing of Environment, 112:986-997.
Chakraborty M., S. Panigrahy, A. S. Rajawat, R. Kumar,T. V. R. Murthy, D. Haldar, A. Chakraborty, T. Kumar, S. Rode, H. Kumar, M. Mahapatra, S. Kundu, 2013. Initial results using RISAT-1 C-band SAR data, Current Science, 104(4), pp. 490-501.
Chakraborty, M., Patnaik, C., Panigrahy, S., Parihar, J. S., 2006. Monitoring of wet season rice crop at state and national level in India using multidate synthetic aperture radar data, Proc. SPIE 6411, Agriculture and Hydrology Applications of Remote Sensing, 641103 (9 December 2006); doi: 10.1117/12.693900
Le Toan, T., Lopes, A. & Huete, M.,1984. On the relationship between radar backscattering coefficient and vegetation canopy characteristics. In Proceeding of International Geoscience and Remote Sensing Symposium, pp. 155-160.
Lieth H, 1974. Phenology and Seasonality Modeling, Springer, Heidelberg.
Macelloni, G., Paloscia, S., Pampaloni, P., Marliani, F., Gai, M., 2001. The relationship between the backscattering coefficient and the biomass of narrow and broad leaf crops.
IEEE Transactions on Geoscience and Remote Sensing, 39, pp. 873 – 884.
Panigrahy, S., Manjunath, K.R., Ray, S. S. 2005. Deriving cropping system performance indices using remote sensing and GIS. Int. J. Rem. Sens. 26(12): 2595-1606.
Parihar, J. S., Chakraborty, M., Manjunath, K. R., Panigrahy, S., 1998. Synthetic Aperture Radar Data As A Sustainable System For Monitoring The Rice Cropping Systems - An Analysis, ISPRS Archives – Volume XXXII Part 1, 1998 pp. 245-255.
Ray, S. S., Neetu, Mamatha S. and Gupta, S. 2014. Use of Remote Sensing in Crop Forecasting and Assessment of Impact of Natural Disasters: Operational Approaches in India. In: Proceedings of FAO Expert meeting on crop monitoring for improved food security. 17 February 2014, Vientiane, Lao PDR
Upadhyay, Gargi, Ray, S. S., Panigrahy, Sushma, 2008. Derivation of Crop Phenological Parameters using Multi-Date SPOT-VGT NDVI Data: A Case Study for Punjab State. J. Ind. Soc. Remote Sens. 36(1):37-50.
The International Archives of the Photogrammetry, Remote Sensing and Spatial Information Sciences, Volume XL-8, 2014 ISPRS Technical Commission VIII Symposium, 09 – 12 December 2014, Hyderabad, India
This contribution has been peer-reviewed.