AUTOMATIC BUILDING DETECTION BASED ON SUPERVISED CLASSIFICATION
USING HIGH RESOLUTION GOOGLE EARTH IMAGES
Salar Ghaffarian, Saman Ghaffarian
Department of Geomatics Engineering, Hacettepe University, 06800 Ankara, Turkey.
<
salarghaffarian, samanghaffarian>@hacettepe.edu.trCommission VI, WG VI/4
KEYWORDS: Automatic Building Detection, Google Earth Imagery, Lab color space, Shadow detection, Supervised classification.
ABSTRACT:
This paper presents a novel approach to detect the buildings by automization of the training area collecting stage for supervised classification. The method based on the fact that a 3d building structure should cast a shadow under suitable imaging conditions. Therefore, the methodology begins with the detection and masking out the shadow areas using luminance component of the LAB color space, which indicates the lightness of the image, and a novel double thresholding technique. Further, the training areas for supervised classification are selected by automatically determining a buffer zone on each building whose shadow is detected by using the shadow shape and the sun illumination direction. Thereafter, by calculating the statistic values of each buffer zone which is collected from the building areas the Improved Parallelepiped Supervised Classification is executed to detect the buildings. Standard deviation thresholding applied to the Parallelepiped classification method to improve its accuracy. Finally, simple morphological operations conducted for releasing the noises and increasing the accuracy of the results. The experiments were performed on set of high resolution Google Earth images. The performance of the proposed approach was assessed by comparing the results of the proposed approach with the reference data by using well-known quality measurements (Precision, Recall and F1-score) to evaluate the pixel-based and object-based performances of the proposed approach. Evaluation of the results illustrates that buildings detected from dense and suburban districts with divers characteristics and color combinations using our proposed method have 88.4% and 853% overall pixel-based and object-based precision performances, respectively.
1. INTRODUCTION
Automatic building detection from monocular aerial and satellite images has been an important issue to utilize in many applications such as creation and update of maps and GIS database, change detection, land use analysis and urban monitoring applications. According to rapidly growing urbanization and municipal regions, automatic detection of buildings from remote sensing images is a hot topic and an active field of research.
Building detection, extraction and reconstruction have been studied in a very large number of studies; some review studies of several techniques can be found in (Mayer, 1999; Baltavias, 2004; Unsalan and Boyer, 2005; Brenner, 2005; Haala and Kada; 2010). Considering the type of data which have been used for building detection such as multispectral images, nDSM, DEM, SAR, LiDAR datasets, the existing methods can be categorized into two groups: 1-Building detection using 3D-image provider datasets, 2-Building detection through monocular remote sensing images.
This study is devoted to the autonomous detection of buildings from a monocular optical Google Earth images. Therefore, a brief discussion of the previous studies which used single optical image datasets to automatically detect the buildings will be given first. The studies in the monocular context used region growing methods, simple models of building geometry, edge and line segments and corners (Tavakoli and Rosenfeld, 1982; Herman and Kanade, 1986; Hueratas and Nevatia, 1988; Irvin and Mckeown, 1989) to detect buildings. The shadow areas are engendered with regard to height of the buildings and illumination angle of the sun in the optical remote sensing
images, and they give important clues about the location of the buildings. First, Hueratas and Nevatia (1988) used shadows to carry out the sides and corners of the building. Then, Irvin and McKeown (1989) predicted the shape and the height of the buildings using shadow information. To extract buildings from aerial images through boundary grouping, Liow and Pavalidis (1990) used shadow information to complete the boundary grouping process. Furthermore, shadow information was used as an evidence to verify the initially proposed methods (McGlone and Shufelt, 1994; Lin and Nevatia, 1998). Besides, Peng and Liu (2005) proposed a new method based on models and context that is guided with shadow cast direction which has computed using neither illumination direction nor viewing angle.
Recently, some methods have been proposed based on classification methods to detect and extract buildings from remote sensing imagery.
(2013) proposed a method utilizing integration of the texture analysis, color segmentation and neural classification techniques to detect buildings from remote sensing imagery.
Initially, the graph theory was used to detect buildings in aerial images by Kim and Muller (1999). They used linear features as vertices of graph and shadow information to verify the building appearance. Then, Sirmacek and Unsalan (2009) utilized graph theoretical tools and scale invariant feature transform (SIFT) to detect urban-area buildings from satellite images. Ok et al. (2013) proposed a new approach for the automated detection of buildings from single very high resolution optical satellite images using shadow information in integration of fuzzy logics and GrabCut partitioning algorithm. Thereupon, Ok (2013) increased the accuracy of their previous work by using a new method to detect shadow areas (Teke et al., 2011) and developing a two-level graph partitioning framework to detect buildings.
In this paper, a fully automatic method is proposed to detect buildings from single high resolution Google Earth images. First a novel shadow detection method is conducted using LAB color space and double thresholding rules. Thereafter, considering the illumination direction and shadow area information training samples are collected. An improved parallelepiped classification method is applied to classify the image pixels into building and non-building areas. Finally, simple morphological operations are executed to increase the accuracy.
2. METHODOLOGY
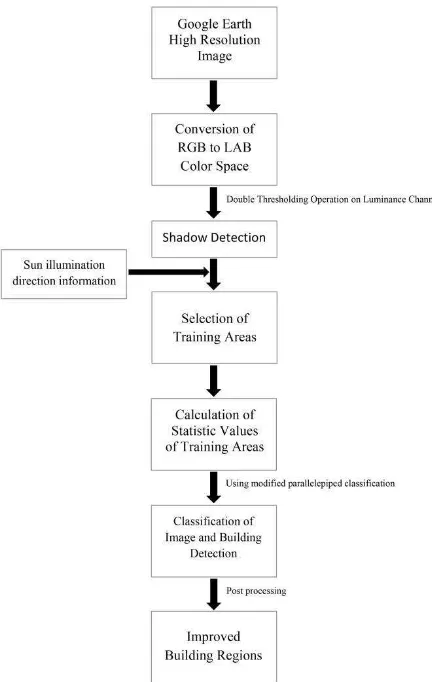
The proposed automatic building detection using supervised classification has three main steps: (Fig. 1).
Step1: Shadow detection based on novel double thresholding technique:
Shadows occur in regions where the sunlight does not reach directly due to obstruction by some object such as buildings. In this paper, we propose a novel double thresholding technique to detect shadow areas from a single Google Earth image. In order to detect shadow information automatically we convert the image from RGB to LAB color space. Since the shadow regions are darker and less illuminated than their surroundings, it is easy to extract them in the luminance channel which gives lightness information. Indeed, information of the luminance channel is utilized because of its capability in separating the objects with low and high brightness values in original image. Consequently, we put a default and a little bit coarse threshold in the range of (70 - 90) for our images with 256 bits’ depth. Utilizing this threshold allows shadow areas to be detected; but, simultaneously some of vegetation regions are detected inaccurately because of their low luminance values. To separate the vegetation and shadow areas from each other we utilize
Otsu’s (Otsu, 1975) automatic gray-level thresholding witch is very effective in isolating the bimodal histogram distribution. Although there are some mistakes in eliminating true shadow pixels, but they cannot be very effective in reducing our
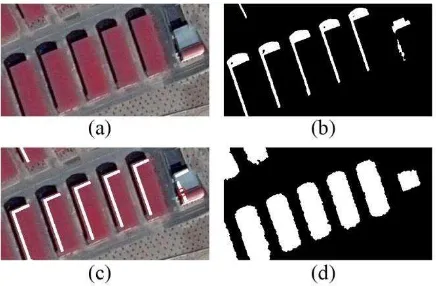
method’s accuracy to detect the buildings.( Fig. 2b).
In addition, we use some simple morphological operations to remove the shadow areas which are smaller than building shadows. In this way, we can protect our algorithm from the negative effects of tree shadows in next steps.
Figure 1. Proposed method for building detection
Step2: Supervised classification
Supervised classification is a process of categorizing pixels into several numbers of data classes on their values which are extracted from training sites identified by an analyst. Collecting training areas manually by an expert makes this method as a non-automated model of categorizing of data. Since we aim to detect the buildings automatically from the satellite images, our proposed method should be provided with training areas which are selected in an automated way.
In this study, shadow evidence is used to overcome this limitation toward automatic supervised classification. Then, an improved parallelepiped supervised classification is conducted to classify the image into building and non-building areas.
1- Automatic collection of training areas
2- An improved parallelepiped classification
The parallelepiped classifier uses the class limits and stores range information related with all the classes to determine if a given pixel falls within the class or not. For each class, the minimum and maximum values are used as a decision rule to classify the image pixels as buildings, subsequently the unclassified pixels are assigned to the non-building areas.
The parallelepiped classification method has disadvantages as follows: 1- The decision range that is defined by the minimum and maximum values may be unrepresentative of the spectral classes that they in fact represent. 2- It performs poorly when the regions overlap because of high correlation between the categories. 3- The pixels remain unclassified when they are not in the range of any classes.
In order to overcome the limitations we proposed a new thresholding method based on standard deviation of the classes, in which the pixels, which are assigned inaccurately as buildings due to these limitations, are removed considering this threshold. Furthermore, the overlapped classes, which illustrate the regions of the building values, do not affect the final results because the all training areas are merged and demonstrate the same class as building. Moreover, although in the parallelepiped classification method the remaining unclassified pixels is a very big problem for classification of the whole image when the training areas are complete and represent all the features in the entire image. However, it cannot be a disadvantage for our proposed method, because this manner of the parallelepiped classification makes it optional and ideal for our method when we try to collect training areas from the building regions instead of all the features in the images. Due to lack of information about the features except the building areas in the image, we can only use a classification method that can assign pixels just to the specific predetermined training areas, and keeps other pixels unclassified which belong to other features that are not buildings.
Figure 2. (a) Original #1 test image, (b) detected shadow areas, (c) white areas are the training samples, (d) detected building Consequently, all the pixels in the image classified considering these districts, indeed, the pixels whose are inside these districts labeled as building and others labeled as non-building.
Step3: Post-processing and finalizing the results
Although the detected buildings reveal the regions that might be the feature of interest, many false alarm areas, a set of morphological image processing operations such as openings, closings and fillings applied to the single binary image that is the output of the classified image. The opening operation generally smoothes the contour of an object, breaks narrow strips, and eliminates stray foreground structures that are smaller than the predetermined structure; Therefore, larger structures will remain. On the other hand, the closing operation not only tends to smooth sections of contours, but also fuses narrow breaks and long thin gulfs, eliminates small holes, and fills the gaps in the contour. Despite of filling of gaps in previous morphological operations, it is seen that these operations are not effective in filling larger holes. Therefore, we used morphological filling operation in order to overcome this problem at the beginning of the post-processing operations. (Fig. 2d). Turkey. The images selected specially to represent diverse building characteristics such as the sizes and shapes of buildings, their proximity and different color combinations of building roofs. The test images are showed in Fig. 3, and we provided the detected buildings in the second column for each test image.
3-2-Accuracy Assessment Strategy
The final performance of the proposed automated building detection method is evaluated by comparing the results with the reference data which are generated manually by a qualified human operator. In this study, we utilized both pixel-based and object-based quality measures. Initially all the pixels in the image are classified into four classes as follows:
1-True Positive (TP): Both manually and automated methods classified the pixel as building.
2-True Negative (TN): Both manually and automated methods classified the pixel as non-building.
3-False Positive (FP): The automated method incorrectly classified the pixel as building whereas it is truly classified as non-building with manually method.
4-False Negative (FN): The automated method incorrectly classified the pixel as non-building whereas it is truly classified as building manually.
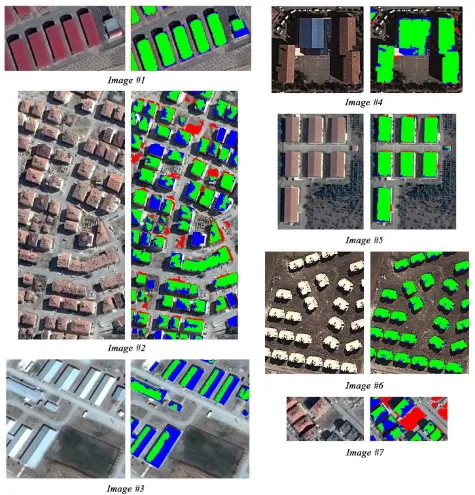
Figure 3. Test images and the results of the proposed building detection method. Green, red, blue colors represent TP, FP and FN respectively. (first column) Test images #1–3. (second column) Detected buildings for test images #1–3. (third column) Test images #4–7. (fourth column) Detected buildings for test images #4–7.
FN TP
TP recall
(2)
recall precision
recall precision F
2* *
1 (3)
Where . denotes the number of pixels assigned to each distinct
class, and
F
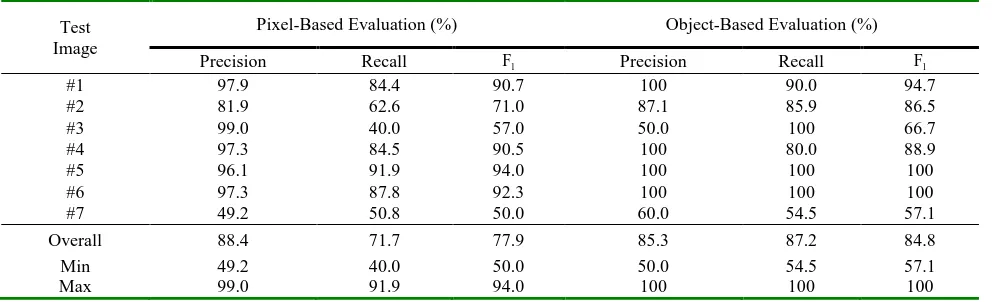
1-score is the combination of Precision and Recall into single score.Tabel 1. Numerical results of the proposed automatic building detection method
Test Image
Pixel-Based Evaluation (%) Object-Based Evaluation (%)
Precision Recall F1 Precision Recall F1 developed method is robust and representative by detecting most of the buildings without producing too many FN pixels in the images which include buildings with divers roof colors, texture, shape, size and orientation. In addition to visual illustration, the numerical results of the proposed method are listed in Table 1 which also support these findings. With regard to pixel-based evaluation, the overall mean ratio of precision and recall are computed as 88.4% and 71.7%, respectively. Further, the calculated pixel-based F1-scores for all test images are 71.7%, which indicate promising results for such a divers and challenging set of test data. Moreover, for the object-based evaluation, the overall mean ratios of precision and recall are calculated as 85.3% and 87.2%, respectively, and these results correspond to an overall object-based F1-score of 84.8 %. Considering the complexity and various conditions in the test images involved, this is a reliable pixel-based automatic building detection performance.
According to the numerical results in Table 1, the lowest pixel-based precision ratio (49.2%) is produced by the test image #7. The reason of this poor pixel-based performance in comparison with other test image performances is the proximity of the spectral reflectance values of the buildings and the background image. Whereas, the test image #3 produces the lowest object-based precision performance ratio as 50% due to big differences of contrast values between two sides of the buildings according to the illumination angle. However, it produces pixel-based precision ratio as 90%, which shows a robust result in terms of pixel-based performance.
In Fig. 3, #2 test image results show the efficiency of our proposed method in detecting buildings from dense urban areas where the buildings are so close to each other, and it produces high object-based precision, recall and
F
1-score ratios as 87.1%, 85.9% and 86.5%, respectively.The #1, #3, #4 and #7 test images are representative examples of various colors, shapes and sizes of the buildings which detected by our proposed automatic building detection method and is resulted in fairly good performance in both pixel-based and object-based assessments. Based on discussed quantitative and qualitative evaluations, we can deduce that the proposed building detection method works fairly well and has robust performance despite of such diverse challenging test images.
4. CONCLSION AND FUTURE WORKS
The majority of building detection methods has one or more limitations in automatic detections of buildings. There may be some restrictions about density of buildings areas such as urban, sub-urban and rural areas. In addition to these restrictions, there are some limitations related to shape, color and size of the buildings. To overcome most of these problems, we proposed a novel approach. This method can detect buildings without influencing from their geometry characteristics. Moreover, this method provides an automatic training area collection to seed the supervised classification methods. In this study, a novel shadow detection method based on double thresholding using RGB images is proposed and, the parallelepiped classification model is improved to detect building regions. This method is still has some incapability in separating non-building from building areas when they have similar spectral values. However, we believe that our method will supply great help for building detection applications in big scales in future.
As a future work, satellite images that offer NIR band in addition to RGB bands will be used to improve the accuracy of the shadow detection results. In addition, the image-processing operator will be enriched in order to boost the detection accuracy.
ACKNOWLEDGEMENTS
The images that are utilized in this study have been selected from Google Earth.
REFERENCES
Aksoy, S., Yalniz, I.Z., Tasdemir, K., 2012. Automatic detection and segmentation of orchards using very high resolution imagery. IEEE Transactions on Geoscience and Remote Sensing 50 (8), 3117–3131.
Baltsavias, E.P., 2004, Object extraction and revision by image analysis using existing geodata and knowledge: current status and steps towards operational systems, ISPRS Journal of Photogrammetry and Remote Sensing, vol. 58 (3-4), pp. 129– 151.
Haala, N., Kada, M., 2010, An update on automatic 3D building reconstruction, ISPRS Journal of Photogrammetry and Remote Sensing, vol. 65 (6) , pp. 570–580.
Herman, M., Kanade, T., 1986, Incremental reconstruction of 3D scenes from multiple complex images, Artificial Intelligence, vol. 30, pp. 289.
Huertas, A., Nevatia, R., 1988, Detecting buildings in aerial images, Computer Vision, Graphics, and Image Processing, vol. 41 (2) , pp. 131–152.
Inglada, J., 2007, Automatic recognition of man-made objects in high resolution optical remote sensing images by SVM classification of geometric image features, ISPRS Journal of Photogrammetry and Remote Sensing, vol. 62 (3), pp. 236–248.
Irvin, R.B., McKeown, D.M., 1989, Methods for exploiting the relationship between buildings and their shadows in aerial imagery, IEEE Transactions on Systems, Man, and Cybernetics, vol. 19 (6) , pp. 1564–1575.
Kim, T.J., Muller, J.P., 1999, Development of a graph-based approach for building detection, Image and Vision Computing, Vol. 17 (1) , pp. 3–14.
Koc-San, D., Turker, M., 2014, Support vector machines classification for finding building patches from IKONOS imagery: the effect of additional bands. Journal of Applied Remote Sensing, Vol. 8, No.1.
Lee, D.S., Shan, J., Bethel, J.S., 2003, Class-guided building extraction from Ikonos imagery, Photogrammetric Engineering and Remote Sensing, vol. 69 (2) , pp. 143–150.
Lin, C., Nevatia, R., 1998, Building detection and description from a single intensity image, Computer Vision and Image Understanding, vol. 72 (2) , pp. 101–121.
Liow, Y.T., Pavlidis, T., 1990, Use of shadows for extracting buildings in aerial images, Computer Vision, Graphics, and Image Processing, vol. 49 (2) , pp. 242–277.
Mayer, H., 1999, Automatic object extraction from aerial imagery-a survey focusing on buildings, Computer Vision and Image Understanding, Vol. 74 (2), pp. 138–149.
McGlone, J.C., Shufelt, J.A., 1994. Projective and object space geometry for monocular building extraction. In: Proc. of Computer Vision and Pattern Recognition, pp. 54–61.
Ok, A.O., 2013, Automated detection of buildings from single VHR multispectral images using shadow information and graph cuts, ISPRS Journal of Photogrammetry and Remote Sensing, Vol. 86, pp. 21-40.
Ok, A.O., Senaras, C., Yuksel, B., 2013, Automated detection of arbitrarily shaped buildings in complex environments from monocular VHR optical satellite imagery, IEEE Transactions on Geoscience and Remote Sensing, Vol. 51 (3) (2013), pp. 1701– 1717.
Otsu, N., 1975, A threshold selection method from gray-level histograms,Automatica, Vol. 11 , pp. 285–296.
Peng, J., Liu, Y.C., 2005, Model and context-driven building extraction in dense urban aerial images, International Journal of Remote Sensing, vol. 26 (7) , pp. 1289–1307.
Sirmacek, Unsalan, C., 2009, Urban-area and building detection using SIFT keypoints and graph theory, IEEE Transactions on Geoscience and Remote Sensing, Vol. 47 (4) , pp. 1156–1167.
Tanchotsrinon, C., Phimoltares, S., Lursinsap, C., 2013, An automatic building detection method based on texture analysis, color segmentation, and neural classification, 5th International conference on knowledge and smart technology (KST), pp. 162-167.
Tavakoli, M., Rosenfeld, A., 1982, Building and Road Extraction from Aerial Photographs, IEEE TRANSACTIONS ON SYSTEMS, MAN, AND CYBERNETICS, SMC-12 (1): 84-91.
Teke, M., Başeski, E., Ok, A.Ö., Yüksel, B., Şenaras, Ç., 2011,
Multi-spectral false colour shadow detection, U. Stilla, F. Rottensteiner, H. Mayer, B. Jutzi, M. Butenuth (Eds.), Photogrammetric Image Analysis, Springer, Berlin Heidelberg, Berlin, Heidelberg , pp. 109–119.
Ünsalan, C., Boyer, K.L., 2005, A system to detect houses and