OBJECT-BASED CLASSIFICATION OF MULTI-TEMPORAL IMAGES FOR
AGRICULTURAL CROP MAPPING IN KARACABEY PLAIN, TURKEY
A. Ozdarici-Ok a, *, Z. Akyurek b
aNevsehir H.B.V. University, Dept. of Geodesy and Photogrametry Engineering, 50300 Nevsehir, Turkey - [email protected] bMiddle East Technical University, Dept. of Civil Engineering, 06800 Ankara, Turkey - [email protected]
Commission VI, WG VI/4
KEY WORDS: Object-based, Multi-temporal, Crop Classification, Mean-Shift, Kompsat-2, Envisat ASAR
ABSTRACT:
The objective of this research is to classify major crop types cultivated in Karacabey Plain of north western Turkey using multi-temporal Kompsat-2 and Envisat ASAR data with an object-based methodology. First a pansharpening algorithm is applied to each panchromatic and multispectral Kompsat-2 data to produce colour images having 1m spatial resolution. Next, Mean-Shift image segmentation procedure is applied to the pansharpened Kompsat-2 data with multiple parameter combinations. Multiple goodness measures are utilized to evaluate the object-based results. The optimum objects are then employed in object-based classifications of the single-date images. Next, single-date multispectral (MS) Kompsat-2 images and Kompsat-2 images along with the Envisat ASAR data are classified with the Support Vector Machines (SVMs) method. The training samples are provided automatically by the selected objects based on spatial statistical properties. Next, probability maps are generated for each image in pixel-based manner during the image classification operations. The maximum probabilities are then assigned to the pixels as class labels and the combined thematic maps (June-July, June-August, June-July-August) are generated in pixel-based and object-based manners. The produced thematic maps are evaluated through the confusion matrices and compared also with the results of parcel-based classifications using original agricultural parcels. Results indicate that the combined thematic maps of June-August and June-July-August provide the highest overall accuracy and kappa value approximately 92% and 0.90, respectively.
* Corresponding author. This is useful to know for communication with the appropriate person in cases with more than one author.
1. MANUSCRIPT
1.1 Introduction
Agriculture is important to provide food supply and sustainable economy. However, improper land use activities because of the rapid growth in urban population negatively affects the yields of agricultural products especially in developing countries. Thus, the crop products have become even more important to meet the growing agricultural needs in recent years. Space images, the product of Remote Sensing technology, are one of the most important sources to make fast and reliable decisions in producing efficient agricultural plans. One important way to analyze the remotely-sensed data is image classification. This paper presents a multi-temporal object-based classification of the major crop types cultivated in an agricultural region of Turkey. The methodology works as follows: First each panchromatic and multispectral Kompsat-2 images are pansharpened to produce 1 m colour images. Next, Mean-Shift image segmentation method is applied to the pansharpened Kompsat-2 images with multiple parameter combinations (324 for each single-date image). Then, multiple goodness measures are utilized to evaluate the results. In this way the optimum objects are then employed in the classification operations. At first, the single-date optical images are classified. Classification operations are repeated by including the corresponding Envisat ASAR data. The Support Vector Machines (SVMs) method is utilized for the image classifications. The training samples used for the classification operations are provided automatically by the selected objects. During the image classifications, pixel-based probability maps are generated for each image. The maximum probabilities are then assigned to the pixels as class
labels. In this way the combined thematic maps (June-July, June-August, June-July-August) are generated in both pixel-based and object-pixel-based manners. Thematic maps are then evaluated through the confusion matrices.
1.2 Study Area and Data Sets
The study area is situated in Karacabey Plain, an agricultural area in Bursa, in northwest Turkey. It covers approximately 100 km2 with central geographic coordinates of 28014’12’’ E and 40011’09’’ N. The region has a temperate and semi-humid climate and is one of the most productive and valuable agricultural regions of Turkey. The mean annual temperature and mean annual precipitation are 14.40C and 706 mm, respectively. The terrain is flat, with a mean elevation of 10 m above sea level. The major crop types cultivated in the region are sugar beet, wheat, tomato, rice, and corn. The area also contains several pasture fields for livestock.
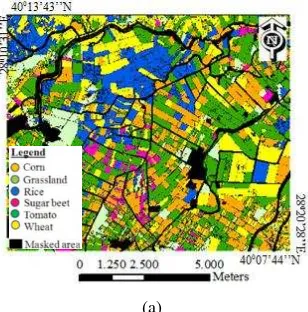
Two types of data (raster and vector) are utilised in this study. Kompsat-2 panchromatic (PAN) and multispectral (MS) optical images were acquired for three cloud-free dates representing the early-, mid- and late- growing season: June 13; July 11; and August 18 (Figure 1a). The spectral range of the PAN image (1m) is between 0.5-0.9 µm. Kompsat-2 MS (4 m) data has four spectral bands: blue, green, red, and near infrared (NIR). The spectral ranges of these bands lie between 0.45-0.52, 0.52-0.60, 0.63-0.69 and 0.76-0.90 µm, respectively (Spot Image, 2008). The pre-processing level of the Kompsat-2 images is level 2A; in which radiometric correction is applied to the images to minimise the sensor-based radiometric errors. Geometric corrections have also been applied to the images, so that the
images have been projected to a standard cartographic projection (UTM WGS 84) without any ground control points.
(a)
(b)
Figure 1. (a) True color composite Kompsat-2 MS data (July) and (b) Envisat ASAR (July) images used in the study
Besides the Kompsat-2 images, Envisat ASAR data (15 m) acquired on June 28, July 18, and August 03, 2008 in Precision Image mode are used in the study (Figure1b). This mode provides both HH and VV polarisation images with a spatial resolution between 15 m and 150 m and ground coverage of 56x105 km2. Due to technical problems during the image acquisition, only the VV polarisation images could be provided for this study. Envisat ASAR operates in C-band and the images can be acquired with various incidence angles ranging between 150 and 45.20. A total of seven acquisition configurations (IS1-…-IS7) are available for the Envisat ASAR data. Only the IS2, IS6 and IS7 configurations could be used in the study (Asar Product Handbook, 2009).
The field boundaries are manually digitised and updated by 1:5 000 cadastral maps (Turker and Arikan, 2005) and modified for this study. After the final modification, a total of 4689 agricultural fields are provided in the Gauss-Kruger (Zone 5) projection and European datum 1950 (ED 50). The vector data include crop information, which is collected by field work performed concurrently with the image acquisitions.
2. ANALYSES
The methodology is composed of four main parts; pansharpening, image segmentation, image classification (training site selection, probability estimation), and evaluation of the results. Detailed explanations of the analyses are provided below:
2.1 Preprocessing
To provide detailed information to the image segmentation, Kompsat-2 PAN (1 m) and MS (4 m) data are pan sharpened.
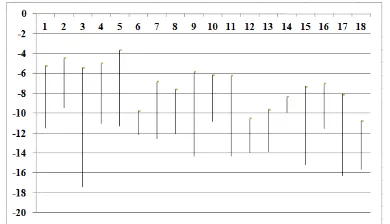
To do that nine different image fusion algorithms frequently used in the literature are compared using multiple statistical indicators: relative mean difference, relative variation difference, correlation, peak signal to noise ratio, universal image quality index, and ERGAS (erreur relative globale adimensionnelle desynthèse). According to the statistical tests, the LSF method provides the best performance and is therefore used for the fusion task of the PAN and MS Kompsat-2 images. Three-dates of optical images are atmospherically corrected prior to the analysis using ATCOR-2 module of PCI Geomatica (Richter, 1990). To remove the speckle effect, Envisat ASAR data is de-speckled using Lee filtering method with 5x5 window size. In a next step, the radar backscattering coefficients are produced for each Envisat ASAR data to facilitate absolute comparisons of the temporal changes of the backscatter behaviour (Eq.1) (Liu et al., 2006). Figure 2 indicates the computed backscattering change of the six crop types for the multi-temporal Envisat ASAR data taken in June, July, and August.
(1) Where;
DNi,j is the digital number of the (i, j) pixel,∝i,j is the angle of the (i, j) pixel and K is the calibration constant.
Figure 2. Backscatter changes of the crops; 1. Corn, 2. Tomato, 3. Rice, 4. Sugar beet, 5. Wheat, 6. Grass land (28 June), 7. Corn, 8 Tomato, 9. Rice, 10. Sugar beet, 11. Wheat, 12. Grass land (18 July), 13. Corn, 14. Tomato, 15. Rice, 16. Sugar beet, 17. Wheat, 18. Grass land (3 August).
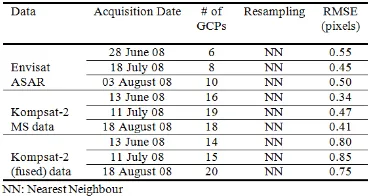
In a next step, an orthorectification is performed on the images to remove the relief distortion and to provide high geometric quality for the image analyses. A Digital Elevation Model (DEM) is produced through the use of contour maps. A method of “Satellite Orbital Modeling” is employed for the entire Kompsat-2 and Envisat ASAR dataset with at least 6 and 14 evenly distributed GCPs selected from the Envisat and Kompsat-2 datasets, respectively. All the Root Mean Square Error (RMSE) values of the geometric model are computed to be less than the size of one pixel. The number of GCPs used, RMSE values, and the method used for the resampling are given in Table 1.
Table 1. The number of GCPs used, resampling method and the RMSE values computed for each image
2.2 Image Segmentation
An established procedure for pattern recognition, Mean-Shift, is employed to segment homogenous agricultural patches in this study. The reasons of using the Mean-Shift are described as; (i) the Mean-Shift algorithm does not require any assumption about the data distribution and the shape of the clusters, which facilitates handling of the complex objects in a real feature space, (ii) it is a simple, iterative, mode-seeking procedure that smoothes the images prior to the clustering process while preserving and sharpening their discontinuities, (iii) it can be applied not only to grey images but also to colour images according to their joint-spatial range domain, which makes it possible to benefit from more information to the segmentation process, (iv) only a few parameters are required to apply the Mean-Shift procedure, and (v) open source, easy available, and a user friendly software (EDISON) is available for this purpose (Comaniciu and Meer, 2002). The Mean-Shift procedure is based on kernel density estimation, which applies an iterative shifting procedure to data values to compute a new centre of mass. More detailed explanation of the Mean-Shift can be found in (Comaniciu and Meer, 1997, 2002).
The pansharpened (1m) Kompsat-2 images (June, July, August) are segmented to detect homogenous agricultural patches. In total, 324 combinations of the three parameters; spatial (hs), range (hr) domains and minimum regions (MR) are tested on {3,4,5,………,20} x {3,4,5,,………,20} x {1000}, respectively. The MR parameter is defined as 1000 pixels based on the total number of pixels that belongs to the smallest agricultural field in the study area. According to the analyses, three band combinations, green, red, and NIR, provide the optimum segmentation result. Hence, the three image channels are employed in the segmentation analyses.
To evaluate the segments and define the optimum parameter combination, the segmentation results are evaluated in a wide perspective via multiple goodness measures. During the assessment process, two types of measures, (i) area-based and (ii) location-based, are utilised (Clinton et al., 2012). All the measures are used to compute both area and the location similarities between the segments and well-defined agricultural fields that are selected manually from the reference agricultural parcels.
A subset of a representative 10% from all the fields, operator-delineated agricultural fields, are selected from the ground truth to compute the accuracies of the segments by open source software called Alpha v 0.1 (URL). Then, the optimum parameters of the segments are determined by ranking the results in terms of one or more of the goodness measures, followed by an optimisation process. Evaluations indicate that the optimum parameter combinations of the pansharpened Kompsat-2 image taken in July are computed as hs=12, hr =3, respectively (Figure 3). Two post-processing operations, (i)
buffering and (ii) line simplification, are then applied to the optimum segments to generate more representative objects.
(a) (b)
(c) (d)
Figure 3. Segmentation results of a small part of pansharpened Kompsat-2 image (taken in July) with the parameters of (a) hs = 2, hr= 2, MR = 50, (b) hs = 2, hr = 2, MR=1000, (c) hs = 6, hr = 3, MR=1000, and (d) hs = 5, hr = 10, MR=1000 respectively.
2.3 Image Classification
MS Kompsat-2 images and Envisat ASAR data are classified using a popular supervised classification method, Support Vector Machines (SVMs) through the pixel-based and segment-based approaches. The method employs a structural risk minimisation concept to reduce the probability of misclassification of the data by defining an optimum hyper plane (e.g., a decision surface), which maximises the margin between the classes (Vapnik, 1995; Vapnik, 1998). Pixels closest to the hyper plane are defined as support vectors. Two parameters, the penalty parameter (C) and the gamma function (γ), and one kernel type must be defined when applying the classification. The penalty parameter (C) controls the degree of misclassification, and the gamma function (γ) defines the gamma term in the kernel function used in the classification (Tso and Mather, 2009). According to the several research studies, the Radial Basis Function (RBF) kernel, which provided better classification accuracy, is used in this study (e.g. Yang, 2011; Kavzoglu and Colkesen, 2010; Pal and Mather, 2005), is utilized. Table 2 indicates the parameters employed during the SVMs classification of the raster data.
Table 2. Gamma functions (γ) and penalty parameters (C) used for the SVMs classification of the MS Kompsat-2 images and the thematic maps of the MS Kompsat-2 and Envisat ASAR data
However, in the case of agricultural applications, the pixel-based classification methods may cause problems within the fields due, for example, to the variations in soil moisture conditions, nutrient limitations or pests and diseases. The other
problem may be due to the mixed pixels that are located at the boundary of two or more land cover types. These factors may cause to assign a combination of the reflectance from two or more land cover types, which cause misclassification (Smith and Fuller, 2001). Therefore, an object-based approach is applied to the classified data set, where the classified image is overlaid with the optimum segments and each pixel is assigned to a final class of the entire object according to the statistical properties (mode value are employed in this study), instead of determining the class label for each pixel separately. When performing the image classifications, the training samples are automatically selected from a subset of object-based results to eliminate the possible bias that may occur during the selection of the training samples. To do that, first, the optimum result is overlaid with each band (blue, green, red, and NIR) of each single-date MS Kompsat-2 dataset and the average values of the standard deviations of the objects are computed for each band of each image to find out the best representative regions from all available objects. Then, a threshold is set and the objects that have standard deviations smaller than 2 are extracted as training samples and automatically labelled with the help of reference information. Inthis way, a representative 10% of all the pixels are automatically selected as training samples for each image. The training samples defined are used to classify the single-date optical MS images (MS Kompsat-2), first (Figure 4a). In a subsequent step, the corresponding Envisat ASAR data are included as additional band in the classifications (Figure 4b).
A probabilistic approach is employed to combine the thematic information of the optical and microwave images. This approach is based on a hard classification strategy in which the probabilityvalues are first computed for the pixels of each date, and the maximum membership value is assigned as a class label to the pixels. In this way, the thematic information of different images (June-July, June-August, July-August, June-July-August) is combined as a single map in pixel-based manner. In terms of the object-based approach, the procedure is performed as follows: (i) the probability maps are generated for each single-date image in pixel-based manner, (ii) maximum membership values are computed and assigned to a new raster map, (iii) the probability maps are integrated with the optimum object-based result, and (iv) the mode values are computed and assigned to the objects as class labels. Besides the pixel-based and object-based analyses, the thematic maps generated with the pixel-based approach were overlaid with the reference agricultural fields and the results were evaluated in a field-based manner, as well. In the field-based analyses, frequency of the pixels classified with SVMs is computed and the mode of the class id is assigned as label to the original fields.
(a)
(b)
Figure 4. (a) The object-based SVMs result and (b) the probability map of the combined optical and microwave images taken in June, July, and August
2.4 Accuracy Assessment
The reliability of the produced thematic maps is depicted by a commonly used accuracy assessment method, confusion matrix. First, the reference data are prepared by updating the database of the existing vector data (agricultural field boundaries) with the fieldwork that is performed concurrently with the image acquisitions. Three visits are performed to the test site and crop information such as canopy development, irrigation, and fertilisation activities are recorded into a database.
To provide a reliable evaluation, the training pixels are excluded from the reference data during the computations. The thematic maps produced with pixel-based and object-based approaches are evaluated in pixel-based manner with 567 sample points scattered over the reference fields by a simple random sampling strategy, where the sample points are distributed in the reference fields based on the class percentages. Analyses provided overall accuracy, kappa result, and individual class accuracies of each thematic map.
3. DISCUSSION
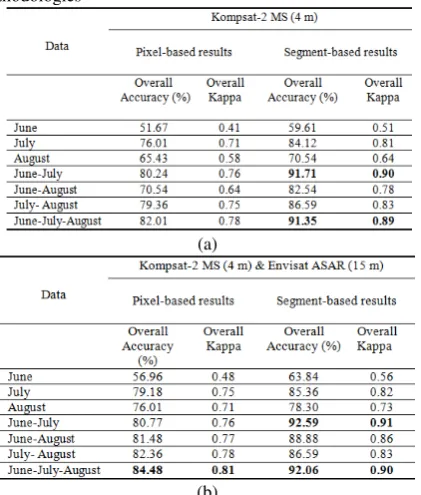
Table 3 summarizes the overall accuracies of the pixel-based and object-based classifications of the single- and multi-season Kompsat-2 images and the Kompsat-2 images along with the Envisat ASAR data. Results indicate that the poorest accuracies are obtained for the single-date image taken in June. This is due to the fact that the crops are almost in the first planting period in June and bare soil may affect the spectral response characteristics of the crops and poor classification accuracies are obtained. Kompsat-2 image taken in June provides 51.67% overall accuracy. This rate is improved around 8% and 5% for the segment-based approach and the inclusion of Envisat ASAR data to the classification, respectively. The highest improvement of June image is observed as 63.83% for the segment-based the Kompsat-2 and Envisat ASAR data. The best improvement of the August image is observed of about 13% when the segment-based method is applied to the classification of Kompsat-2 and Envisat ASAR data. Results of the combined thematic maps indicate that the combined maps of June-July
and June-July-August provide promising overall accuracies over 80% for the pixel-based classification of the Kompsat-2 image. Similar to the previous results, a certain improvement is observed when the segment-based approach is applied and the Envisat ASAR data is added. A significant improvement of about 10% is observed for the segment-based result of the Kompsat-2 image for dual (June-July) and triple (June-July-August) map combinations. This improvement increase of about 2% and is computed around 92% when the Envisat ASAR data is included in the classification. The kappa results of those images are computed around 90%, which means an outstanding classification performance for the crop types.
The highest pixel-based accuracy (≈85%) is improved around 8% and computed of approximately 92% when the optical and microwave images are classified with object-based approach. Confusion matrix of the combined thematic map of June and July indicates that a quite good classification performance with the producer’s accuracies over 85%. The maximum producer’s accuracy of about 99% is achieved for the grass land, in which only 1 pixel of 94 are omitted as tomato. Promising results (97.89%) were achieved for the user’s accuracy of the grass land, as well. The best user’s accuracy is found out for the class wheat around 99%, in which of the 93 pixels 92 were correctly classified as wheat. The rice class is the other class that has high classification accuracies. The producer’s and user’s accuracies of the rice are computed to be 97.36% and 94.87%, accuracy is computed around 83% for tomato, which is mainly confused with sugar beet due to the spectral overlaps.
Table 3. SVMs results computed for different image combinations based on pixel-based and segment-based methodologies
(a)
(b)
Similar accuracies (92.45% overall, 0.90 kappa) are obtained when the classification is performed with field-based. All the crop types provided high producer’s accuracies over 85%. The highest producer’s accuracy was computed for the class rice
with the minimum omission error. All the reference pixels of sugar beet are correctly classified (100%). The smallest user’s accuracy of 57.14% is observed for the class tomato although producer’s accuracy of tomato is relatively high (88.88%). The major confusion was observed as 5 pixels between tomato and sugar beet due to the similar spectral response pattern.
4. CONCLUSION
This study proposes a multi-temporal, object-based approach to classify the major crop types cultivated in Karacabey Plain, Turkey with MS Kompsat-2 and Envisat ASAR data. Analyses indicate that the multi-temporal classification strategy and selection of the optimum growing dates is significant to provide reliable maps in agricultural studies. The probabilistic approach is an effective way at combining the information of multitemporal images. Results indicate that the object-based approach is more effective than the pixel-based approach because it addresses the problem of misclassification due to the within-field spectral variability. The highest results (~ 92%) are obtained for the segment-based method of the combined thematic maps of June-July and June-July-August, classified with the optical and microwave data, which is approximately 10% better than the corresponding pixel-based results. Except for the dual image combination of July-August, the classification accuracies are improved in some extent for all the image combinations when the C-band Envisat ASAR data are included in the classification framework, which indicates the advantage of the usage multi-sensor data. More detailed satellite images (e.g. Geoeye and Worldview-2) or aerial photographs can be a good alternative to detect more precise agricultural patches in object-based analysis.
Evaluation of the object-based classification results is still a challenging task. This is because the produced objects generally do not represent actual parcels on the ground. Thus, the evaluation of the produced segments is performed in a wide perspective with multiple goodness measures to produce representative maps in this study.
In summary, the proposed approach is crucial to provide reliable crop maps to the users and the final product is helpful in facilitating management plans for cultivation and irrigation practices in agricultural lands.
ACKNOWLEDGEMENTS (OPTIONAL)
The Kompsat-2 data have been provided by a project called DAP-2008-07-02-07 funded by Geodetic and Geographic Information Technologies (GGIT) Department in Middle East Technical University (METU) in Turkey. The Envisat ASAR data have been supplied by a Category-1 ESA project (Project No: 4825).
REFERENCES
Asar Product Handbook. (2009). Available from at:http://envisat.esa.int/handbooks/asar (accessed 15 November 2009).
Clinton N., Holt A., Scarborough, J., Yan, L.I., Gong, P., 2012. Accuracy assessment measures for object-based image segmentation goodness. Photogrammetric Engineering and Remote Sensing. 76, pp. 289–299.
Comaniciu, D., Meer P., 1997. Robust analysis of feature spaces: color image segmentation. In: IEEE Conference on
Computer Vision and Pattern Recognition; San Juan; Puerto Rico. pp. 750–75; (Jun. 1997).
Comaniciu, D., Meer, P., 2002. Mean shift: a robust approach toward feature space analysis. IEEE Transactions on Pattern Analysis and Machine Intelligence, 24, pp. 603–619.
Kavzoglu, T., and Colkesen, I., 2010, Destek vector makineleri ile uydu görüntülerinin sınıflandırılmasında kernel fonsiyonlarının etkilerinin incelenmesi (Investigation of the effects of kernel functions in satellite image classification using support vector machines), Harita Dergisi, 144, pp. 73-82.
Liu, L., Wang, J., Bao, Y., Huang, W., Ma, Z., and Zhao, C. , 2006. Predicting winter wheat condition, grain yield and protein content using multi-temporal Envisat-ASAR and Landsat TM satellite images. International Journal of Remote Sensing, 27, pp. 737-753.
Pal, M., and Mather P.M., 2005. Support vector machines for classification in remote sensing. International Journal of
Remote Sensing, 26, pp.1007-1011.
Richter, R. 1990. A fast atmospheric correction algorithm applied to LANDSAT TM images. International Journal of
Remote Sensing, 11, pp.159-166.
Smith, G.M., and Fuller, R.M., 2001. An integrated approach to land cover classification: an example in the Island of Jersey.
International Journal of Remote Sensing, 22, pp.3123–3142.
Spot Image 2008. http://www.spot.com/web/SICORP/2378-kompsat-2-images.php.
Tso, B., and Mather, P.M., 2009. Classification Methods for
Remotely Sensed Data, Taylor & Francis Group, LLC, USA.
Turker, M., and Arikan, M., 2005. Sequential masking classification of multi-temporal Landsat7 ETM+ images for field-based crop mapping in Karacabey. Turkey. International
Journal of Remote Sensing, 26, pp.3813–3830.
URL.http://nature.berkeley.edu/~nclinton/goodness0_1alpha.zi p
Vapnik, V., 1995, The Nature of Statistical Learning Theory.
Springer-Verlag, New York.
Vapnik, V., 1998. Statistical Learning Theory. Springer-John Wiley, New York.
Yang, X., 2011. Parameterizing support vector machines for land cover classification. Photogrammetric Engineering &
Remote Sensing, 77, pp.27-37.