RETROSPECTIVE ANALYSIS OF RECENT FLOOD EVENTS WITH
PERSISTENT HIGH SURFACE RUNOFF FROM HYDROLOGICAL MODELLING
S. Joshi a *, K. Abdul Hakeem b, P. V. Raju c, V. V. Rao d, A. Yadav e, P. G Diwakar f, V. K. Dadhwal g
National Remote Sensing Centre, 500037 Hyderabad, India a
saksham_joshi b abdulhakeem_k c raju_pv d vvrao e anil_y f pgdiwakar g director @nrsc.gov.in
Commission VIII, WG VIII/4
KEY WORDS: Hydrology, Modelling, Floods, Disaster, Early Warning System, VIC
ABSTRACT:
Floods are one of the most common and widespread disasters in India, with an estimated 40Mha of land prone to this natural disaster (National Flood Commission, India). Significant loss of property, infrastructure, livestock, public utilities resulting in large economic losses due to floods are recurrent every year in many parts of India. Flood forecasting and early warning is widely recognized and adopted as non-structural measure to lower the damages caused by the flood events. Estimating the rainfall excess that results into excessive river flow is preliminary effort in riverine flood estimation. Flood forecasting models are in general, are event based and do not fully account for successive and persistent excessive surface runoff conditions. Successive high rainfall events result in saturated soil moisture conditions, favourable for high surface runoff conditions.
The present study is to explore the usefulness of hydrological model derived surface runoff, running on continuous times -step, to relate to the occurrence of flood inundation due to persistent and successive high surface runoff conditions. Variable Infiltration Capacity (VIC), a macro-scale hydrological model, was used to simulate daily runoff at systematic grid level incorporating daily meteorological data and land cover data. VIC is a physically based, semi-distributed macroscale hydrological model that represents surface and subsurface hydrologic process on spatially distributed grid cell. It explicitly represents sub-grid heterogeneity in land cover classes, taking their phenological changes into account. In this study, the model was setup for entire India using geo-spatial data available from multiple sources (NRSC, NBSS&LUP, NOAA, and IMD) and was calibrated with river discharge data from CWC at selected river basins. Using the grid-wise surface runoff estimates from the model, an algorithm was developed through a set of thresholds of successive high runoff values in order to identify grids/locations with probable flooding conditions. These thresholds were refined through iterative process by comparing with satellite data derived flood maps of 2013 and 2014 monsoon season over India.
India encountered many cyclonic flood events during Oct-Dec 2013, among which Phailin, Lehar, and Madi were rated to be very severe cyclonic storm. The path and intensity of these cyclonic events was very well captured by the model and areas were marked with persistent coverage of high runoff risk/flooded area. These thresholds were used to monitor floods in Jammu Kashmir duri ng 4-5 Sep and Odisha during 8-9 Aug, 2014. The analysis indicated the need to vary the thresholds across space considering the terrain and geographical conditions. With respect to this a sub-basin wise study was made based on terrain characteristics (slope, elevation) using Aster DEM. It was found that basins with higher elevation represent higher thresholds as compared to basins with lesser elevation. The results show very promising correlation with the satellite derived flood maps.
Further refinement and optimization of thresholds, varying them spatially accounting for topographic/terrain conditions, would lead to estimation of high runoff/flood risk areas for both riverine and drainage congested areas. Use of weather forecast data (NCMWRF, (GEFS/R)), etc. would enhance the scope to develop early warning systems.
* Corresponding author
Introduction
Floods in the Mahanadi and Godavari basins during 2013 caused by cyclone Phailin, Lehar, and Madi, have led to increased interest in research and development of flood forecasting systems. Key information to this includes meteorological observation, rainfall estimates from weather radar and satellites as well as hydrological model for rainfall-runoff and resulting flood estimation.
India being a vast country, the problem due to floods is visualized on regional basis. Drainage congestion due to urbanization, inundation and soil/silt erosion are the main problems in India with respect to floods. More than 40Mha area is identified as flood prone area (National Flood Commission, India). Seasonal floods are experienced by large number of rivers in India. Central and northern parts of India are experiencing frequent floods during south-west monsoon season due to which a large number of people are suffering with a heavy loss on agriculture sector, and valuable property etc. To minimize losses due to floods, various measures to control floods are adopted. It can be strategically planned either by taking structural measures or non-structural measures. Structural measures encompass multiple reservoirs which can store flood water, flood carrying capacity through channel development, whereas in Non-structural measures, flood decision support, flood forecasting and to provide early warning information in near-real time to decision makers. These measures are widely recognized to lower the damages caused by the flood events.
Flood occurs due to natural as well as man-made causes. Artificial modifications of the environment including urbanization, irrigation structure, construction of dams/reservoir and flow regulation occurs on a large scale that significantly affect seasonal and annual hydrologic variations. In the view of these prospective developments, it is thus becomes necessary to understand and quantify various hydrological/land parameter components for water resource management.
The severity and intensity of the flood, depends upon the duration & magnitude of rainfall and land/surface characteristics of watershed. For example, shorter duration heavy rainfall in hilly terrain will result into flash floods, whereas the heavy rainfall of longer period in a large catchment may not lead to inundation. Runoff rates often exceeds due to the rapid response of watershed to intense rainfall, populated by infiltration rate and soil hydraulic properties. Thus in order to monitor such events, an algorithm was developed through a set of thresholds of successive high runoff values in order to identify grids/locations with probable flooding conditions for entire India. This study has been taken up using macro-scale process based hydrological model as Variable Infiltration Capacity (VIC). It is developed by university of Washington and Princeton in 1994 (Liang X., 1994). The goal of this study is to estimate water balance components with a specific represent runoff generation in excess of underlying physics such as infiltration, exfiltration, and lateral distribution of soil moisture.
Data and Methodology
Earth Observation (EO) data from multitude platforms are providing wide ranging datasets that are useful for creation of spatially distributed parameters appropriate for hydrological modeling. For the present study, meteorological forcing datasets were created using observational data sets from both in-situ measurements and remote sensing data from various satellite sensors. The daily temperature data was prepared from hourly data acquired from IMD AWS stations for entire India. High resolution satellite based daily rainfall data for southern Asia domain (70°-110° E, 5°-35° N) from NOAA Climate Prediction
Center (NOAA/CPC) are used.
(http://cpc.ncep.noaa.gov/products/fews/SASIA/rfe.shtml).
VIC Land Surface Model
The Variable Infiltration Capacity (VIC), a semi distributed & physically based hydrological model that solves both the water balance and the energy balance. VIC is an open source research model, its various forms has been applied to many watersheds including the Fraser River, Columbia River, the Ohio River, the Arkansas-Red Rivers, and the Upper Mississippi Rivers. The VIC model has been applied for climate change studies in cold mountainous (Schnorbus M.A et al., 2009).
The study of the water balance in hydrology is the application of the principle of conservation of mass, often referred to as the continuity equation. This states that, for any arbitrary volume and during any period of time, the difference between total input and output will be balanced by the change of water storage within the volume. The water balance equation may be written as follows
P – Q – ET- ΔS –ΔG = 0 (1)
Where, P is precipitation (mm), Q is stream flow/Runoff (mm), ET is evapotranspiration (mm), ΔS is change in soil moisture (mm),
ΔG is the change in ground water storage (mm).
VIC is capable of partitioning incoming (solar and long wave) radiation at the land surface into latent and sensible heat, and the partitioning of precipitation (or snowmelt) into direct runoff and infiltration. It utilizes a soil–vegetation–atmosphere transfer scheme that accounts for the influence of vegetation and soil moisture on land–atmosphere interactions. The model handles the subsurface into multiple soil layers. Each layer characterizes soil hydrological response such as bulk density, infiltration capacity, saturated hydraulic conductivity, soil layer depths, and soil moisture diffusion parameters. VIC explicitly represents sub-grid heterogeneity in land cover classes taking their phenological changes into account such as their leaf area index (LAI), albedo, canopy resistance, and relative fraction of roots in each of the soil layers. Roots can extend to deepest layer depending on vegetation and soil type. Bare soil (no vegetation cover) is also simulated by the model. The evapotranspiration from each land cover type is simulated using vegetation-class specific potential evapotranspiration, canopy resistance, aerodynamic resistance to the transport water, and architectural resistance coefficients defined in Penman-Monteith equation. In this model, the ET includes evaporation from the canopy layer of each vegetation class, transpiration from each vegetation class, and evaporation from bare soil. Total evapotranspiration ET over each grid cell is calculated as the area weighted sum of these three components. VIC uses the infiltration mechanism The International Archives of the Photogrammetry, Remote Sensing and Spatial Information Sciences, Volume XL-8, 2014
used in Xinanjang model (Zhao, 1992) to generate runoff from precipitation in excess of available infiltration capacity and base flow is computed using Arno model conceptualization (Todini, 1996). It requires the definition of its input and parameters for each grid, which are provided by four major input files: Soil parameter file, Vegetation parameter file, Vegetation library file and Meteorological forcing file. The data sets used for the preparation of these input files are Land use land cover (LULC-NRC-250k), NBSSLUP (1:50,000) scale soil map of India. The model is driven by forcing parameters such as precipitation, maximum minimum temperature, and wind speed at daily or sub-daily time step, as an input for the full energy and water balance.
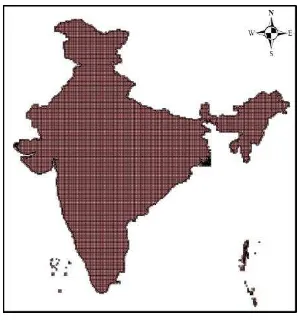
9’ X 9’ (~16.5km) grid level (total - 13709) modelling frame work has been setup for the entire county using geo-spatial data sets and historic meteorological data (figure 1). Current season daily meteorological data (Maximum & Minimum Temperature) from IMD-AWS with satellite derived rainfall measurement of CPC/TRMM were used to compute hydrological fluxes at daily time-step. Model computes evapotranspiration, surface runoff, soil moisture, base flow and energy fluxes at the predefined grid resolution (few km to hundred km).
Figure 1 9’ X 9’ grids for India
A river routing module when coupled with VIC daily surface runoff, permits comparisons between the model-derived discharge hydrograph and field observations at gauging stations. Input files for routing module such as flow direction and flow fraction were prepared using 30mts Aster DEM. Routing module is a linear transfer function model characterized by its internal impulse response function which is used to calculate the within-cell routing. Assuming all runoff exits a cell in a single flow direction, a channel routing based on the linearized Saint-Venant equation is used to simulate the discharge at the basin outlet gauge site. The routing model is described in detail by Lohmann et al. (1996, 1998a).
Basin wise model is calibrated for the water years between 1976 and 1985 and validation conducted for the water years between 1986 and 2005 using the observed stream flow data of CWC at the selected basin outlet. Calibration of a hydrological model is an iterative process which involves changing the values of model parameters to obtain best fit between the observed and simulated values. Nash-Sutcliffe efficiency (NSE), performance measuring criteria was considered for calibration purposes. The values of performance of the model for the daily stream flow simulation based on performance measuring criteria is tabulated
for calibration periods in Table 1, which satisfy the
5 Subarnarekha Ghatsila 0.68
Table 1 Model Performances
Methodology
A knowledge based algorithm was developed to mark areas with persistent high runoff conditions which may lead to riverine flood and inundation of low lying pockets/drainage congested areas. runoff value for a particular day which can lead to a flood, the corresponding grid i is considered to be the probable flooded
grid .
(4)
Refining further to high alert grid from probable flooded grid, by considering scoring value for continues next two days. If the criteria is satisfied the grid point i is marked to be cyclonic events was very well captured by the model and areas were marked with persistent coverage of high runoff risk/flooded area.
The developed algorithm was applied to the model derived surface runoff for the year 2013, which led to the understanding of varying thresholds across space. Various observation and modification were adopted which are discussed in next section.
Results and Discussion
The developed algorithm was implemented for the year 2013 and 2014 high rainfall events. The persistent high runoff areas were represented well across the country. Some results including floods in Srinagar, Meghalaya, Gujarat and Odisha are shown in figure.3. & figure.4. The results shows very promising correlation with the satellite derived flood maps. This effort is continued to monitor flood with three days lead time using NOAA Global Ensemble Forecast System (GEFS/R) data, which provides weather forecast for next 8 days (3hr/6hr
time-step) at 0.5deg resolution
(ftp://ftp.cdc.noaa.gov/Projects/Reforecast2). A first-hand look at the probable flooding condition for the entire India shows a considerable deviation from the satellite derived pattern of the inundated areas. This clarifies that same threshold is not adequate to mark areas with persistent coverage of high runoff risk/flooded area for entire India. This indicates the need to vary the thresholds across space considering the terrain and geographical conditions. With respect to this a sub-basin wise study was made based on terrain characteristics (slope, elevation) using Aster digital elevation model (DEM).
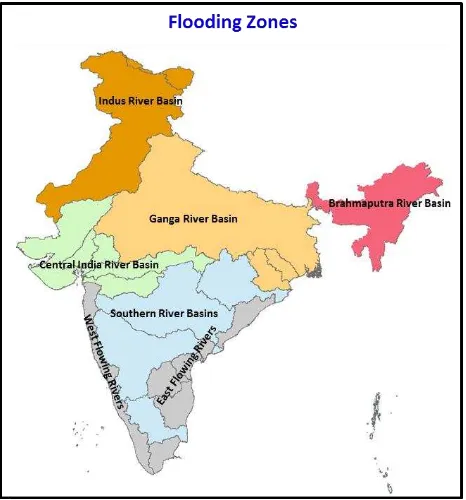
As discussed earlier, the problem depends on the river system topography and flow phenomenon. Being a vast country, the India may be broadly classified into five zones of flooding, viz. (a) Indus River Basin, (b) Ganga River Basin, (c) Brahmaputra River Basin, (d) Central India River Basins, (e) Southern River Basins of India (figure 2). Mahananda constitute the second zone. It covers Uttaranchal, Uttar Pradesh, Bihar, south and central parts of West Bengal, parts of Haryana, Himachal Pradesh, Rajasthan, Madhya Pradesh and Delhi. The normal annual rainfall of this region varies from about 60 cm to 190 cm. The third zone belongs to the basins of the rivers Brahmaputra and Barak with their tributaries. It receives large amount of rainfall as a result floods takes place very often. Mahi, Sabarmati, Narmada, and Tapi together form Central India River Basin, whereas Godavari, Mahanadi, Krishna, and Cauvery falls into Southern River Basins of India with flat average bed slope. These rivers have well defined course.
Using ESRI-GIS technology, minimum, maximum, mean elevation and slope were calculated for these flooding zones. Thresholds were revised iteratively, till it represents spatial variation in flooding in different zones. It was found that zone
with higher mean elevation (steeper slope) represent higher thresholds as compared to zone with lesser mean elevation (Table 2).
Table 2 Thresholds with respect to different flooding zones in India
Conclusion
Hydrological models, when run on continuous time step, permit estimation of persistent and high surface runoff conditions, resulting from successive high rainfall events. These high surface runoff areas, depending on the terrain/geographical conditions, translate into riverine flood/drainage congestion flood. The present paper describes the results of the retrospective analysis of 2013-2014 flood events across India with the persistent, successive high runoff estimates from VIC Hydrological modelling framework. Model derived persistent, high surface runoff conditions are related to the occurrence of flood inundation as captured by satellite observations, through a set of runoff thresholds. The results show promising correlation with the satellite derived flood inundation. Further refinement and optimization of thresholds, varying them spatially accounting for topographic/terrain conditions, would lead to estimation of flood risk areas for both riverine and drainage congested areas. Use of weather forecast data (NCMWRF, GEFS/R), etc. would enhance the scope to develop early warning systems.
REFERENCES
‘Hydrology and Water Resources Information System for India’, National Institute of Hydrology, Roorkee, accessed on 26 November 2013, <http://www.nih.ernet.in/rbis/rbis.htm>.
‘Variable Infiltration Capacity (VIC) Macroscale Hydrologic Model’, University of Washington, accessed on 13 June 2013, <http://www.hydro.washington.edu/Lettenmaier/Models/VIC/O verview/Model Overview.html >.
Cohen J (1988), ‘Statistical power analysis for behavioural sciences (II edition.)’ Hillsdale, NJ: Eribaum.
Dadhwal VK, SP Aggarwal, Nidhi Mishra (2010), ‘Hydrological Simulation of Mahanadi River Basin and Impact of land use / land cover change on surface runoff using a macro scale hydrological model’ - ISPRS Archives– Volume XXXVIII - Part 7B, ISPRS Technical Commission VII Symposium.
Hurkmans, R. T. W. L., De Moel, H., Aerts, J. C. J. H., and Troch, P. A. (2008). ‘Water balance versus land surface model in the simulation of Rhine river discharges’. Water Resources Research, 44(1).
Jha, M. K. (2011). ‘Evaluating hydrologic response of an agricultural watershed for watershed analyses. Water, 3(2), 604-617.
Lettenmaier D.P (2001), ‘Macroscale Hydrology: Challenges and Opportunities’ Present and Future of Modeling Global Environmental Change: Toward Integrated Modeling, pp. 111– 136.
Liang, X., Lettenmaier, D. P., Wood, E. F. and Burges, S. J., (1994), ‘A simple hydrologically based model of land surface water and energy fluxes for general circulation models’, J. Geophys. Res., 99, 14415–14428.
Lohmann, D., et al. (1996), A large scale horizontal routing model to be coupled to land surface parameterization schemes, Tellus (48A), 708-721.
Lohmann, D., E. Raschke, B. Nijssen, and D. P. Lettenmaier (1998a), Regional scale hydrology, Part II: Application of the VIC-2L model to the Weser River, Germany, Hydrol. Sci. J., 43(1), 143–158.
Lohmann, D., et al. (1998b), The Project for Intercomparison of Land-Surface Parameterization Schemes (PILPS) Phase-2(c) Red-Arkansas River Basin Experiment: 3. Spatial and temporal analysis of water fluxes, J. Global Planet. Change, 19, 161–179.
Mishra, V., Cherkauer, K. A., and Bowling, L. C. (2010). Parameterization of Lakes and Wetlands for Energy and Water Balance Studies in the Great Lakes Region. Journal of Hydrometeorology, 11(5).
Meng, L., and Quiring, S. M. (2008). A Comparison of Soil Moisture Models Using Soil Climate Analysis Network Observations. Journal of Hydrometeorology, 9(4).
Monod, H., Naud, C., and Makowski, D. (2006). Uncertainty and sensitivity analysis for crop models. D. WALLACH, D. MAKOWSKI et J. JONES, éditeurs: Working with Dynamic Crop Models, 55-100.
Moriasi, D. N., Arnold, J. G., Van Liew, M. W., Bingner, R. L., Harmel, R. D., and Veith, T. L. 2007.Model evaluation guidelines for systematic quantification of accuracy in watershed simulations. Trans. ASABE, 50(3), 885-900.
Roy C. Ward, Robinson Mark (2000), ‘Principles of Hydrology’ McGraw-Hill 2000.
Saltelli, A., Chan, K., & Scott, E. M. (Eds.). (2000). Sensitivity analysis (Vol. 134). New York: Wiley.
Santhosh Kumar P, (2013), ‘Macro scale hydrological modeling in a snow clad basin’, M.E. thesis, Centre for Water Resources, Anna University.
Schnorbus, M. A., Bennett, K. E., and Werner, A. T. (2009, May). Quantifying the hydrologic impacts of mountain pine beetle and salvage harvest in the Fraser River Basin, British Columbia, Canada. In AGU Spring Meeting Abstracts (Vol. 1, p. 23).
Suoquan Zhou, Xu Liang, Jing Chen and Peng Gong (2004), ‘An Assessment of the VIC- 3L Hydrological Model for the Baohe River Basin on RS’, Can. J. Remote Sensing, Vol. 30,
No. 5, pp. 840–
853<http://www.hydro.washington.edu/Lettenmaier/Models/VI C/Overview/ Model Overview.html >.
Ven Te Chow, David R. Maidment and Larry W. Mays (1988), ‘Applied Hydrology’, pp 3-4.
Xie, Z., Yuan, F., Duan, Q., Zheng, J., Liang, M., and Chen, F. (2007). Regional Parameter Estimation of the VIC Land Surface Model: Methodology and Application to River Basins in China. Journal of Hydrometeorology, 8(3).
Zhao, RJ., Zhuang, Y.L., Fang, L.R., Liu, X.R. and Zhang, Q.S., (1980). The Xinanjiang model. In: Hydrological Forecasting, Proceedings of the Oxford Symposium, April 1980. IAHS Publ. No. 129.