A NON-CONVENTIONAL PROCEDURE FOR THE 3D MODELING OF WWI FORTS
E. Nocerino a,b, F. Fiorillo c, S. Minto a, F. Menna a, F. Remondino a
a 3D Optical Metrology (3DOM) unit, Bruno Kessler Foundation (FBK), Trento, Italy
<nocerino><minto><fmenna><remondino>@fbk.eu, http://3dom.fbk.eu b
Dept. of Sciences and Technologies, Parthenope University of Naples, Italy c Department of Civil Engineering, University of Salerno, Italy - [email protected]
Commission V – WG4
KEY WORDS: CAD, Modeling, Cultural Heritage, Rectification, Digitisation, Visualization, Photogrammetry, Laser Scanning
ABSTRACT
2014 is the hundredth anniversary of the outbreak of the First World War (WWI) - or Great War - in Europe and a number of initiatives have been planned to commemorate the tragic event. Until 1918, the Italian Trentino – Alto Adige region was under the Austro – Hungarian Empire and represented one of the most crucial and bloody war front between the Austrian and Italian territories. The region borders were constellated of military fortresses, theatre of battles between the two opposite troops. Unfortunately, most of these military buildings are now ruined and their architectures can be hardly appreciated. The paper presents the initial results of the VAST project (VAlorizzazione Storia e Territorio – Valorization of History and Landscape), that aims to digitally reconstruct the forts located on the plateaus of Luserna, Lavarone and Folgaria. An integrated methodology has been adopted to collect and employ all possible source of information in order to derive precise and photo-realistic 3D digital representations of WWI forts.
a) b) c)
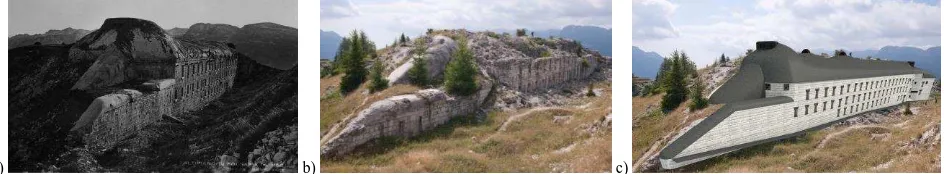
Figure 1: The Dosso delle Somme fort (Serrada werk) located at 1670 m a.s.l. and constructed between 1910 and 1914. It spans ca 110 m and could host ca 160 persons. A historical image (a – Centro Documentazione Luserna), its actual state of conservation (b) and a digital 3D reconstruction (c).
1. INTRODUCTION
The deterioration and degradation of archeological heritage, due to atmospheric agents, historical events, human negligence and/or intervention, often do not allow correct historical interpretation and reconstruction of remains and ruins. In such cases, the support of bibliographic and historical information integrated with modern data is essential to, first of all, understand the heritage and, then, make reconstruction hypotheses. In this context, digital 3D reconstruction and visualization techniques play a key role, allowing new and interesting approaches for preservation, restoration, promotion and dissemination. Following these aims, in the last years, a number of projects and applications have been presented: computer-aided 3D reconstructions (Agnello & Prescia, 2013) and creations of realistic textured-model (Guidi et al., 2013); virtual anastylosis and reconstructions (Kurdy et al., 2011; Canciani et al., 2013); digital hypothetic reconstruction and AR applications (Landrieu et al., 2011); multimedia museum applications (Rubino, 2013); smartphone applications for multimedia animation and navigation (Vizcaíno León et al., 2013); physical reproductions and replicas (van Gasteren, 2013).
This contribution presents the results of the documentation and valorization of heritage sites and monuments of the WWI period located in the Trento’s Province (North East of Italy). The project, called VAST (VAlorizzazione Storia e Territorio – Valorization of History and Landscape, http://vast.fbk.eu/) is a multidisciplinary work, realized in cooperation with archeologists, local authorities and museums. Historical and current heterogeneous 2D and 3D data (maps, LiDAR, photos, orthoimages, text documents, etc.) have been integrated and processed in order to produce documents and materials to enrich the current heritage contents of the local museums but also to realize advanced studies, such as multi-temporal analysis of territorial and environmental changes, hypothesis verification of historical events, etc. The area of interest includes primarily the plateaus and highlands - in Italian known as “Altopiani” - of Luserna, Lavarone and Folgaria that were severely involved and affected by the hostilities of the Great War. In that area, the military forts are nowadays ruins, hardly accessible and appreciable. Therefore an integrated methodology, based on the combination of 3D modeling methods, from both reality (photogrammetry, laser scanning, surveying) and computer aided architectural design (CAAD) methods, have been adopted for their virtual reconstruction and visualization (Fig. 1). The International Archives of the Photogrammetry, Remote Sensing and Spatial Information Sciences, Volume XL-5, 2014
a) b)
c)
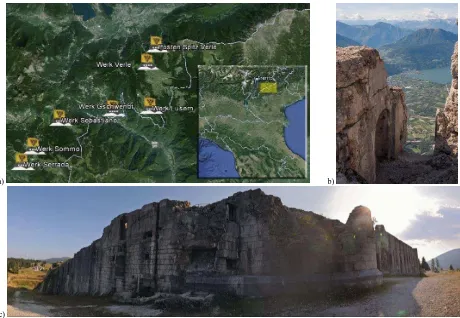
Figure 2. Positions of the Austro-Hungarian forts along the old national border (before 1918) between Italy and the Austro–Hungarian empire - nowadays a regional border between Trentino – Alto Adige and Veneto (a). View of the Valsugana valley from the Vezzena fort, also known as
Posten Spitz Verle (b). Photo stitching of Cherle fort or werk Sebastiano (c).
Figure 3. Check between existing situation (orthographic view of photogrammetric point cloud) and historical paper drawing (1915, Archivio Storico di Trento) of Serrada werk. The digitized windows in the orthophoto do not match with those in the drawing.
Figure 4. Two different design drawings (1909 and 1914, Archivio Storico di Trento) of Sommo Alto fort (werk Sommo). The International Archives of the Photogrammetry, Remote Sensing and Spatial Information Sciences, Volume XL-5, 2014
2. THE VAST PROJECT AND THE AUSTRO-HUNGARIAN FORTIFICATIONS
The VAST project is part of a series of initiatives promoted by local authorities aiming at the commemoration of the outbreak of the First World War. Until 1918 the Trentino – Alto Adige region was under the Austro-Hungarian Empire and constituted the “hot” border with Italy. It was a fundamental strategic area, which was disseminated of military fortifications (Fig. 2a). The principal aim of VAST project is to document and valorize, using modern and innovative communication technologies integrated with historical material, military architectures that were the scene and witnesses of the bloody events of WWI.
2.1 The fortification system in the Trentino – Alto Adige region
For its natural configuration, with the Adige valley running through the entire region, the Trentino - Alto Adige has always been a natural and accessible communication route between Italy and Central Europe. As such, since the Rethi and Romans, through the Middle Ages, fortifications, castles and road defenses had been realized throughout the territory. A deep change in defense and military architecture had been made from the nineteenth century by the Austro-Hungarian Empire. Indeed, after the annexation of Lombardia and Veneto respectively to Savoy Kingdom, before, and Italy, after, the Trentino – Alto Adige became the last Austrian region wedged in the Italian territory and, consequently, a largely fortified area. More than 50 Austro-Hungarian forts (werk in German) were designed to form a double set of fortifications that comprised an external ring along the boundaries of the region and an inner ring around the city of Trento (Cacciaguerra & Gatti, 2010). From 1833 until 1914, four generations (and six different construction phases) can be identified (http://www.trentinograndeguerra.it/):
- the fortifications of the 1st generation (first three phases) were situated at the entrance of the valleys, as a natural bottlenecks and block of the main routes.
- the 2nd generation (beginning of 1880) features fortifications at higher altitude, characterized by a simple planning scheme known as “Trentino style”.
- the fortifications of the 3rd generation, called “Vogl era”, were built to complete the defense belt of the eastern Trentino front and consist of armored forts, fitted with reinforced domes and shields for the artillery in the casemate.
- the 4th generation (1904-1914), promoted by the Austro-Hungarian general Conrad von Hötzendorf, led to the construction of concrete and steel fortresses located on the plateau and on the top of mountains.
The fortresses realized on the plateaus of Luserna, Lavarone and Folgaria belong to the 4th generation (Fig. 2a): they were built in concrete together with hand-carved local stone and were positioned on the top of hills and mountains (Fig. 2b, c, d), to monitor the national boundary and block the advance of Italian military troops. Each forts, with casemate, rotating domes, corridors and underground passageways to smaller reinforced blocks, were often realized with their main body completely carved in the rock in order to be camouflaged and so that only the façade was visible from outside.
3. THE INTEGRATED PROCEDURE FOR MODELING WWI FORTS
war activities as well as because during the fascism period the iron parts of the military buildings (mainly the beams) were removed to be reused. Therefore the forts appear essentially as ruins and do not show the complex engineering work behind their realization. The most effective (and also less expensive) way to bring back the original beauty and grandeur of these military buildings is to realize 3D digital models that can show the original shape of the forts to the widest possible public. When original design drawings are available (as it is the case for many of the Austro-Hungarian forts in Trentino), two are the main modeling procedures that can be adopted for producing digital models of existing buildings: (i) reality-based techniques (photogrammetry, laser scanning, topographic surveying) and (ii) computer aided architectural design (CAAD) methods (Lewis et al., 1998; El-Hakim et al., 2007). For the VAST project, none of the two procedures could singularly produce satisfactory and complete results. Indeed, a pure reality-based approach would provide incomplete results, being the forts currently very bad maintained. On the other hand, a fully CAAD modeling process would be inaccurate as in some cases the realized constructions differ from the original design drawings (Fig. 3) and for some fortresses multiple design projects are available (Fig. 4). Furthermore, for not all WWI forts in the region, complete construction plans are available. Therefore to obtain complete 3D digital models, the integration with information derived from real metric data is necessary. Starting from these considerations, the integrated methodology for the digital reconstruction of WWI military architectures located on the Trentino plateaus consists of:
- Field surveying (terrestrial photogrammetry and laser scanning) to acquire accurate measurements (Section 3.1); - Digitization of historical drawings (Section 3.2) as base for
the modeling workflow (Section 3.3);
- Derivation of missing information (construction materials, shape of coverage, etc.) from additional material (historical photos, books, etc.);
- Integration of the produced 3D model into the digital surface model for visualization purposes (Section 3.4).
3.1 Reality-based surveying of the forts
Photogrammetric, laser scanning and topographic surveys were realized mainly to (i) obtain some reference measurements (e.g. height and length of the main façade, number and position of the windows, etc.) of the analyzed Austro-Hungarian forts, 9ii) choose the design drawing finally realized, (iii) check the correctness of the historical drawings used in the following phases, (iv) integrate missing design and geometric information and (v) geo-locate the monuments. The survey operations were usually concentrated only on the external and visible part of the structures in order to derive metric results and orthos (Fig. 5).
3.2 Drawing’s rectification procedure
In order to digitize and rectify the design drawings, a non-conventional procedure was followed. This was necessary as the old drawings are not properly preserved and present some deformations and deteriorations. Furthermore, due to regulations of local national archives, historical drawings cannot be scanned with a conventional flatbed or drum scanner but only with a digital camera in order to avoid additional stress and wear of the paper. This requires that a more complex mathematical model instead of the conventional affine transformation is necessary for the rectification procedure in The International Archives of the Photogrammetry, Remote Sensing and Spatial Information Sciences, Volume XL-5, 2014
a) b)
c)
d)
e)
f)
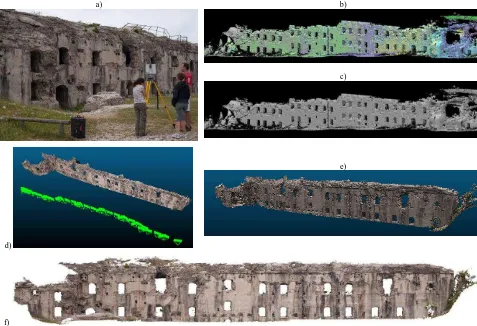
Figure 5. Laser scanning and photogrammetric acquisitions: the surveying operations (a); the aligned laser scans (b) and the resulted mesh (c) of werk Verle; the photogrammetric image network (d), the derived dense point cloud (e) and the produced orthophoto of the fort façade (f) of werk Sommo.
For each available historical drawing, a close-range photogrammetric survey was thus realized in order to produce orthoimages of the drawings. A typical photogrammetric network (Fig. 6a) acquired with a calibrated SLR camera is processed with a standard fully automatic procedure through the following steps: tie point extraction, network orientation, dens point cloud and mesh creation (Fig. 6b), texturing (Fig. 6c) and orthophoto generation (Fig. 7). To check the accuracy of the proposed methodology for orthoimage production, several analyses and comparisons were performed. Traditional rectification methods, both analytical and geometrical, were used to rectify the image depicting the historical drawing and acquired from the most perpendicular position (i.e. the red pyramid in Fig. 6a). Since the camera had been previously calibrated, the image was undistorted in order to correct for lens distortion. In this way, it was possible to apply straightforward conventional rectification procedures. Both analytical methods, based on affine and polynomial transformations, and geometric rectification, applying perspective geometric rules, were used. The rectification algorithms use standard least squares adjustment to compute the transformation parameters applied to the whole drawing. In all experiments, control points and reference measurements were derived from reference grid (red lines in Fig. 7) based on the actual measurements shown in the paper drawing. Both number and position of reference points
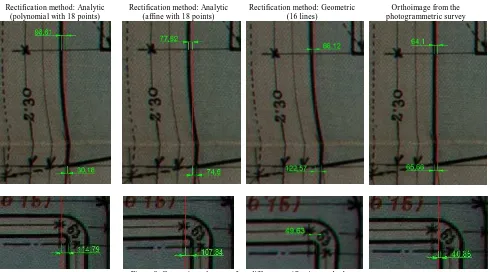
and measurements were selected in order to minimize and uniformly distribute residuals over the whole rectified image. Figure 8 shows the comparison between the four different rectification methods. The distances between the reference grid (Fig. 7) and the corresponding points taken on the rectified images are reported in mm at the given map scale (1:100). Table 1 summarizes the differences for 13 points uniformly distributed on a rectified historical drawing. The results show that the proposed photogrammetric-based methodology is generally comparable with the classical procedure but with the advantage of being fully automated and objective. Nevertheless, in our experiences we observed that in case of strongly deformed historical drawings all rectification methods display differences greater than the plotting accuracy.
Rectification method Mean difference [mm@1:100]
Max difference [mm@1:100]
Polynomial 55.45 185.54
Affine 100.03 387.06
Geometric 63.93 122.57
Orthoimage 53.88 119.32
Table 1: Mean and maximum differences (in mm @ map scale) between reference grid and corresponding points taken on the rectified images.
a) b) c)
Figure 6. Example of a typical photogrammetric network realized for digitizing historical drawings and produce orthos (a). Obtained mesh model of the historical drawing without (b) and with (c) texture. The orthoimage is produced using the camera most nadir / perpendicular to the historical
drawing (red cone in the left image).
Figure 7. Example of the rectified historic drawing (i.e. photogrammetric orthoimage) of werk Sommo with overlaid a reference grid.
Rectification method: Analytic (polynomial with 18 points)
Rectification method: Analytic (affine with 18 points)
Rectification method: Geometric (16 lines)
Orthoimage from the photogrammetric survey
Figure 8: Comparisons between four different rectification methods.
3.3 CAAD modeling
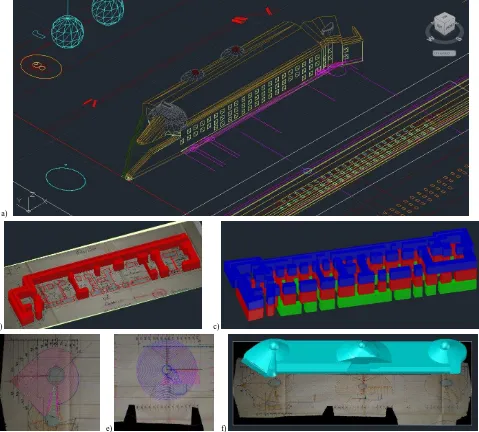
The orthoimages of the construction drawings (plans, sections and/or façade prospects) produced with the photogrammetric-based method formed the base for the successive modeling procedure. Manual digitization and extrusion functions were applied to produce a digital model of the military forts (Fig. 9a).
plans and determine the height and position of the floors (Fig. 9b-c). Similarly, 3D solids of domes and coverage were created starting from 2D curves and lines derived from the available design drawings (Fig. 9d-e). The geometric 3D models were then refined with a texture mapping procedure. Virtual textures were generated according to information collected through bibliographic research, existing restored forts of the same period The International Archives of the Photogrammetry, Remote Sensing and Spatial Information Sciences, Volume XL-5, 2014
a)
b) c)
d) e) f)
Figure 9. CAAD-based 3D modeling of werk Serrada and werk Sommo (a). Extrusion of planar blocks from rectified plans (b) and spatial position of multiple extruded floors (c). 2D curves and lines derived from the available design drawings of domes and coverage (d, e) and obtained 3D solid model
(f).
a) b)
Figure 10. Two examples showing possible texture information: Forte Belvedere (werk Gschwent) in its actual situation (a, http://www.fortebelvedere.org/en) and a historic image of werk Sommo (b, http://it.wikipedia.org/wiki/Forte_Sommo_Alto). The International Archives of the Photogrammetry, Remote Sensing and Spatial Information Sciences, Volume XL-5, 2014
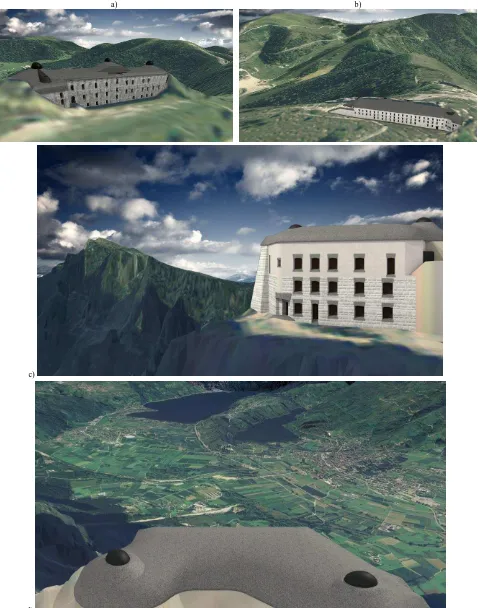
3.4 Integration of 3D models into a digital landscape
In order to obtain faithful and realistic visualization of the forts’ digital models, the surrounding environment was also modeled. Orthophoto and LiDAR data over the region of interest were used and the 3D CAAD models realized through the procedure previously described were integrated in the terrain model (Figure 11). The geo-location of the 3D models was obtained during the field surveying (Section 3.1).
4. CONCLUSIONS AND FUTURE APPLICATIONS
The paper presented some results of VAST, an on-going interdisciplinary project aiming at celebrating the centenary of the beginning of the Great War in the Trentino – Alto Adige region. At that time, the region was under the Austro – Hungarian empire and represented the border with Italy where more than 50 military buildings were realized between 1833 and 1914. An integrated 3D modeling methodology was adopted to digitally reconstruct the nowadays ruined forts located on the Trentino’s plateaus: (i) terrestrial photogrammetry and laser scanning techniques were employed to acquire accurate measurements on the real buildings; (ii) historical construction plans were digitized and used as base for a CAAD modeling workflow; (iii) further information (construction materials, shape of coverage, etc.) were recovered from additional material (historical photos, books, etc.).
The core of the presented work is the digitization procedure of the historical paper drawings: a standard close-range photogrammetric survey was realized to obtain orthophotos of each single paper sheet. The benefit of the proposed procedure is that it works even in absence of reference measurements visible on the drawings necessary for applying standard analytical methods of correction of digital images. Moreover, traditional rectification methods require a massive user interaction that can strongly compromise the quality of the rectification procedure. On the other hand, the orthophoto generation is completely automated (in this work the only manual intervention was required to scale the photogrammetric projects) and hence free from human errors. The unique weakness of the method is that the accuracy of the correction by means of ortho-rectification, obviously, depends on how much the original paper is creased.
An ad-hoc algorithm is now under development to correct the mesh derived with photogrammetry and obtain an unwrinkled digital model of the paper drawing.
The project will digitally model other forts in the plateau area and will insert all the achieve results and information into a webGIS accessible for consultation, analyses and valorization of the history and the local territory.
ACKNOWLEDGEMENTS
The VAST project is funded by Fondazione Cassa di Risparmio di Trento e Rovereto – CARITRO. The authors are really thankful to all the partners (Centro Documentazione Luserna, Istituto Cimbro Luserna, Centro Internazionale Studi di Archeologia di Superficie, Fondazione Forte Belvedere) involved in the VAST project (http://vast.fbk.eu/) as well as Archivio Storico di Trento and the Azienda per il Turismo a Folgaria, Lavarone e Luserna for their fundamental contribution and valuable support in the bibliographic and
REFERENCES
Agnello, F., Prescia, R., 2013. Integrated studies for the enhancement of complex historic monuments. Proc. Joint Built Heritage Workshop “Monitoring Conservation Management”, Milano, Italy.
Cacciaguerra, G., Gatti, M. P., 2010. The modernity exhibited by the building technologies adopted for nineteenth century Trentine fortresses. Proc. IAHS World Congress on Housing 2010, Santander, pp. 1-9.
Canciani, M., Falcolini, C., Buonfiglio, M., Pergola, S., Saccone, M., Mammì, B., Romito G., 2013. A method for virtual anastylosis: the case of the arch of Titus at the Circus Maximus in Rome. ISPRS Annals of the Photogrammetry, Remote Sensing and Spatial Information Sciences, Vol. 2(5/W1), pp. 61-66. XXIV International CIPA Symposium, Strasbourg, France.
El-Hakim, S., Gonzo, L. Voltolini, F., Girardi, S., Rizzi, A., Remondino, F., Whiting, E., 2007: Detailed 3D modelling of castles. International Journal of Architectural Computing, Vol.5(2), pp. 199-220.
Guidi, G., Russo, M., Angheleddu, D., 2013. Digital reconstruction of an archaeological site based on the integration of 3D data and historical sources. Int. Archives of the Photogrammetry, Remote Sensing and Spatial Information Sciences, Vol. 40(5/W1), pp. 99-105, Trento, Italy. Kurdy, M., Biscop, J-L., De Luca, L., Florenzano M., 2011. 3D virtual anastylosis and reconstruction of several buildings in the site of Saint-Simeon, Syria. Int. Archives of the Photogrammetry, Remote Sensing and Spatial Information Sciences, Vol. 38(5/W16), pp. 45-52, Trento, Italy.
Landrieu, J., Pere, C., Rollier, J., Catandet, s., Schotte, G., 2011. Digital rebirth of the greatest church of cluny maior ecclesia: from optronic surveys to real time use of the digital model. Int. Archives of the Photogrammetry, Remote Sensing and Spatial Information Sciences, Vol. 38-5/W16, pp. 31-37, Trento, Italy.
Lewis, R., Sequin, C., 1998. Generation of 3D building models from 2D architectural plans. Computer-Aided Design, Vol. 30(10), pp. 765– 779. Cristo “El Amarrado” de Gregorio Fernández a base de Tecnologías 3D. Virtual Archaeology Review, Vol. 4(8), pp. 33-36.
Vizcaíno León, D., Bravo Hinojo, E., Serrano A., Iribas, D., 2013. Un modelo de aplicación multimedia de Turismo Cultural para Smartphone: “Els iBers dels Ports”. Una ruta de yacimientos ibéricos en la comarca de Els Ports. Virtual Archaeology Review, Vol. 4(8), pp. 28-32.
a) b)
c)
d)
Figure 11. Integration of 3D textured model in its digital landscape: werk Sommo (a), werk Serrada (b) and Posten Spitz Verle (c) with a view from the fort on the Valsugana valley (d) – see also Fig. 2b.