CROP HEIGHT DETERMINATION WITH UAS POINT CLOUDS
G.J. Grenzdörffer a
a
Rostock University, Chair for Geodesy and Geoinformatics, J.-v.-Liebig Weg 6, Rostock, Germany, [email protected]
Commission I, ICWG I/Vb
KEY WORDS: UAS-Photogrammetry, 3D-Point Cloud, Crop Surface Models
ABSTRACT: The accurate determination of the height of agricultural crops helps to predict yield, biomass etc. These relationships are of great importance not only for crop production but also in grassland management, because the available biomass and food quality are valuable information. However there is no cost efficient and automatic system for the determination of the crop height available. 3D-point clouds generated from high resolution UAS imagery offer a new alternative. Two different approaches for crop height determination are presented. The "difference method" were the canopy height is determined by taking the difference between a current UAS-surface model and an existing digital terrain model (DTM) is the most suited and most accurate method. In situ measurements, vegetation indices and yield observations correlate well with the determined UAS crop heights.
1. INTRODUCTION
Accurate determination of the crops height is in many respects of great importance. For example, the development of the plant height of maize is a very good indicator of the coming crop yields (Yin et al., 2011). Similar, though less significant relationships have been observed for several winter crops, e.g. Girma et al., 2006. Basically, there are statistically very close relationship between the plant height and biomass, for example, Ehlert et al., 2009, Zhang and Grift, 2012. These relationships are of great importance not only for crop production but also in grassland management, because the available biomass and food quality are valuable information.
For vehicles (tractors) various technologies for crop height measurements have been tested, either stand alone or in combination, e.g. ultra sonic, radar rangefinder, stereo camera systems, laser scanners and light curtains, see Busemeyer et al., 2013. Regardless of the sensors used, there are high demands to be fulfilled for tractor-based technologies. Thus, the canopy height should be determined with an accuracy of about 1 cm and at best regardless of external conditions, i.e. dust, vibration, and sun. Ehlert et al., 2009 have generally shown that laser scanners are able to meet these requirements. However, tractor-based systems are bound to the tramlines to measure the plant height. This means the measurement are accurate, but the areal coverage is quite limited.
1.1Photogrammetric height determination of vegetation surfaces
The determination of a surface model using photogrammetric methods has been improved dramatically in recent years. Several developments from the field of computer vision enable an automatic orientation of almost any kind of imagery. Using so-called "Dense matching" methods a coordinate triplet may be computed for virtually every pixel of an aerial photographs, e.g. Haala, 2013. The height accuracy is related to several issues and the theoretical limit is generally around one pixel.
The absolute accuracy of the 3D point cloud is dependent on the number of images and the sectional geometry and the accuracy of the exterior and interior orientation. Using commercially available digital cameras the achievable accuracy is usually between 0.5 - 2 pixels. This means at a flying height of 50 - 100
m and the use of wide-angle lenses theoretical accuracies of 6 - 50 mm are achievable. It should be noted however, that the necessary ground control points are usually measured with RTK GNSS, with accuracies generally ranging from 10 - 25 mm. Therefore, the practically achievable absolute height accuracies of UAS-image flights are often at 15 - 30 mm.
In the case of surface vegetation two special issues have to be considered:
1. As mentioned above, the objects of interest (vegetation surface) should not move during the aerial survey for successful matching or highly accurate position determination. That cannot be guaranteed for agricultural crops. Especially with mature grain, even a little wind is enough to cause problems.
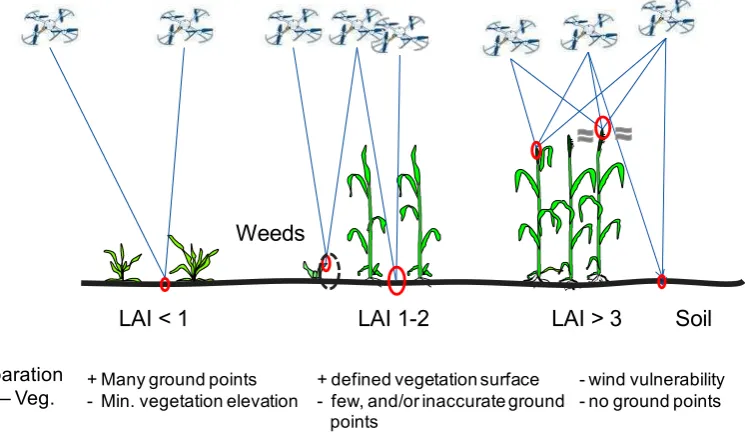
2. At coarser image resolution the vegetation surface appears relatively homogeneous, because within a single pixel parts of one or more plants and their shadows merges into one signal (canopy level). At a ground resolution of a few cm, the single plant as well as the shadows casted by them and the soil surface in between the crops are resolved (leaf level). Thus, in theory it may be possible to separate the soil surface and the canopy signal in the 3D point cloud. However, this may work only if the canopy is not too dense, and the leaf area index is low. Nevertheless, the geometric properties of the ground points are bad and error-prone, see figure 1.
2. METHODS AND MATERIALS
In the paper, two different approaches of crop height determination will be presented:
1. (Difference Method) Determination of canopy height by taking the difference between a current UAS-surface model and an existing digital terrain model (DTM) that, e.g., was obtained by a parallel tracking system or an initial UAS-flight campaign. The advantage of this method is that the reference surface is always the same and the height measurement of the canopy surface is accurate and reliable throughout the entire growing season. However, a prerequisite of this method is the availability of a high accuracy reference DTM.
2. (3D-point cloud method) Determination of canopy height by statistical analysis of the 3D-point cloud. The 3D-point cloud method, which is presented and analyzed in this work, was designed specifically for evaluating mono temporal UAS-surveys. The particular difficulty is to determine the plant height of the plants, even without a DTM. Due to the high ground resolution of the UAS images the point cloud contains not only the vegetation surface, but also partly the ground between the plants. Thru a classification in soil and vegetation points, a DTM and a DOM is derived from the point cloud. These are then used in the same way as in the difference method to determine the basis for the plant height of the crops. Classification methods to separate point clouds in "ground" and "vegetation" points were developed for airborne LiDAR data sets. For UAS point clouds, which are generally much denser, the parameter settings need to be adjusted. It should be noted that this method is not an approach to determine heights or growth of individual plants. Rather, the most accurate possible area-based measure of the canopy height is desired. Therefore the terms "ground point" and "vegetation point" are used. In a narrower sense, the amount of individual plants is not calculated, but all points representing the canopy and the soil surface. Alternatively, certain percentiles of height values from the 3D-point cloud shall define the ground and the canopy surfaces. For the ground surface the 5% percentile is often appropriate, while the 95% for the canopy surface model - or the 99% percentile can be calculated. The advantages of this statistical approach are, it is quite simple and single tall plants do not determine the height of a grid cell. This method was successfully tested on natural grasslands for which no or only a very rough DTM was present, see Grenzdörffer and Bogdanov, 2013.
3. TEST AREA AND UAS-SURVEYS
The UAS test flights were conducted at the field trials University of Rostock, Germany. On the field trials different agricultural crops with a variety of plant cultivation experiments can be found. In order to investigate the possibilities and accuracies of the point cloud method and the applications of crop height information several agricultural crops and experiments were covered with during each flight, especially:
a winter wheat test plot with a potassium-enrichment trial, as well as a sulfur trial took place,
an oilseed rape trial area as part of a crop rotation experiment,
an alfalfa and grass test plot, as part of a field crop experiment, and
a maize trial field with several cultivars.
For the investigations four UAS image surveys (epochs) were conducted in the course of the growing season in 2013. The four flights with the UAS took place at: 03 May, 24 May, 02 July and 22 August. Since the area of interest was flown directly after harvest (epoch 4), a DTM of the terrain surface could be created, thus allowing for plant height calculation with the difference method and serving as a reference for the point cloud method. The results thus obtained are used to compare them with those of the 3D point cloud method.
For the UAS-surveys of the experimental plots the Quadrocopter MD4-1000 from Microdrones GmbH was used. As a camera the Olympus PEN E-P2 was used with a fixed focal length of 17 mm. The image resolution of the camera is 4032 × 3024 pixels. All UAS flights followed the same flight plan. A summary of the flights are presented in table 1.
Table 1. Georeferencing information of UAS-flights
Epoch 1* 2 3 4 Avg.
Flight height (m) 51.61 53.55 51.79 53.82 52.69
GSD (cm) 1.29 1.35 1.33 1.35 1.32 Cam Proj.-Error (m) 2.890 3.266 2.375 noData 2.844 GCP Z-Error (m) 0.035 0.007 0.004 0.003 0.012 GCP Total Error (m) 0.048 0.01 0.009 0.026 0.023 GCP Pixel-Error (pix) 1.54 0.48 0.52 0.3 0.71 DOM Resolution
(m/pix)
0.056 0.077 0.085 0.026 0.061
* only natural ground control points
In each case, approx. 300 images were recorded over a distance of about 1.6 km. The flight time was about 10 minutes. For the surveys an endlap 80% and a sidelap of 60% was chosen. One flight covered about 3.8 ha.
Figure 1. Possibilities and problems of UAS based photogrammetry for the derivation of crop surface models
LAI < 1
Weeds
LAI 1-2
- wind vulnerability - no ground points
Soil
LAI > 3
Separation
Soil–Veg. + Many ground points- Min. vegetation elevation
+ defined vegetation surface - few, and/or inaccurate ground
points
18 control points were laid out and measured with a Leica GX1230 RTK-GPS receiver for geo-referencing. The processing of the data and the calculation of point clouds was carried out with the software Photo Scan from Agisoft. The residuals at the control points were between 1-2 cm in position and 1-5 cm in height, Zacharias, 2013. The accuracies achieved are in line with similar projects, e.g. Bendig et al., 2013.
4. ACCURACY OF CROP HEIGHT MEASURMENTS
The achievable accuracy of the UAS based crop height is related to several factors. In general three different sources of errors can be identified, which will be discussed in the following:
1. Errors related to UAS and UAS survey
2. Errors related to data processing
3. Errors related to crop phenology
Errors related to the layout of the UAS survey, the camera, the interior and exterior orientation are discussed widely in the photogrammetric literature, e.g. Grenzdörffer and Bill, 2013.
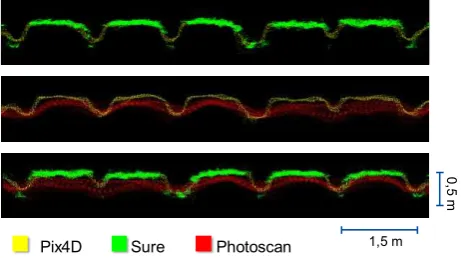
Errors related to the subsequent data processing are more difficult to quantify. E.g. Haala, 2013 demonstrated that the software and the underlying algorithms for the determination of the 3D-point cloud play a major role in terms of accuracy and completeness. For instance the software Agisoft Photo Scan only uses single images pairs for point cloud calculation, while the software SURE for instance uses the redundancy of all overlapping images and in addition also determines the accuracy of the 3D point determination, Wenzel et al., 2013. As a result, the inner accuracy and the reliability of the height determination increases. But it is not only the matching algorithms but also the amount of smoothing etc., which influences the final results, as figure 2 demonstrates.
Figure 2. Comparison of 3D-point clouds of a winter wheat plot derived with different software packages
Using the difference method, the digital terrain model (DTM) resembling the ground surface should be made directly after sowing, as the terrain height of the seed bed hardly changes over the upcoming vegetation period. If the DGM created for example before or after ploughing, associated irregularities are also included in the DTM. This means subsequent height measurements are inaccurate. This source of error can be minimized by a "smoothing" in the form of an interpolation of the DTM. The accuracy of the reference DTM is of course not better than the crop surface model. Therefore the accuracy of the crop height model is realistically speaking, between 3 - 6 cm, assuming an accurate UAS survey and data processing.
Errors related to the crop phenology are unique to the determination of crop surface models.
During the course of the vegetation period crop development is not a continuous phenomenon, but it follows a number of crop development stages. Crop height can be determined best if the canopy surface is homogeneous and dense. If the canopy structure is either sparse and / or peaks mark the highest points of the individual plants crop height determination with UAS will deliver lower heights than manual reference measurements, figure 5. Figures 3a and 3b illustrate the differences with examples from winter wheat and corn.
Figure 3a. Smooth winter wheat canopy surface
Figure 3b. Sparky corn canopy surface
In early development stages of the crops height is also difficult to determine, because the vegetation cover is low and the individual crops are small and normally do not form a closed canopy. Depending on the crop the minimum determinable vegetation height is between 5 - 15 cm.
As the crop density and the appearance of the crops from the birds perspective changes during the vegetation period, crop height can be determined with different levels of accuracy. The following figures shall illustrate this phenomenon for different crops.
5. 3D POINT CLOUD METHOD
The classification of the point cloud in ground and vegetation points proves to be very difficult, since it is influenced by many factors. As expected, the crop height and the vegetation coverage play a prominent role. This unfortunately means that individual adjustments are necessary for every UAS survey and every crop. For example, the winter wheat plots in the first epoch were still much too small for a successful classification of the point cloud. The point cloud of the third epoch in turn contains virtually no ground points, except those on the paths between the plots and at the edges of the field experiment, figure 4. However, under experimental conditions, a classification between ground and vegetation points yields reasonable results to derive the reference DTM.
Figure 4. Cross section of a point cloud of a winter wheat experimental plot. Classified ground points are brown and vegetation point are shown in green.
Zacharias, 2013 conducted several more or less successful experiments and he comes to the conclusion that the point cloud method is difficult to apply for agricultural crops, because there is only a very short window of opportunity at which the crops are just at the right development stage, with the right height and the right amount of vegetation coverage. Compared to the difference method the point cloud method results in less reliable and lower crop heights, figure 5.
Pix4D Sure Photoscan
0
,5
m
1,5 m
Figure 5. Results of fodder experiment in the second epoch. Orthophoto (left), difference method (center) and 3D point cloud method (right).
6. LEAF LEVEL VS. CANOPY LEVEL
The high ground resolution of the UAS images allows for imaging of the plants at the leaf level, i.e. individual plants or leaves can be identified. In contrast, remote sensing usually uses coarser resolution data, which represent a mixed signal from vegetation, soil and shade. This spectral signal at the canopy level is significantly different from that of the leaf level. To investigate this behavior and to determine the appropriate or necessary ground resolution to make a reference to the canopy height, the VARI-data were calculated in different ground resolutions namely at 0.05 m, 0.1 m, 0.25 m and 0.5 m. The mean values are calculated for an area of 1 m² and then compared with each other. As seen in figure 7 the coarsening of the VARI index leads to a significant decorrelation.
Figure 6. Correlation of vegetation index VARI computed from 5 cm and 10 cm GSD
Figure 7. Correlation of vegetation index VARI computed from 5 cm and 50 cm GSD
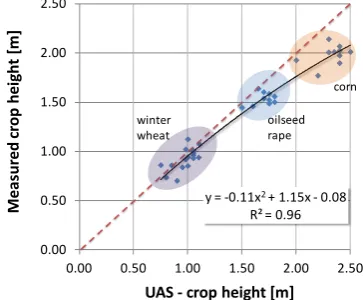
37 crop height measurements were carried out in the field during a UAS survey in July for different crops (winter wheat, oilseed rape and corn) which differ significantly in height. Crop height was determined as the highest point of the crop. The locations of the field measurements were measured with a handheld GPS and transferred into the GIS. In the GIS each point is represented by a 4 m² area. This was necessary because the measurement points were measured with a certain positional uncertainty. UAS crop height was computed with different DEM resolutions, namely at 0.05 m, 0.1 m, 0.25 m and 0.5 m. The UAS crop height is generally lower than the measured values in the field, figure 8. This is especially true for corn were the significant crop height without the inflorescence is detected from the UAS images.
Using the maximum UAS-crop heights within the 4 m² provides values closer to the reference values than the average values of the crop heights, figure 8. The difference is most visible for corn, were single inflorescences were detected as 3D-points. Due to the averaging effect the UAS crop height model with
7. CROP HEIGHT - A VALUABLE PARAMETER FOR
CROP MANAGEMENT
As mentioned in the introduction crop height is an interesting parameter to describe the crop development, to determine yield, biomass etc. In the following paragraphs crop height, derived with the difference method from three epochs in 2013 a winter y = 0.975x + 0.003
wheat test plot with a potassium-enrichment trial, as well as a sulfur trial will be related to other information from the image data as well as observations from the crops. Therefore 80 random plots of 1 m² were selected. Statistics (min, max, mean etc.) of the plots were computed.
Vegetation indices often rely on the reflection differences between the red and near infrared. The Visible Atmospherically Resistant Index (VARI) however relies only on the spectral bands in the visible spectrum and is highly correlated to the vegetation fraction ( crop density, biomass).
blue measurements of winter wheat and corn in the USA. The index has not previously been applied with airborne remotely sensed data. On aerial images, the VARI is rather sensitive toward colour deviations. The most typical colour deviations are caused by atmospheric haze, which increases data values especially in the blue channel due to Rayleigh scattering. This has to be taken into account during the radiometric preprocessing procedures, in which a colour balancing of the three RGB-channels is undertaken. Another specific issue with high-resolution UAS are tramlines and shade, which may cause over illumination on to the neighbouring pixels. The tramline effect becomes less problematical during the vegetation period, because the crops in the centre and the border of the tramline cover more and more of the tramline. The VARI index was also computed from the images with a GSD of 0.05 m. Yield data of the experiments are available for the different plots.
The spring development of winter wheat was delayed in 2013 due to the very long winter. This led to still quite small (height approx 10 - 20 cm) wheat plants in early May for the first epoch. The leaf area index (LAI) is correspondingly low (0.3 - 0.7). Due to the sparse growth of the individual plants height measurements with the point cloud method and the difference method was unfortunately impossible, or not significant, since the measured heights were only a few cm. Thus a correlation between the crop height and the crop vitality does not yield significant correlation, figure 10.
Figure 10. Correlation between vegetation index VARI and crop height for winter wheat trial, measured 3. May 2013
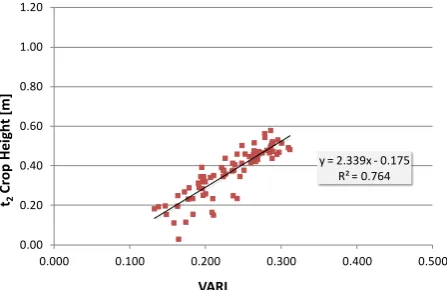
Crop growth in the second period (end of May) was in full swing and the plant height could be determined reliably. The plant vigor, which can be represented on the VARI vegetation index is closely correlated with the size and growth of the crop. This is not surprising, because vital plants are often greater than less vital, diseased plants, see figure. 11.
Figure 11. Correlation between vegetation index VARI and crop height for winter wheat trial, measured 24. May 2013
In the third epoch (beginning of July), the correlation between the vigor and plant height is very low, see figure 12. Why ? Because the expectation is a similar correlation as observed in the second period.
Figure 12. Correlation between vegetation index VARI and crop height for winter wheat trial, measured 2. July 2013
The reason can be seen in the special fertilization experiments in which the influence of potassium and sulfur fertilization should be tested for yield and plant development in general. Potassium and sulfur deficiency symptoms show up only at the end of the growing season and become visible to the human eye. Large and high plants get the potassium deficiency first to feel, because the existing fertilizer is used up first. For smaller plants the existing fertilizer still be sufficient not to show any deficiency symptoms. Potassium deficiency results in advanced stages of development for desiccation or necrosis symptoms at the top wheat leaves. Sulfur deficiency manifests itself in a similar manner. The leaves are beginning to brighten. In most cases, the youngest leaves are affected. The older leaves with sufficient nitrogen supply the sulfur is fixed in protein chains. Using remote sensing this is particularly unfortunate, as the very youngest leaves are observed from above.
However, the growth trend of epoch 2 is maintained in epoch 3. Thereby large plants are still large plants and small plants have not evolved to average sized plants, as the figure 13 clarifies. y = 0.217x + 0.035
Figure 13. Correlation of winter wheat crop height between epoch 2 (24.May) and epoch 3 (02. July)
For modern wheat varieties, which are also kept artificially short using growth regulators, the plant height differences are less at the end of the growing season than during the main growth phase. Only a few cm separate high cereal crops from small crops. This means a reliable correlation between yield and crop height requires very accurate height information. This holds true not only for the DEM but also for the reference DTM.
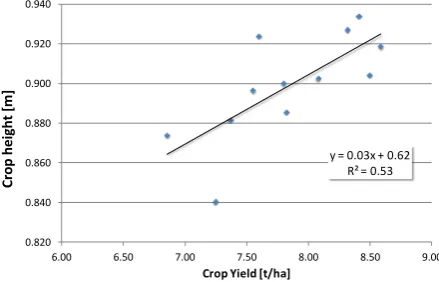
The yield significantly differs in the field trial. Plots with similar nutrient dressings are distributed over the whole field. Similar plots were summarized in order to compensate for any local inaccuracies in the height measurement. Nevertheless, the relationship between yield and the plant height is not as clear as expected, or described in the literature e.g. Girma et al, 2006, see figure. 14.
Figure 14. Correlation between crop height (2. July 2013) and yield in the winter wheat nutrient deficit experiment
To sum up: the crop height correlates to other parameters, but not always as expected. This is due to the fact that crop growth of winter wheat is not only related to the crop vitality but also to the crop development phase, nutrient status and growth regulators. Other crops, such as corn or oilseed rape show different courses of correlations during the vegetation period.
8. CONCLUSIONS AND OUTLOOK
As a consequence, the "point cloud" method is not suitable to determine the crop height for uniform arable crops. The "difference method" is simpler, faster and requires significantly less expertise to produce useful results. The required additional DTM of the bare soil surface, which is needed for the difference method, can be created quickly and relatively inexpensively with a UAS either before or directly after sowing. Finally the
difference method is delivering significantly better results than the point cloud method, therefore it is the recommended approach for crop height determination.
REFERENCES
Bending, J., Bolten, A. and Bareth, G. (2013): UAV-based Imaging for Multi-Temporal, very high Resolution Crop Surface Models to monitor crop growth variability.- PFG 2013/6, pp.551 – 562.
Bill, R. and Grenzdörffer, G. [Ed.] (2013): UAV-g2013 conference (Int. Arch. Photogramm. Remote Sens. Spatial Inf. Sci., Vol. XL-1/W2) 4–6 September 2013, Rostock, Germany
Busemeyer, L., Mentrup, D., Möller, K., Wunder, E., Alheit, K., Hahn, V., Maurer, H.-P., Reif, J.C., Würschum, T., Müller, J., Rahe, J. and Ruckelshausen, A. (2013): BreedVision A Multi-Sensor Platform for Non-Destructive Field-Based Phenotyping in Plant Breeding.- Sensors 2013, 13, pp. 2830-2847
Ehlert, D. Adamek, R. Und Horn, H.-J. (2009): Laser rangefinder-based measuring of crop biomass under field conditions.- Precision Agriculture 10: pp.395–408
Girma, K. Martin, K. L. Anderson, R. H. Arnall, D. B. Brixey, K. D. Casillas, M. A. Chung, B. Dobey, B. C. Kamenidou, S. K. Kariuki, S. K. Katsalirou, E. E. Morris, J. C. Moss, J. Q. Rohla, C. T. Sudbury, B. J. Tubana, B. S. And Raun, W. R. (2006): Mid-Season Prediction of Wheat-Grain Yield Potential Using Plant, Soil, and Sensor Measurements.- Journal of Plant Nutrition 29: pp. 873 – 897
Grenzdörffer, G. and Bogdanov, S. (2013): UAS-basierte automatisierte Vogelzählung am Beispiel einer Sturmmöwenkolonie der Vogelschutzinsel Langenwerder, DGPF-Jahrestagung 27.2-01.03.2013, Freiburg, pp. 141 - 157.
Haala, N. (2013): The Landscape of dense Image Matching Algorithms.- In: Fritsch, D. [Ed.]: Photogrammetric Week 2013.- pp. 271 - 284.
Stark, R., Gitelson, A., Grits, U., Rundquist, D. and Kaufman, Y. 2000. New technique for remote estimation of vegetation fraction: principles, algorithms and validation, Aspects of Applied Biology, 60,: pp. 241 - 246.
Wenzel, K., Rothermel, M. ad Haala, N. (2013): SURE – The ifp Software for Dense Image Matching.- In: Fritsch, D. [Ed.]: Photogrammetric Week 2013.- pp. 59 - 70. Wichmann Verlag.
Yin, X., McClure, M.A. Jaja, N. Tyler, D.D. and Hayes R.M. (2011): In-Season Prediction of Corn Yield Using Plant Height under Major Production Systems.- Agronomy Journal 103: pp. 923-929.
Zacharias, P. (2013): Untersuchung zur direkten Bestandeshöhenermittlung verschiedener landwirtschaftlicher Kulturen aus UAS-Punktwolken.- Bachelor thesis, 39 p.
Zhang, L., Grift, T. E. (2012): A LIDAR-Based Crop Height Measurement System for Miscanthus giganteus, Computers and Electronics in Agriculture 85.
0.00 0.10 0.20 0.30 0.40 0.50 0.60 0.70 t3
6.00 6.50 7.00 7.50 8.00 8.50 9.00
C