An event history model of student departure
S.L. DesJardins
a,*, D.A. Ahlburg
b, B.P. McCall
baPlanning, Policy, and Leadership Studies, University of Iowa, N491 Lindquist Center, Iowa City, IA 52242, USA bIndustrial Relations Center, University of Minnesota, 321 19th Avenue S., Minneapolis, MN 55455, USA
Received 1 September 1998; accepted 2 October 1998
Abstract
This study uses a modeling technique often used in economics and other disciplines but rarely applied to educational research. The technique, known as event history modeling, is used to examine the temporal dimensions of student departure from a large research university. This approach allows researchers to remedy analytic problems often found when standard statistical procedures are used to study longitudinal events such as student departure from college. The study confirms most of the substantive findings of earlier research but we document that key explanatory variables have differential effects over time. Pinpointing the times at which students are at risk of leaving college will permit more efficient intervention strategies which could reduce the social, institutional, and individual costs often associated with leaving college before degree completion.1999 Elsevier Science Ltd. All rights reserved.
Keywords: Event history modeling; Censoring; Time-varying coefficients; Unobserved heterogeneity
1. Introduction
When a student leaves college before degree com-pletion costs are imposed on society, the institution, and the student. The educational research literature docu-ments these costs (Pascarella & Terenzini, 1991). The social costs include reduced economic output if college graduates are more productive than students who drop out. Society also may lose a source of public revenue, since college graduates tend to earn more than others and college graduates have enjoyed a more rapid increase in their incomes in the last decade (Psacharopoulos, 1985). Persons with lower levels of educational attainment are more likely to need government transfer payments and are more likely to become unemployed (Kiefer & Neum-ann, 1979). College graduates are less likely to be wel-fare recipients (Blank, 1989) and have lower rates of incarceration and anti-social behavior (Haan, 1975). Also, there may be adverse intergenerational effects if a person’s socioeconomic status is linked to the amount
* Corresponding author. E-mail: stephen-desjardins@ uiowa.edu
0272-7757/99/$ - see front matter1999 Elsevier Science Ltd. All rights reserved. PII: S 0 2 7 2 - 7 7 5 7 ( 9 8 ) 0 0 0 4 9 - 1
and quality of education of their parents (Bowles, 1972). If intergenerational effects exist, high rates of dropout (exiting college and not returning) by low-income and minority students may result in racial or socioeconomic bipolarization in future generations.
Institutions are affected by student dropout because much of the funding provided to higher education is based on enrollments. As public institutions grow, they receive (proportionately) more money. Since labor and capital costs do not grow in proportion to enrollments, institutions often use the extra funds to implement new programs and other kinds of development (Bowen, 1980). Conversely, when enrollments are adversely affected by student attrition, institutions may incur fund-ing decreases disproportionate to the loss of students. Also, given the recent accountability movement in higher education, high dropout rates are considered by oversight agencies and the general public as a sign of institutional failure. The relative scarcity of educational resources at the federal and state levels makes it even more important that higher education institutions use public support efficiently.
education must become better informed about how social, environmental, and individual factors affect stud-ent departure decisions. This paper provides insights into how educational stakeholders can improve their under-standing of the student departure process. The major pur-poses of this line of inquiry are first, to discuss a statisti-cal modeling approach, event history modeling, that overcomes many of the deficiencies of previous models of student departure and allows powerful insights into the dynamics of this process and, second, to present a model of student departure that draws on data commonly available to institutions of higher education.
In Section 2 we discuss the previous research on stud-ent departure. In Section 3 statistical problems that have plagued earlier studies of student departure are discussed and we present a conceptual and formal statistical model of student departure. In Section 4 the model specification and sample attributes are presented. Section 5 details the empirical results. In the final section (Section 6) we dis-cuss the policy implications, the limitations of the study, and possibilities for further research.
2. Previous studies of student departure
Many studies have attempted to test the two major competing theories of persistence: the Student Inte-gration Model (Spady, 1970, 1971; Tinto, 1975, 1982, 1987, 1988) and the Student Attrition Model (Bean, 1978, 1980, 1981, 1982, 1983; Price, 1977). These stud-ies stress the importance placed on the predictive validity of precollege variables in the former and on factors external to the institution in the latter.
Based largely on Spady’s and Tinto’s research, the Student Integration Model stresses the importance of stu-dents’ academic and institutional commitments. These commitments are shaped by interrelations that take place within the institution, namely a matching between stu-dents’ motivations and academic ability and the insti-tution’s academic and social characteristics (Cabrera, Nora & Castaneda, 1993). The Student Attrition Model emphasizes the importance of the intention to remain enrolled or to depart from college. The sequencing of events leading to departure is hypothesized to be the fol-lowing: beliefs shape attitudes, and attitudes affect the intent to remain enrolled or to drop out. Differentiating the Student Attrition Model from the Student Integration Model is the relative importance attributed to factors external to the institution. The Student Attrition Model posits a much more important role for factors external to the institution in influencing student attitudes and enrollment decisions (for a more detailed examination of the literature see Bean, 1981).
While the Student Integration and Student Attrition Models have been viewed as competing frameworks, Cabrera et al. (1993) have shown that this is not the case.
Important components of the models overlap, and other aspects of the models are complementary. Cabrera and colleagues offer an integrated model that yields a differ-ent understanding of the persistence process. Emphasis is placed on the structural specification of the psycho-logical and sociopsycho-logical processes underlying persist-ence behavior.
One of the goals of this study is to help develop a better understanding of student departure from college. Most theories of student departure have been effective at describing student departure but quite ineffective in explaining this process (Tinto, 1993). By shedding light on the longitudinal nature of the process of student departure, we hope to provide a method that will better enable us to describe and explain student departure from college. Although it is widely appreciated that the pro-cess of student departure from college is dynamic, pre-vious studies have either ignored the timing of stopout (temporarily leaving college), dropout, or graduation or have focused on a convenient time frame, such as track-ing students from fall-to-fall or examintrack-ing departure before and after an arbitrarily chosen point in time (4 or 5 years). Event history models allow us to incorporate a more exact timing of departure into the estimation of student exits from college and permits a more appropri-ate utilization of longitudinal data as called for by Pasca-rella (1986).
3. Methodological considerations
3.1. Conceptual underpinnings
The search for a “general theory” of student departure from college is fraught with difficulties. Attempts to sys-tematically explain a very complicated set of psychologi-cal, social, economic, and organizational interactions is a daunting task. Given these difficulties, and others related to higher education (e.g. resource constraints and governing boards’ and legislatures’ focus on institutional accountability), many institutions may be better served by focusing on institution-specific concepts and methods designed to better inform institutional policy making.
Thus, rather than specifying the structural paths through which variables affect student departure decisions (as some of the aforementioned research has done), this study uses a reduced-form model that focuses on pre-college, demographic, certain current-achieve-ment, institutional, and financial variables. Incorporating variables used in the structural studies allows us to include the internal factors found to be important by the integration models and the external predictors that have had significant effects in the attrition models.
other educational issues, this approach has been used very infrequently in educational research (exceptions are Singer & Willett, 1991; DesJardins, 1993, 1996; DesJar-dins, Ahlburg & McCall, 1994; Ronco, 1994; Chizmar & Cummins, 1994; Ronco, 1996; Ahlburg, McCall & Na, 1997; Guerin, 1997; Xiao, 1997).1 Willett and Singer
(1991) attribute this infrequency to a lack of a coherent methodology that allows researchers to model longitudi-nal risk profiles as a function of multiple predictors and incorporate data problems often found in longitudinal designs (e.g. “censoring”). Advances in event history modeling since Willett and Singer first made these obser-vations allow us to remedy both of the aforementioned problems. We are also able to add three more improve-ments over earlier research: unobserved heterogeneity controls; incorporation of “time-varying coefficients”; and allowance for “competing” events to be modeled simultaneously (“competing risks” models).
Our model requires only variables typically available to most institutions; no expensive surveying is necessary to collect the attitudinal data which is often used in other student departure research. Using only institutional data may be an advantage because the exogeneity of attitudi-nal variables is often open to question and inclusion of survey data typically reduces the sample size because of non-response. In their structural model of college persist-ence, for example, Cabrera et al. (1993) had an initial sample of 2453 students. After surveying to obtain meas-ures of academic and social integration, their effective sample dropped to 466 students, or about 19% of their original sample. Even though they found the character-istics of respondents and nonrespondents “mirror the tar-get population in most factors” (1993, p. 579), there was probably a selection bias and a loss of statistical pre-cision since the authors have no way of determining whether unobserved characteristics caused students to self-select into their study. Thus, it appears that the
per-ceived (though undocumented) gains in structural detail
were paid for by a reduction in statistical precision. Event history models that use complete institutional data avoid these sample attrition problems. Also, by incorpor-ating unobserved heterogeneity controls instead of sur-vey-based attitudinal measures, reduced-form event his-tory methods may actually be more statistically robust than the structural studies done to date. Certainly more research needs to be done to evaluate the tradeoffs between using attitudinal measures (with reduced sample size) and not including these instruments (and retaining more of the sample) but statistically controlling for unob-served factors.
1Most of these papers have been presented at the Association for Institutional Research’s Annual Forum. Few event history studies of educational issues have been published to date.
3.2. Conceptualizing the empirical model
The empirical model used is a discrete-time hazard model since the duration data is collected term-by-term until the occurrence of the event (first stopout, dropout, or graduation). In this study, first stopout is defined as the first occurrence of non-continuous enrollment. Graduation is defined as the awarding of a bachelor’s degree anytime within the (approximately) seven-year window. Dropout is defined in two ways. First, a student is defined as a “dropout” if he or she exits the institution and does not return at any time during the subsequent observation period (the total observation period is 22 terms, or a little more than 7 years). Under the second specification a student who drops out within the first 5
years of the observation period is defined as a “censored
dropout.” The latter definition is included as a robustness check of the original dropout model since the results obtained under the original definition may depend on how much time students have to reenroll. For instance, for students who leave the institution in their second year of enrollment we have about five years of time to observe whether they reenroll or not. For students who leave in the sixth year, however, we have only one year of time to observe whether they return or not. Thus, sixth year leavers may actually be stopouts (they returned, but outside the observation period) but are defined as dro-pouts under our first definition. The censored definition allows us to test the sensitivity of our results to the speci-fication of the dropout variable.
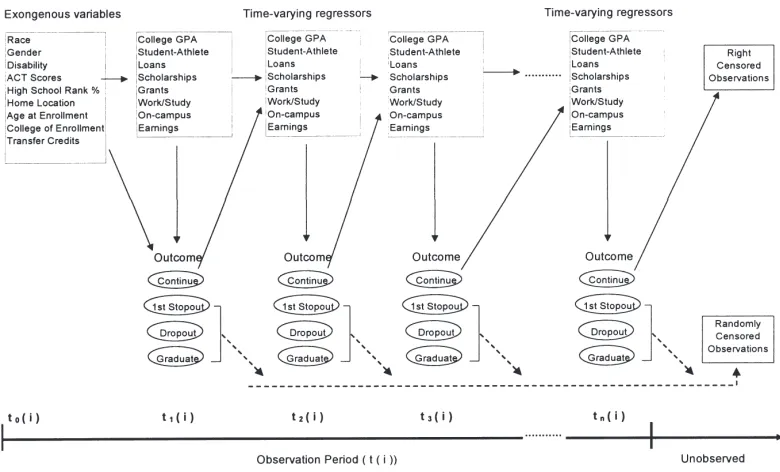
Our conceptual framework is presented in Fig. 1. Dur-ing each term there are four possible outcomes of inter-est, each depicted by an oval. Exogenous and time-vary-ing factors are hypothesized to affect a student’s (individual i) enrollment decision at discrete points (time
t) during their academic career. Since the values the
exogenous variables assume are constant, they are dis-played only once in the framework. However, even though the values that the exogenously determined vari-ables take may not change over time, the effects they have on student departure may vary over time. Thus, it is important to include these variables as regressors in each subsequent time period. Time-varying regressors, since their values and effects can change over time, are depicted in separate boxes at each discrete time period. Thus, the inclusion of “exogenous” and “time-varying” regressors constitute all of the variables specified in the longitudinal models estimated in this paper.
The regressors specified in Fig. 1 are hypothesized to affect a student’s decision to remain in college or leave the institution. For a student who decides to remain enrolled (“continue”) after time period one, a solid arrow depicts their progression to the next time period (t2(i)).
Fig. 1. Reduced-form model of first stopout and dropout. Adapted from Johnston (1984, p. 8).
college temporarily (labeled as “1st stopout”). A priori we don’t know if or when a student will stop out for the first time therefore a dashed line is included to show that the event occurrence is a possibility in each time period. Some students decide to leave college permanently (“dropout”). Other students make satisfactory progress toward a degree and eventually graduate (“graduate”).
In this study we estimate two single risk models and one competing risks model. Depending on the outcome being studied, some student events are treated as cen-sored in event history modeling. When estimating a sin-gle risk model of time to first stopout, for instance, stu-dents who earn a degree without interrupting their academic progress are no longer at risk of first stopout and are therefore censored at the time of graduation (“randomly censored observations” in Fig. 1). When studying dropout behavior, students who graduate (whether they have been continuously enrolled or not) are censored at the time of graduation. Thus, graduates are censored in the time periods in which they receive their degrees whether we are studying first stopout or dropout. Again, since graduation is a possibility during any time period, a dashed arrow is used to show how censoring removes students from the at-risk pool.
Another way censoring takes place is when a student does not experience the event of interest during the observation period. If the outcome being studied is dro-pout, students who do not earn a degree and are still enrolled in the last period of observation (tn(i)) are right
censored. In terms of the framework outlined in Fig. 1, the student’s outcome is beyond time (tn(i)) and
there-fore “unobserved.”
Formally, this model is described by the following set of conditions. Let K be a discrete random variable meas-uring the number of periods until an event occurs. It is assumed that the event of interest is influenced by a vec-tor of time-varying explanavec-tory variables zk. Let P(K5 kuK > k 21, z1, …, zk) represent the conditional
prob-ability that the event occurs in period k given that it has not occurred by k2 1, where z1, …, zk represents the
set of values of the explanatory variables until time k. One technical point is that the time-varying regressor zk
must be measurable with respect to the information available at time k21. A student’s grade point average in term three, for example, is used as a lagged indicator of the student’s probability of exit in term four.
The standard model for this conditional probability is the (discrete-time equivalent of the) proportional hazards model (see Cox, 1972; Prentice & Gloeckler, 1978; Meyer, 1986, 1990; Han & Hausman, 1990):
P(K5kuK > k21,z1,…,zk)5 (1)
12exp(2exp(ak1bzk))
where b is a vector of coefficients that measure the effects of the explanatory variables (zk) andakis a
time-varying constant term, k 5 1, 2, 3, …. An alternative model, typically used in earlier education-related studies using event history methods (Singer & Willett, 1991; DesJardins, 1993; Ronco, 1996) is the “logit” model:
P(K5kuK > k21,z1,…,zk)5 (2)
exp(ak1bzk)/11exp(ak1bzk)).
depar-ture research, one drawback of model (1) is that it assumes that all the determinants of the event are accounted for by the explanatory variables (zk). Model
(1) also assumes that the effects of the explanatory vari-ables are constant over time. Violations of either of these assumptions, which are common when doing social science research, may cause biased estimates.
The model outlined below generalizes model (1) by allowing for time-varying effects and includes an unob-served heterogeneity variable. The new model is there-fore a substantial improvement over the proportional hazards model presented above (see McCall, 1994 for details). To account for unobserved heterogeneity, it is assumed that the event of interest is influenced by a ran-dom variableu, where uis unobserved and distributed independently of zk. Let G denote the cumulative
distri-bution function (c.d.f.) ofu. For identification purposes the mean ofuis fixed at 1 (the unit mean assumption is simply a normalization; the mean could be fixed at any finite value). Let P(K5kuK > k21, z1, …, zk,u)
rep-resent the conditional probability that the event occurs in period k given that it has not occurred in the first k2 1 periods of enrollment. The values of the time-varying regressors in periods 1 through k, z1, …, zk are
observ-able and the unobserved variobserv-able is specified asu. It is assumed that
P(K5kuK > k21,z1,…,zk,u)5 (3)
12exp(2exp(ak1bkzk)u)
wherebk measures the (possibly time-varying) effect of zk in period k and ak is again a time-varying constant
term, k51, 2, 3, …. Model (1) is the special case of (3) wherebk 5b for all k andu equals 1 with
prob-ability one.
Model (3) is estimated by maximum likelihood and non-parametric maximum likelihood techniques (see Heckman & Singer, 1984). McCall (1994) has shown that G is non-parametrically identified so that the latter method is feasible.
The competing risks models (jointly estimating first stopout and graduation) estimated were run as robustness checks of our single risks results, specify a functional form similar to (3) for each risk. Each risk has a separate unobserved heterogeneity variable although it is possible that they are correlated.
4. Specifying the empirical model
4.1. The sample and statistical routine
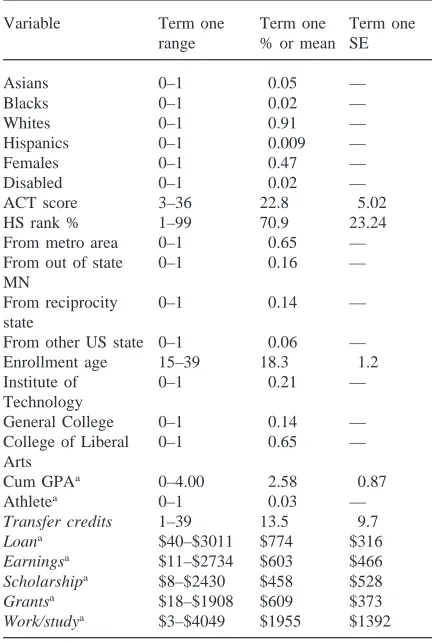
Table 1 provides a detailed description of the compo-sition of the sample. The original sample consisted of 4100 students who entered the University of Minnesota (Minneapolis campus only) as New High School students
Table 1
Descriptive statistics of the sample
Variable Term one Term one Term one range % or mean SE
Asians 0–1 0.05 —
Blacks 0–1 0.02 —
Whites 0–1 0.91 —
Hispanics 0–1 0.009 —
Females 0–1 0.47 —
Disabled 0–1 0.02 —
ACT score 3–36 22.8 5.02
HS rank % 1–99 70.9 23.24
From metro area 0–1 0.65 —
From out of state 0–1 0.16 —
MN
From reciprocity 0–1 0.14 —
state
From other US state 0–1 0.06 —
Enrollment age 15–39 18.3 1.2
Institute of 0–1 0.21 —
Technology
General College 0–1 0.14 —
College of Liberal 0–1 0.65 —
Arts
Cum GPAa 0–4.00 2.58 0.87
Athletea 0–1 0.03 —
Transfer credits 1–39 13.5 9.7
Loana $40–$3011 $774 $316
Earningsa $11–$2734 $603 $466 Scholarshipa $8–$2430 $458 $528
Grantsa $18–$1908 $609 $373
Work/studya $3–$4049 $1955 $1392
aIndicates (possibly) time-varying regressors.
in the fall term of 1986.2 After deleting records with
missing information the effective sample size used in the event history procedure was 3975, or roughly 97% of the original sample. Twenty-two terms of data were col-lected on these individuals from a variety of institutional sources. It should be noted that this dataset includes only one record per person. In contrast, when using logistic regression to do event history modeling one must con-struct a “person-period” dataset which includes a record for each time period in which the individual is at risk of the event (see Allison, 1984; Singer & Willett, 1991; Yamaguchi, 1991; DesJardins, 1993).
After construction, the dataset was moved to a Cray X-MP-EA supercomputer housed at the Minnesota Supercomputer Institute. The single risks models were
estimated with a FORTRAN program initially developed by Bruce Meyer of Northwestern University and modi-fied for our purposes by co-author Brian McCall. The competing risks specifications were estimated using a statistical model designed and programmed by McCall. The maximum likelihood technique used to estimate the models is an iterative process and, coupled with the large number of parameters included as regressors, the amount of memory needed to estimate the models is substantial. As indicated in Table 1, the value of some of the inde-pendent variables may change from term-to-term. Also, the averages cited for each of the financial aid variables are conditional on receipt of an aid offer, and the transfer credit average includes only students with previous col-lege credits (which is why the transfer credit and finan-cial aid variables are italicized in Table 1). Another note about the financial aid variables is necessary. For the fol-lowing analyses the amount of aid (by type) offered to an individual is the relevant measure. Aid offered is used in an attempt to mitigate the self-selection (endogeneity) bias that results if financial aid paid is used.
4.2. The empirical model
As mentioned above, there are four different model specifications with respect to the outcome of interest; time to first stopout, time to dropout, time to “censored” dropout, and a competing risks model of the duration to first stopout and graduation. For each of the models estimated the specification of the dependent variable is duration until the time of the relevant event (events in the competing risks case). Thus, conditional on having the event, for each individual in the sample we know the time (the number of terms) to the relevant event(s). Time to event(s), therefore, is the fundamental outcome of interest in each of the models estimated.
As is the case for many discrete dependent variable models, an unobserved continuous variable representing the individual’s utility level actually generates the dis-crete outcome of interest. It is assumed that each student makes a decision about continued enrollment by weigh-ing the future costs and benefits of goweigh-ing to college. If the net benefits are negative (positive), the student exits (remains enrolled in) college. Thus, the assumption that students make rational utility calculations allows us to implicitly include student intentions, a factor found to be important in the student-departure literature (Tinto, 1975; Bean, 1978). That students base the choice of whether to stay or not to stay in school on internal opti-mality conditions is an often overlooked but important point. “It is this choice component that distinguishes the econometric analysis of transition data from standard applied statistical analysis of survival and transition data and gives a richness but also an added complexity to econometric work” (Lancaster, 1990, p. 6).
The vectors of regressors (z1, …, zk) specified in (3)
include individual background, organizational, and environmental variables. The independent variables included in the models were chosen based on theoretical considerations and previous research on student depar-ture. Individual background variables include race, gen-der, age, initial home location and whether the student has a disability. Race is entered into the models by inclusion of three dummy variables (Asian-American, African-American, and Chicano/Hispanic). The refer-ence group is white students. American-Indian and inter-national students were omitted because of the small num-ber of these students in the sample. Race was included in the empirical specification since many studies of student departure have found that minority students tend to have higher probabilities of dropout and stopout, and lower probabilities of graduation than majority students. There may very well be race differences but it is also possible that these results are a function of insufficient control variables in models used to date. Race was also included because little information is available about the time
pro-file of college departure for minority students.
Gender is specified by inclusion of a dummy variable indicating whether the student is a female or not. Over the years, conflicting results have been found with regard to the relationship between gender and college departure. Thus, this variable is included to examine whether there are longitudinal differentials by gender. Age at the time of initial enrollment is also included as a regressor and it is hypothesized that older students are more likely to stop out and drop out than traditional college students given the likelihood of significant time constraints (jobs, family). A variable indicating whether the student is dis-abled is also included. No a priori empirical research was found indicating whether disabled students were at higher risk of leaving college before graduation. During the 1980s, however, disabled students at the study insti-tution had voiced concerns about physical access to buildings, classrooms, and special programs. Therefore, the inclusion of this variable seemed appropriate.
Home location is included as a control and oper-ationalized by a series of dummy variables. These vari-ables include whether a student is from the Twin Cities metropolitan area, from greater Minnesota, or from a tui-tion reciprocity agreement state. The reference category consists of students who are non-Minnesotans and not from a reciprocity state. Research has shown that dis-tance from campus to a student’s home is associated with persistence (Ramist, 1981). Also, since students from tion reciprocity agreement states receive discounted tui-tion (relative to the normal non-resident tuitui-tion), we included the reciprocity controls to examine the effects that these agreements have on student departure.
with high scholastic aptitudes should have (relatively) more academic potential and would be less likely to exit before graduation (see Spady, 1970). It is also possible, however, that there are differences in what the ACT exam score and high school rank percentile (typically used as ability proxies) are measuring. ACT scores mea-sure ability within the pool of all entrance exam test tak-ers and if students with high ACT scores have more schooling options, they may be prone to leave insti-tutions if they perceive it to be a bad academic fit. High school rank percentile reflects variation within one’s high school and (after controlling for other ability measures) may also be thought of as a proxy for stud-ent effort.
Also included is a variable indicating the number of transfer credits of University matriculants. Students who have had some prior college experience (they could have taken college course work while in high school) should be better able to adjust to college life, be more likely to become academically and socially integrated (Tinto, 1975), and, therefore, be more likely to persist and graduate than students entering college for the first time. There is at least one alternative hypothesis though: stu-dents who enter with previous college course work may be “movers” who are searching for the right institutional fit and are therefore more likely to leave.
Institution-related variables are included to examine the effects of student interactions with the institution. The initial collegiate unit of enrollment of a student is included to examine whether there are college specific environmental factors that help to explain student depar-ture from college. Cross-sectional designs have found that students in the Institute of Technology (IT) are less likely to drop out and more likely to graduate than Col-lege of Liberal Arts (CLA) students (Matross & DesJard-ins, 1994). General College (GC) students,3on the other
hand, appear to have lower chances of graduating and higher chances of dropping out than students enrolled in other collegiate units. It is not clear, however, that these subgroup results garnered from aggregate graduation and retention rate data will hold after accounting for other factors usually found to be related to student departure. Also, even though students may change collegiate units during their academic careers, we were only interested in their initial college of enrollment because most student departure (at this institution) takes place from these units. In future studies we will examine how transferring among colleges (allowing collegiate unit to vary by term) affects student departure decisions, especially at the upper division.
3General College enrolls underprepared and other special needs students and prepares them for transfer to schools and colleges of the University and other higher education insti-tutions. General College does not grant degrees.
A student’s grade point average for each term of enrollment is calculated and included to control for vari-ations in academic performance. One’s grade point aver-age is also hypothesized to be the reward for successful academic achievement. Financial aid offered is included for each term and dissagregated into its component parts: loans, scholarships, grants, work/study earnings, and earnings as a student employee (other than work/study) on campus. Typically, financial circumstances are con-sidered environmental variables because they are out of the control of the institution (Bean, 1981). Since state and institutional policymakers do have some direct trol over the way aid is distributed, aid variables are con-sidered organizational in this model. For instance, grants are included separately from scholarships in order to examine whether there are differences in how these sources of aid independently affect student departure [St John and Starkey (1995) discovered that financial sub-sidies have differential effects]. To examine these effects in more detail we plan to disaggregate grants into federal and state components so that we can evaluate whether these aid packages have differential effects on student departure.
Finally, a dummy variable is included indicating whether the student is an athlete during each term of enrollment. Athletes’ rates of dropout and graduation have been a source of much discussion nationally and at the study institution. Therefore a variable distinguishing athletes from the general student population is included in an effort to better understand the longitudinal nature of athletes’ academic progress (Naughton, 1996).
5. The empirical results4
When modeling each of the events of interest we began by estimating “naı¨ve” models and made them more complex as we progressed. Initially, time-constant coefficient (TCC) models without unmeasured hetero-geneity controls were estimated. Then unobserved het-erogeneity controls were added to the TCC models to determine whether the results varied. Next, a time-vary-ing coefficient (TVC) model without unobserved hetero-geneity controls was estimated to examine how the intro-duction of time-varying coefficients affect the results. Finally, we estimated TVC models with various para-metric and “flexible” heterogeneity variables to see how
controlling for unobserved factors affects the robustness of the results.
5.1. Modeling time to first stopout
As mentioned above, we initially estimated a single risk model of time to first stopout. The simplest model estimated was the TCC model without a control for unobserved heterogeneity. This model was used as a benchmark since most event history models of student departure done to date have been similar to this specifi-cation (Willett & Singer, 1991; Singer & Willett, 1991; DesJardins, 1993; Ronco, 1996). We then estimated a TCC model but included a gamma distributed unob-served heterogeneity control. We then estimated TCC models that assumed various mass point mixing distri-butions for the unobserved heterogeneity term. The esti-mates produced by the TCC models did not vary to a great degree. With regard to model fit, the likelihood dropped as the model specification went from time con-stant with no control for unobserved heterogeneity (L5 28589) to a TCC three mass point model (L5 28466). These results suggest that the three mass point specifi-cation is more robust than the TCC model with no het-erogeneity controls.5
5.2. Adding time-varying regressors to the stopout models
It is unrealistic to think that the effects of factors that explain student departure from college are invariant with respect to time, therefore we estimated TVC models. As was done for the TCC models, various distributional assumptions about the sources of unmeasured heterogen-eity are specified as robustness checks.
The first TVC model estimated included the same regressors as the TCC models described above, although some variables were now permitted to vary over time. Based on model fit, the benchmark TVC model was pre-ferred to the TCC benchmark model (P,0.001; LTVC
5 28331; LTCC5 28589 with 84 d.f.). Generally, a
comparison of the results obtained from the TCC model with those estimated by the TVC model indicates that the regressors have effects on first stopout probability that change over time. Thus, adding a time dimension improves our understanding of first stopout.
5.3. Including controls for unobserved heterogeneity
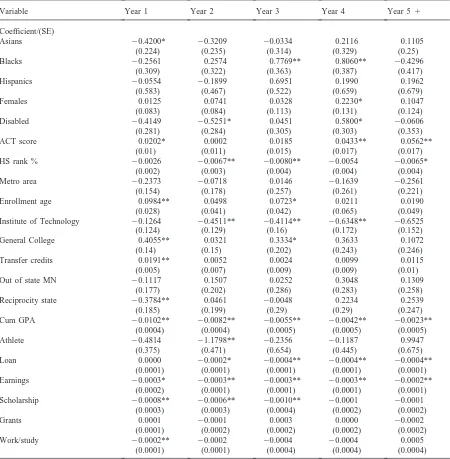
Next we added unobserved heterogeneity controls to the TVC model. The results displayed in Table 2 are produced by a TVC model that assumes a two mass point
5Not all results of the numerous models we estimated are included herein but are available from the authors on request.
mixing control for unobserved heterogeneity (we also estimated a gamma model but the two mass point model was preferred based on model fit). Our discussion of the results will be based on the preferred model and major differences between the gamma model and two mass point mixing model will be noted.
5.4. First stopout results
We found that Asian students are less likely to stop out (in year one) than their white counterparts. This first year effect was masked, however, in the TCC model results. African-American students are more likely than white students to stop out in years three and four. Chicano/Hispanics, on the other hand, have stopout prob-abilities no different than those of their white counter-parts when we control for unobservables. While Ottinger (1991) finds that males are more likely to stop out than females, we find that females stopout risks are not stat-istically different than those of males except in year four. The year-four effect is not apparent, however, until the control for unobserved heterogeneity is included. The effects of being disabled also vary depending on the inclusion of a control for heterogeneity. In addition to the year-four effect found when no unobservable control was included, a year-two disability effect appears when unobserved heterogeneity takes a gamma or mass point mixing form. Of particular interest is that the sign of the coefficient changes between years two and four: disabled students are less likely than the general population to stop out in year two, but are more likely to leave for the first time in year four.
Examining our control for home location, the only sig-nificant effect is that students from tuition reciprocity states are less likely (than non-Minnesota, non-recip-rocity students) to leave in year one. Ramist (1981) found that distance from campus to a student’s home is negatively associated with persistence.
Students who enter college later in life appear to be at higher risk of first stopout in years one and three than individuals who enter the institution at a younger age. Again, the year-three effect becomes apparent only when controls for heterogeneity are included.
hypoth-Table 2
Estimates of first stopout for a time-varying coefficient model with two mass point mixing unobserved heterogeneity distribution
Variable Year 1 Year 2 Year 3 Year 4 Year 51
Coefficient/(SE)
Asians 20.4200* 20.3209 20.0334 0.2116 0.1105
(0.224) (0.235) (0.314) (0.329) (0.25)
Blacks 20.2561 0.2574 0.7769** 0.8060** 20.4296
(0.309) (0.322) (0.363) (0.387) (0.417)
Hispanics 20.0554 20.1899 0.6951 0.1990 0.1962
(0.583) (0.467) (0.522) (0.659) (0.679)
Females 0.0125 0.0741 0.0328 0.2230* 0.1047
(0.083) (0.084) (0.113) (0.131) (0.124)
Disabled 20.4149 20.5251* 0.0451 0.5800* 20.0606
(0.281) (0.284) (0.305) (0.303) (0.353)
ACT score 0.0202* 0.0002 0.0185 0.0433** 0.0562**
(0.01) (0.011) (0.015) (0.017) (0.017)
HS rank % 20.0026 20.0067** 20.0080** 20.0054 20.0065*
(0.002) (0.003) (0.004) (0.004) (0.004)
Metro area 20.2373 20.0718 0.0146 20.1639 20.2561
(0.154) (0.178) (0.257) (0.261) (0.221)
Enrollment age 0.0984** 0.0498 0.0723* 0.0211 0.0190
(0.028) (0.041) (0.042) (0.065) (0.049)
Institute of Technology 20.1264 20.4511** 20.4114** 20.6348** 20.6525
(0.124) (0.129) (0.16) (0.172) (0.152)
General College 0.4055** 0.0321 0.3334* 0.3633 0.1072
(0.14) (0.15) (0.202) (0.243) (0.246)
Transfer credits 0.0191** 0.0052 0.0024 0.0099 0.0115
(0.005) (0.007) (0.009) (0.009) (0.01)
Out of state MN 20.1117 0.1507 0.0252 0.3048 0.1309
(0.177) (0.202) (0.286) (0.283) (0.258)
Reciprocity state 20.3784** 0.0461 20.0048 0.2234 0.2539
(0.185) (0.199) (0.29) (0.29) (0.247)
Cum GPA 20.0102** 20.0082** 20.0055** 20.0042** 20.0023**
(0.0004) (0.0004) (0.0005) (0.0005) (0.0005)
Athlete 20.4814 21.1798** 20.2356 20.1187 0.9947
(0.375) (0.471) (0.654) (0.445) (0.675)
Loan 0.0000 20.0002* 20.0004** 20.0004** 20.0004**
(0.0001) (0.0001) (0.0001) (0.0001) (0.0001)
Earnings 20.0003* 20.0003** 20.0003** 20.0003** 20.0002**
(0.0002) (0.0001) (0.0001) (0.0001) (0.0001)
Scholarship 20.0008** 20.0006** 20.0010** 20.0001 20.0001
(0.0003) (0.0003) (0.0004) (0.0002) (0.0002)
Grants 0.0001 20.0001 0.0003 0.0000 20.0002
(0.0001) (0.0002) (0.0002) (0.0002) (0.0002)
Work/study 20.0002** 20.0002 20.0004 20.0004 0.0005
(0.0001) (0.0001) (0.0004) (0.0004) (0.0004)
Likelihood L528316. *P,0.05; **P,0.01.
esis is true, it may help to explain why so few GC stu-dents eventually graduate from the University.
Students who perform better in college have been found to be more likely to persist (Pascarella & Teren-zini, 1980, 1991; Cabrera et al., 1993). Our analysis also indicates that students with high grade point averages are less likely to stop out. Our analysis, however, provides more detail about how this effect varies over time. Stu-dents who perform well in college (as indicated by
higher GPAs) are less likely to stop out over the seven years observed, but the strength of this relationship tends to dissipate over time.
Students who enter the institution with some college experience are more likely to stop out in year one than students who do not have transfer credits. There may be some social or academic adjustment period for students from other institutions which may explain this result. This result may, however, be counterintuitive if we believe that students with some college work should already be adjusted to college life. There is at least one alternative hypothesis though: students who enter with previous college course work may be “movers” who are searching for the right institutional fit and are therefore more likely to leave.
Finally, the effect of the offer of financial aid appears to vary temporally and by type of aid offered. In every year, conditional on receiving an aid offer, students who earn extra money by being employed on campus (Earnings) are less likely to stop out. This result may reflect the effect of social integration on student stopout, in that students who work on-campus have closer ties to the college community than do students who do not work on-campus. Even after accounting for other factors, scholarships appear to decrease student stopout in years one through three. Grants, however, do not appear to have a statistically significant independent effect on first stopout probabilities. The effect of loans on first stopout is statistically significant and negative in all years except year one. Work/study apparently helps students become acclimated to the institution in year one (thereby decreas-ing the chances of stopout), but has no significant effect in later years.
There are several reasons why our use of disaggre-gated financial aid offers is an important contribution. Many studies of student attrition use attitudinal data to capture the effects of students’ financial situations. These data are usually collected from surveys done at a single point in time (upon matriculation). It is often unclear, however, what these attitudinal variables measure6 and
their reliability may be questionable if matriculating stu-dents have a poor understanding of the financial conse-quences of college. Using actual levels of disaggregated financial aid allows us to examine the longitudinal and differential effects of each type of aid. Previous studies that used actual financial aid have typically included a dichotomous measure (receive aid/did not) or have included a single continuous construct (total aid paid). Dichotomization of aid into a yes/no measure ignores the substantial variability in the amount of aid paid to stu-dents and masks the impact that differential amounts of aid have on student departure. Using a total aid measure ignores the differential effects that various types of aid have on student decision-making. Changes in the way
6Attitudinal measures designed to capture the financial con-siderations of matriculating students may also be contaminated by non-pecuniary effects.
aid is being distributed by institutions (the increasing use of financial aid “leveraging”), and recent proposals by the federal government to change financial aid distri-bution, make it increasingly important for researchers to examine how aid amounts and types change student departure behavior over time.
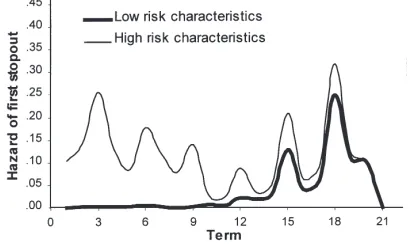
In order to provide a graphical description of the varia-bility in first stopout hazards we present Fig. 2. This graph compares the longitudinal hazard rates for two hypothetical groups of students: the first with character-istics that would indicate a high risk of a first stopout, the second for students with very low first stopout prob-abilities.7Low risk students are likely to remain
continu-ously enrolled though term 12 (year four) which implies graduation in four years. The spikes in the hazard for low risk students in terms 15 and 18 are due to the risk set diminishing because of the graduation of the majority of these students. Since there are very few low risk stu-dents remaining after year four, any first stopout activity will have a (relatively) large impact on the hazard rate. Conversely, the high risk group show propensities to leave early in their academic careers. For instance, in their first year the high-risk group has over a 50% chance of having a first stopout (the summation of term 1–3 hazards) whereas the low risk groups’ cumulative hazard is only 0.5%. Thus, the high risk group is about 100 times more likely to have a first stopout in year one than the low risk group. Also, notice the spikes in the hazards between the spring and fall terms (terms 3, 6, 9, …). Students who are likely to leave the institution are much more likely to do so after their spring term.
Fig. 2. Comparison of the hazard of first stopout.
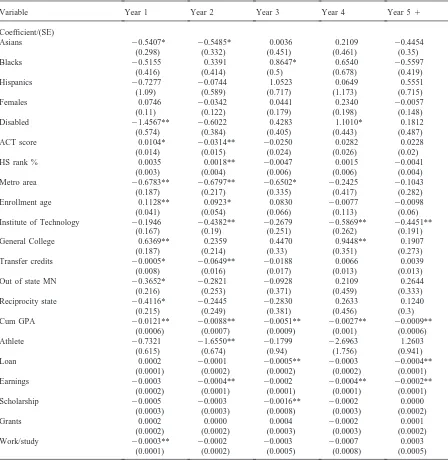
5.5. Modeling time to dropout
The same model building process used to study first stopout was also used to study dropout behavior. First, TCC models were estimated with and without controls for unobserved heterogeneity. Then TVC models with no unobserved heterogeneity controls, and gamma and mass point mixing distributional assumptions were speci-fied. As was demonstrated when stopouts were modeled, the advantages of a longitudinal approach coupled with controls for unobserved characteristics are evident. Our discussion of the dropout results will focus on the pre-ferred (based on likelihood ratio tests) TVC two mass point mixing model.
African-American students have higher dropout pro-pensities than white students in year three. This result contrasts with the conventional wisdom at the University of Minnesota that African-American students are at much higher risk of dropout than other students
through-out their academic careers. There are no statistically
sig-nificant differences between Chicano/Hispanic (Hispanic) and white students, even after controlling for unobservables. Again, cross-sectional analyses at the study institution typically indicate that Chicano/Hispanic students have relatively low rates of retention and high rates of dropout.
No gender differences are found and this result holds across all the TVC models that include unobserved het-erogeneity controls. Based on cross-sectional data from the study institution, females appear to be less likely to drop out early in their academic careers but more likely (than males) to leave later in their academic tenure. The Chicano/Hispanic and gender results noted above ques-tion the wisdom of using simple retenques-tion and graduaques-tion statistics to make policy decisions.
Interestingly, disabled students are less likely than the general population to leave in year one but are much more likely to exit in year four. No other regressor included in the model shows a statistically significant sign reversal. Since there are few disabled students in the sample the result may be due to small numbers in year four. Given the complex circumstances faced by disabled students, however, a more detailed analysis of this year-four effect is in order.
With regard to the variables used as admissions cri-teria, the effects of high school rank percentile and ACT test score on dropout differ greatly from the effects observed when modeling the stopout process. High school rank percentile has no statistically significant effect on dropout once other factors are controlled for (including ACT test score and grade point average). In the stopout model, by contrast, students with relatively high high school rankings are less likely to stop out in years two, three, and five through seven. In the dropout model, students who score high on the ACT test are less likely to depart in year two than are students with lower
ACT scores. This result, too, is markedly different from the result suggested by the stopout model: the ACT vari-able is positively associated with first stopout in years one and four through seven.
These results may be at odds with what one would expect based on simple correlations between ACT score and high school rank percentile and stopout or dropout. These results may be due to the fact that multivariate techniques like event history models allow us to examine the independent effects of explanatory variables whereas simple correlations do not. For instance, ACT may be a proxy for ability and, as mentioned above, high school rank percentile a proxy for effort. Or, the results we observe could be due to the difficulty in interpreting the independent effects of ACT score and high school rank percentile after conditioning on grade point average. In order to investigate the latter, we re-estimated the stopout model but excluded grade point average. The high school rank percentile variable was negative and highly signifi-cant (t-statistics ranging from 7.0 in year one to 4.2 in years five through seven) for each period whereas ACT score had a negative and significant coefficient in year two only. Thus, it appears that term specific grade point averages and high school rank percentile are both proxies for student ability.
A student’s original home location has differential effects on dropout probabilities. In years one through three, students from the Twin Cities metropolitan area are less likely to drop out than the reference group (non-Minnesotan, non-tuition reciprocity agreement students). Students from out-state Minnesota (Minnesotan’s from outside the Twin Cities metropolitan area) and from tui-tion reciprocity states are less likely than the reference group to leave in year one.
The results presented in Table 3 indicate that com-pared with their white counterparts, Asian American stu-dents are less likely to drop out in their first two years of enrollment only. This result is important because the institution’s retention statistics indicate that Asian stu-dents are less likely to drop out throughout their aca-demic careers.
Age at enrollment is positively associated with dro-pout in year one (and year two in the gamma model), suggesting that older students have a difficult time adjusting to their academic careers. This may be due to a multitude of time constraints since older students are more likely to be married, working in full-time jobs, and have other commitments. Students who enter an insti-tution after completing some college course work (as indicated by Transfer Credits) are less likely to perma-nently exit the institution in year two than are students who enter as “true” college freshmen (i.e. with no pre-vious college work). This result seems intuitive given that familiarity with college is an advantage, especially on a large campus.
Table 3
Estimates of dropout for a time-varying coefficient model with two mass point mixing unobserved heterogeneity distribution
Variable Year 1 Year 2 Year 3 Year 4 Year 51
Coefficient/(SE)
Asians 20.5407* 20.5485* 0.0036 0.2109 20.4454
(0.298) (0.332) (0.451) (0.461) (0.35)
Blacks 20.5155 0.3391 0.8647* 0.6540 20.5597
(0.416) (0.414) (0.5) (0.678) (0.419)
Hispanics 20.7277 20.0744 1.0523 0.0649 0.5551
(1.09) (0.589) (0.717) (1.173) (0.715)
Females 0.0746 20.0342 0.0441 0.2340 20.0057
(0.11) (0.122) (0.179) (0.198) (0.148)
Disabled 21.4567** 20.6022 0.4283 1.1010* 0.1812
(0.574) (0.384) (0.405) (0.443) (0.487)
ACT score 0.0104* 20.0314** 20.0250 0.0282 0.0228
(0.014) (0.015) (0.024) (0.026) (0.02)
HS rank % 0.0035 0.0018** 20.0047 0.0015 20.0041
(0.003) (0.004) (0.006) (0.006) (0.004)
Metro area 20.6783** 20.6797** 20.6502* 20.2425 20.1043
(0.187) (0.217) (0.335) (0.417) (0.282)
Enrollment age 0.1128** 0.0923* 0.0830 20.0077 20.0098
(0.041) (0.054) (0.066) (0.113) (0.06)
Institute of Technology 20.1946 20.4382** 20.2679 20.5869** 20.4451**
(0.167) (0.19) (0.251) (0.262) (0.191)
General College 0.6369** 0.2359 0.4470 0.9448** 0.1907
(0.187) (0.214) (0.33) (0.351) (0.273)
Transfer credits 20.0005* 20.0649** 20.0188 0.0066 0.0039
(0.008) (0.016) (0.017) (0.013) (0.013)
Out of state MN 20.3652* 20.2821 20.0928 0.2109 0.2644
(0.216) (0.253) (0.371) (0.459) (0.333)
Reciprocity state 20.4116* 20.2445 20.2830 0.2633 0.1240
(0.215) (0.249) (0.381) (0.456) (0.3)
Cum GPA 20.0121** 20.0088** 20.0051** 20.0027** 20.0009**
(0.0006) (0.0007) (0.0009) (0.001) (0.0006)
Athlete 20.7321 21.6550** 20.1799 22.6963 1.2603
(0.615) (0.674) (0.94) (1.756) (0.941)
Loan 0.0002 20.0001 20.0005** 20.0003 20.0004**
(0.0001) (0.0002) (0.0002) (0.0002) (0.0001)
Earnings 20.0003 20.0004** 20.0002 20.0004** 20.0002**
(0.0002) (0.0001) (0.0001) (0.0001) (0.0001)
Scholarship 20.0005 20.0003 20.0016** 20.0002 0.0000
(0.0003) (0.0003) (0.0008) (0.0003) (0.0002)
Grants 0.0002 0.0000 0.0004 20.0002 0.0001
(0.0002) (0.0002) (0.0003) (0.0003) (0.0002)
Work/study 20.0003** 20.0002 20.0003 20.0007 0.0003
(0.0001) (0.0002) (0.0005) (0.0008) (0.0005)
Likelihood L524905. *P,0.05; **P,0.01.
characteristics, students who enter the Institute of Tech-nology at matriculation are less likely to drop out than CLA students in all years but one and three. On the other hand, GC students are more likely to leave in year one and year four than their CLA counterparts. The year-four effect suggests that GC students are having trouble adjusting to the colleges they eventually transfer to. These results conform to other studies done within the University indicating that there are dropout problems
with GC students (DesJardins & Pontiff, 1996). The institution may want to more closely examine whether this group of students is being adequately served by being admitted to the University and/or improve their efforts to help these students make a successful transition to other colleges within (or outside) the University.
get smaller from year one through year five plus). Thus, getting good grades appears to have a relatively stronger impact on reducing the chances of dropout in year one than it does in later years of one’s academic career. This result suggests that monitoring grades early in a student’s academic career may be an effective retention strategy. Student-athletes are less likely to leave the institution in year two than students in general. Not found in this study was an “eligibility effect” where student-athletes were found to have higher dropout probabilities in year five when many of them lose their athletic eligibility (event history research done on the 1984 and 1985 cohorts at the study institution displayed this effect; see DesJardins, 1993 or DesJardins et al., 1994). When ana-lyzing more recent cohorts we will monitor how athletic status affects dropout probabilities in an effort to be able to generalize about this important subgroup of students. Financial factors related to dropout have very different time patterns than the financial factors related to first sto-pout. Whereas loans, earnings, and scholarships gener-ally reduce the stopout probabilities, they do not appear to have as profound an effect on dropout behavior. Loans are most likely to reduce dropout in year three (when many students transfer) and in the later years (five plus). Student employment effects are quite constant and reduce dropout in years two and four through seven. Work-study also reduces dropout probabilities, but only in year one. The results found for work-related variables suggest that there may be some socializing benefit con-nected to certain types of work-related financial aid. Scholarships, in particular, are helpful in reducing dro-pout in year three when students are most likely to trans-fer to upper division courses and programs. Although grants may be useful in attracting students, they do not have a significant independent effect on student dropout behavior in this sample. Given that we find differences in the effects of scholarships and grants, it may not be appropriate to combine the two and use it as a single construct. However, more study is needed on how these sources of aid operate.
5.6. Testing the robustness of the definition of dropout
We defined dropout in two different ways in order to determine whether the results vary depending on how much time a student was “given” to reenroll. Comparing the results of the TVC mass point mixing dropout model to the (preferred) TVC mass point mixing “censored” dropout model indicates that the results are trivially dif-ferent. The “censored” dropout results display a year-two effect for age at enrollment but no two-year age effect was found in the initial dropout model results. This find-ing merely strengthens our hypothesis that older students are having a difficult time early in their academic careers. Ahlburg et al. (1997) found similarly robust
findings in their study of dropout using a national data-set.
5.7. Modeling competing risks: testing the robustness of the stopout model
The independent risks models presented above assumed first stopout and dropout were uncorrelated with graduation. If the single outcome being modeled (in this study first stopout or dropout) and graduation are not independent events, the likelihood separability no longer holds and the events must be jointly estimated. In this study we estimate a competing risks model that allows for the possibility of correlated risks. Allowing for corre-lated risks is an important contribution because it is unlikely that included regressors capture all the co-deter-minants of first stopout and graduation behavior.
The purpose of estimating a competing risks model of first stopout and graduation is to test whether the single risk stopout results presented above are sensitive to the model specification. It may be that the single risks sto-pout model is a misspecification because we are inad-equately controlling for the interdependence of stopout and graduation. The stopout estimates obtained from the preferred competing risks model (two mass point mixing distribution) are virtually identical to the estimates pro-duced by a single risks specification. Thus, using a single risks specification to estimate first stopout is appropriate for this particular sample.
6. Implications, limitations, and future research
The application of event history models to the study of student departure in part supports the findings of earlier studies but also identifies important differences. With respect to exit before completion of a degree, for example, the results presented above are generally con-sistent with those of other studies, but exhibit more time-profile detail. Substantive findings that emerge from the application of event history modeling to the study of student departure are that dynamic statistical models are a marked improvement over static models, that variables often thought to be time-invariant in fact have effects that vary over the course of a student’s academic career, that being able to control for factors that are unmeasured or unobserved makes the results of more robust, and that estimation of competing events may help researchers to understand the complex interdependencies between events that are typically modeled independently.
chances of graduating, especially in a timely manner. A number of policy changes have been made to provide students with information about graduation probabilities (i.e. Student-Right-to-Know and Campus Security Act). Institutions are increasingly concerned about gradu-ation rates given the focus on them by regulatory agenc-ies, their use in rankings used by college guide publi-cations, and the scrutiny given to these rates by the general public. In recent years, for instance, the Univer-sity of Minnesota has had the lowest four and five-year retention rates in the Big 10. In an attempt to improve these low rates the administration has implemented a new admission’s strategy. By the year 2000, the insti-tution would like to have 80% of their new high school entrants in the top quartile of their high school class. The administration believes this policy change will help to improve the five-year graduation rates of the 1996 entering class to 50% (up from about 29% for the 1986 cohort used in this study). We are now conducting simul-ations to examine if and how graduation probabilities change when factors used in admission’s decisions (ACT score and high school rank percentile) are varied. This type of information will provide administrators with more accurate information about the consequences of changes to established admission’s criteria.
The results of this study will also help inform adminis-trators about the effects that different types of financial aid have on student outcomes. Similar simulations are being developed to test how stopout and dropout hazards vary when financial aid packages are changed. Until now, there has been only one study conducted that exam-ined the role of financial aid on student retention and attrition at the study institution (Moline, 1987).
The federal government has also become increasingly concerned about graduation rates in institutions of higher education. In recent years the federal government has mandated that individual institutions provide information about their retention and graduation rates. They have also become increasingly interested in timely progression to graduation. Recently, the Clinton Administration floated a proposal to limit to six years the length of time in which full-time students can qualify for Pell Grants. Therefore, understanding the temporal dimensions of student departure and the factors that affect whether stu-dents succeed or fail, is becoming increasingly important.
Although an improvement in student departure research done to date, this study is limited in several ways. Since the research was conducted on a single insti-tution, the results may apply only to the study institution or be generalizable only to similar institutions. Also, studying only one entering class is deficient in that the results observed may be due to a “cohort effect”. How-ever, as mentioned above, other cohorts have been stud-ied (and the results are quite consistent) and more recent
entering cohorts are currently being analyzed to examine whether the results are robust.
Also, the likelihood of self-selection in financial aid makes it difficult to determine whether the typical stud-ent receiving an offer of financial aid has departure prob-abilities different from students who receive no aid offer. Using aid offered may mitigate some of the self-selection and is certainly an improvement over using financial aid
awarded (as many other studies have done). Optimally,
if we knew whether a student applied for aid, a self-selection corrections could be done. However, at the time of data collection no information was available on aid applicants at the study institution. We are now able to determine whether a student applied for aid or not, there-fore we will be able to do a selection correction in the future.
Finally, the statistical knowledge and computing resources needed to estimate these complicated models would make it difficult for the average researcher to rep-licate this study. However, remarkable increases in com-puting power, the inclusion of advanced event history techniques in standard statistical packages, and new books written to apply event history modeling to a var-iety of research problems (see Allison, 1995 or Vermunt, 1997) make this limitation less of a concern with each passing day.
The event history approach used herein can be extended in several ways. In one of the models esti-mated, time to first stopout is analyzed, which is cer-tainly a simplification of students’ academic careers. Stu-dents, in fact, may enter and leave at multiple points in time and for a multitude of reasons. Students who leave and return present an interesting case, and event history methods can be used to examine these “repeated events”. Though the single event results are interesting and use-ful, information obtained from a repeated events model would be even more informative to policy makers.
Second, a new competing risks model permitting a joint determination of dropout and graduation needs to be estimated. Once this basic competing risks model of dropout and graduation is understood, the full range of ways students exit institutions of higher education (through academic dismissal, voluntary exit, transfer, and graduation as suggested by Tinto, 1975) can be examined. By using this approach it is possible to ignore events that are of little interest, that do not occur often enough to make a difference (like being expelled from college because of misconduct), or for which we have no policy levers. Although competing risks models somewhat complicate the analysis, they offer a more pre-cise way of examining the academic careers of college students.
increased or decreased. This policy simulation will pro-vide decision-makers with better information about how the components of financial aid differentially affect time to graduation or departure. Since very little is understood about the effects of changes in the components of student financial aid on student persistence, and even less is known about the temporal effects of aid, any increase in our knowledge about these issues should be quite valu-able.
Acknowledgements
The authors are grateful for the generous resource grant provided by the Minnesota Supercomputer Insti-tute.
References
Ahlburg, D. A., McCall, B. P., & Na, I. (1997). A hazard model of college dropout with endogenous waiting time. Working paper, Industrial Relations Center, University of Minnesota. Allison, P. D. (1984). Event history analysis: regression for longitudinal event data. Sage University Papers: Quantitat-ive Applications in the Social Sciences, 07-046. Newbury Park, CA: Sage.
Allison, P. D. (1995). Survival analysis using the SAS system: a practical guide. SAS Institute Inc., Cary, NC.
Bean, J. P. (1978). Dropouts and turnover: the synthesis of a causal model of student attrition. Unpublished doctoral dis-sertation, University of Iowa.
Bean, J. P. (1980). Dropouts and turnover: the synthesis and test of a causal model of student attrition. Research in Higher Education, 12, 155–187.
Bean, J. P. (1981). The synthesis of a theoretical model of stud-ent attrition. Paper presstud-ented at the American Education Research Association’s annual meeting, Los Angeles. Bean, J. P. (1982). Student attrition, intentions, and confidence:
interaction effects in a path model. Research in Higher Edu-cation, 17, 291–319.
Bean, J. P. (1983). The application of a model of turnover in work organizations to the student attrition process. Review of Higher Education, 6, 129–148.
Blank, R. M. (1989). Analyzing the length of welfare spells. Journal of Public Economics, 39, 245–273.
Bowen, H. R. (1980). The costs of higher education. Jossey– Bass, San Francisco, CA.
Bowles, S. (1972). Schooling and inequality from generation to generation. Journal of Political Economy, 80, S219–S251. Cabrera, A. F., Nora, A., & Castaneda, M. B. (1993). College
persistence: structural equations modeling test of an inte-grated model of student retention. Journal of Higher Edu-cation, 64(2), 123–139.
Chizmar, J., & Cummins, W. (1994). Discrete-time survival analysis of the role of gender in persistence in the econom-ics major. Paper presented at the 34th Annual Forum of the Association for Institutional Researchers, New Orleans, LA. Cox, D. R. (1972). Regression models and life-tables (with discussion). Journal of the Royal Statistical Society B 34.
DesJardins, S. L. (1993). Using hazard models to study student careers. Paper presented at the 33rd Annual Forum of the Association for Institutional Researchers, Chicago, IL. DesJardins, S. L. (1996). Using event history methods to model
the different modes of student departure from college. Paper presented at the 37th Annual Forum of the Association for Institutional Researchers, Orlando, FL.
DesJardins, S. L., Ahlburg, D. A., & McCall, B. P. (1994). Studying the determinants of student stopout: identifying “true” from spurious time-varying effects. Paper presented at the 34th Annual Forum of the Association for Institutional Researchers, New Orleans, LA.
DesJardins, S. L., & Pontiff, H. J. (1996). Tracking University of Minnesota Twin-Cities ‘dropouts’. Paper presented at the 37th Annual Forum of the Association for Institutional Researchers, Orlando, FL.
Guerin, K. J. (1997). Tracking student stop-out, transfer and graduation: an event history analysis of competing risks. Paper presented at the 37th Annual Forum of the Associ-ation for Institutional Researchers, Lake Buena Vista, FL. Haan, N. (1975). Hypothetical and actual moral reasoning in a
situation of civil disobedience. Journal of Personality and Social Psychology, 10, 183–201.
Han, A., & Hausman, J. (1990). Flexible parametric estimation of duration and competing risk models. Journal of Applied Econometrics, 5, 1–28.
Heckman, J. J., & Singer, B. (1984). A method for minimizing the impact of distributional assumptions in econometric models for duration data. Econometrica, 52, 271–320. Johnston, J. (1984). Econometric methods. McGraw–Hill,
New York.
Kiefer, N., & Neumann, G. (1979). An empirical job search model, with a test of the constant reservation wage hypoth-esis. Journal of Political Economy, 87, 89–107.
Lancaster, T. (1990). The econometric analysis of transition data. Cambridge University Press, New York.
Matross, R. P., & DesJardins, S. L. (1994). 1994 Student reten-tion report summary and guide. Unpublished manuscript, University of Minnesota.
McCall, B. (1994). Testing the proportional hazards assumption in the presence of unmeasured heterogeneity. Journal of Applied Econometrics, 9, 321–334.
Meyer, B. (1986). Semi-parametric estimation of hazard mod-els. M.I.T. working paper.
Meyer, B. (1990). Unemployment insurance and unemployment spells. Econometrica, 58, 757–782.
Moline, A. E. (1987). The relationship of financial aid to stud-ent persistence in a commuter institution: a test of the causal model. Paper presented at the Fourth Annual NASSGP/NCHELP Research Conference on Student Finan-cial Aid Research, Washington University, St Louis, MO. Naughton, J. (1996). Experts cite trouble in comparing athletes’
graduation rates. The Chronicle of Higher Education A37, 12 July.
Ottinger, C. (1991). College going, persistence, and completion patterns in higher education: what do we know? American Council on Education, Division of Policy Analysis and Research, Research Briefs 2(3).