Nitrogen losses from entire plants of spring wheat (
Triticum
aesti
6
um
) from tillering to maturation
Evan Rroc¸o, Konrad Mengel *
Institute of Plant Nutrition,Justus-Liebig-Uni6ersity,Su¨danlage6,35390,Giessen,Germany Received 19 February 1999; received in revised form 26 July 1999; accepted 9 November 1999
Abstract
The release of nitrogen by roots of intact spring wheat plants into the soil and other losses, mainly of volatile N, have been investigated in two subsequent years from tillering until maturation, by use of a new technique for plant labelling with15N. Plants were at first labelled by growing them in a15N nutrient solution until tillering and then after
thoroughly washing the roots with distilled water, the entire plants were transplanted into pots filled with a silty loam.
15N release was analysed throughout the growth of the plants at 6 days after transplantation (tillering), ear emergence,
beginning of grain filling, and full maturation. At these stages15N was analysed in the plant and in the soil. Release
rates of labelled N into the soil were low in the period from tillering to ear emergence and increased progressively attaining maximum rates in the phase from ear emergence to grain filling. The non-accounted for losses of labelled N, mainly volatile losses, were also found to be highest from ear emergence to the beginning of grain filling. © 2000 Elsevier Science B.V. All rights reserved.
Keywords:Nitrogen; N release by roots; Wheat; N loss
www.elsevier.com/locate/eja
1. Introduction
As yet little is known in quantitative terms of the loss of nitrogen from entire plants at various stages throughout their growth. Different forms of N loss may be distinguished, such as N recy-cled by plant roots into the soil, N released by upper plant parts into the atmosphere, mainly as gases such as NH3 and NOx (Farquhar et al.,
1983), and the loss of N by the removal of plant parts as pollen, flowers, leaves and fruits (Wetse-laar and Farquhar, 1980). Nitrogen loss may also occur by leaching of N from upper plant parts, e.g. by rainfall. The quantitative evaluation of these losses is of fundamental importance in es-tablishing reliable N balance sheets. Nitrogen re-lease from plant roots into soil has been studied by various authors and losses have been found to range from 6 to 33% of the total plant N (Janzen, 1990; Lynch and Whipps, 1990; Janzen and Bru-insma, 1993; Reining et al., 1995; Toussaint et al., 1995). This wide variation in results may partly be accounted for by different experimental
condi-* Corresponding author. Tel.:+49-6403-62313; fax:+ 49-6403-62313.
E-mail address: [email protected] (K. Mengel).
tions but additionally it may originate from the different experimental techniques used.
In order to distinguish between the soil N and root borne N, plant N must be labelled and this is generally done using 15N. Reining et al. (1995)
used the ‘split-root-technique’ in order to label the plant N. This method allows the precise quantifi-cation of released N from the root part not in contact with the labelled soil N. This procedure, however, does not allow the quantitative determi-nation of labelled N released by the entire root system. Janzen and Bruinsma (1989) labelled their plants by the uptake of15
NH3 by the upper plant
parts. Unfortunately the amount of labelled N taken up is small and therefore it is difficult to quantify the release of labelled N by the roots over longer periods of time. Since the labelling methods used to date all have their shortcomings (Palta et al., 1991), we have developed a new technique for labelling entire plants with 15N
which is particularly suitable for measuring N losses from tillering until maturation. The princi-ple of our method is the labelling of seedlings in
15N nutrient solution prior to planting into pots
filled with soil.
The objective of our investigation was to quan-tify the labelled N released from intact wheat roots into the soil as well as other losses mainly into the atmosphere at distinct growth stages of the plants: tillering, ear emergence, beginning of grain filling, and maturation.
2. Materials and method
The experiments were carried out in 1997 and 1998. In the 1st year the plants were cultivated in
a semi-open glasshouse up to ear emergence and were then transferred into a growth chamber. In the 2nd year cultivation was in a growth chamber throughout the growth period. The light intensity was 180 mmol E m−2 s−1 in a 16-h photoperiod
with a 24°C day temperature and a 14°C night temperature. The relative air humidity ranged from 45 to 55%. Spring wheat seeds were soaked in a CaSO4 0.5-M solution for 24 h and then
allowed to germinate on filter paper over a 4-day period. The seedlings were then cultivated in a
15N nutrient solution with the following
composi-tion: 4 mM K2SO4, 2 mM MgSO4, 0.3 mM
NaH2PO4, 2 mM NH4NO3, 4 mM CaCl2, 2 mM
H3BO3, 0.1 mM CuSO4, 0.01 mM Na2MoO4, 0.2 mM MnSO4, 0.1 mM ZnSO4, 100 mM Fe as
FeEDTA. The NH4NO3was double labelled at 98
atom% excess. During the first days plants re-ceived 1/4 of the full concentration of the nutrient solution, then 1/2, and 8 days later the full con-centration. The seedlings were cultivated in the nutrient solution for 3 weeks, this time being required to attain a sufficient amount of 15N in
the plants. The plants were then removed from the nutrient solution and their roots were thor-oughly rinsed with distilled water in order to remove adhering 15N. After this the young plants
were transplanted into soil in cultivation pots. Plants were held in the pot with their basal root section at the level of the edge of the pot and then dry soil was carefully added so that all roots were in close contact with the soil. Each pot held three plants and received 900 g soil fertilised with 140 mg K and 56 mg P as K2HPO4, and 160 mg N as
NH4NO3. The soil was a silty loam derived from
loess whose characteristics are shown in Table 1.
Table 1
Characteristics of the soil used in the two experiments
Silt Clay
Since the plants had to grow for 3 weeks in nutrient solution and because of the high cost of
15N it was decided not to change the nutrient
solution and thus discard the 15N, but to add the
nitrogen to the nutrient solution according to its uptake by the plants.
It is known that nitrogen uptake by plants has an impact on the pH of the nutrient solution, ammonium uptake depressing the solution pH and nitrate uptake raising it (Mengel et al., 1983). According to this finding preferential utilisation of ammonium in the nutrient solution is associ-ated with a pH decrease and likewise that of nitrate is indicated by an increase in pH in the nutrient solution. In order to confirm this rela-tionship for our experimental set-up a preliminary experiment was carried out with 104 spring wheat seedlings which were set in a 20-l plastic container and cultivated in the nutrient solution described above with the exception that the nitrogen was not labelled with 15N. Cultivation lasted 22 days
and during this period, pH of the nutrient solu-tion was measured twice a day and the pH was adjusted to the initial pH level by adding KOH or H2SO4 0.1 M, respectively. At the same time
samples were taken from the nutrient solution to determine the ammonium and nitrate concentra-tions. The volume of nutrient solution was filled up twice a day to 20 l by adding distilled water.
The total N content in the plants (roots+
shoots) of the preliminary experiment was analysed by the Kjeldahl method and the NH4
+
and NO3−concentrations in nutrient solution were
also analysed by the Kjeldahl method using MgO for distillation and Devarda alloy for reduction of nitrate.
The15N release into the soil in the15N
experi-ments was analysed at tillering, ear emergence, beginning of grain filling and full maturation. At each development stage plants of two pots were harvested and analysed. In one pot shoots and roots were analysed separately for total N and
15
N after the soil was washed carefully from the roots. In the other pot roots+soil were taken together, ground and analysed for15N enrichment
and total N.15N of this pot
+the15N in the shoot
gave the total amount of 15N in the soil-plant
system. The 15N amounts released into the soil
were calculated according the following equation:
15N released in the soil =
[15N(soil
+roots)+15N shoots]
−[15N shoots+15N roots] (1)
Losses unaccounted for which could not be measured directly were calculated according to the second equation:
Unaccounted for losses=
{15N(soil+roots)+15N shoots} at tillering −{15
N(soil+roots)+15
N shoots}
at different growth stages (2) These losses include gaseous N losses and losses of plant material.
According to Handley and Raven (1992) en-zymes discriminate15N relative to14N which may
lead to difference ind15N of maximum 12‰. This
means that in an enzymic reaction the quantity of a 15N metabolite converted is 1% lower than
the same amount of a 14N analogue metabolite.
Assuming that 15N nitrate assimilation and
fur-ther conversions of the 15N metabolite would
comprise the reactions nitrate reduction, nitrite reduction, ammonium assimilation and polypep-tide synthesis (four reactions), the discrimination would be 4% and the data found would be 4%
lower than the real amount. In the case of ammo-nium assimilation the discrimination would be
2% since here the steps of nitrate and nitrite
reductions are not involved. This small difference has no major impact on our results and the conclusions drawn.
The washing of soil from roots was done very carefully in order to keep to a minimum the losses of plant material. This process was carried out using a very slight water flow, over a sieve system containing two sieves the first of 1 mm and the second of 0.15 mm. The separated root pieces, were collected in the two sieves and put together with the other roots. To quantify the possible losses of labelled N through root washing a finer sieve of 0.06 mm was tested for some pots for plants harvested at the beginning of grain filling and full maturation. This test showed that using the 0.06-mm sieve only 0.026 and 0.084 mg 15N
Fig. 1. Changes in the nutrient solution pH due to NH4+and NO3−uptake by wheat seedlings. Dotted lines show the pH correction by the addition of H2SO4 or KOH, respectively.
filling and full maturation, respectively. These small quantities, which may be accounted for by losses of root hairs, amount merely to 0.1 and
0.25% of the total 15
N in the plant+soil at the beginning of grain filling and full maturation, respectively.
In the mixed sample soil+roots (second pot)
60 mg dry matter was needed for 15N analysis.
For this purpose the total amount of soil+roots was dried and ground together. The mixed sample was than treated twice with a sample separator (Retsch) to obtain a representative subsample of
10 g for 15N analysis. To prove whether the
sample separation did influence the analytical re-sults, several subsamples taken from one soil+
root sample were analyzed for 15
N enrichment. The 15
N concentrations of these subsamples did not differ statistically from one another.
It was not possible to measure15N in the plants
at the date of transplantation because of the very high 15N enrichment values (over 80%), and
be-cause with the equipment used (Vario EL and N01-6) only a limited concentration of 15N in
plant dry matter can be measured. We therefore used the 15N in the plants+soil at tillering as a
control at which stage the 15N in the plant had
been diluted to 66%.
The total N and 15
N excess analysis were car-ried out using a Vario EL elementary analyser, connected with an N01-6 emission spectrometer (Fischer, Germany) at the Institute of Plant Nu-trition and Rhizosphere Research in ZALF, Mu¨ncheberg.
In the 1st year the experiment included eight, and the 2nd year, six biological replications. Statistical elaboration of the data was done using the t-test according to Ko¨hler et al. (1996) for measuring statistical differences between pairs and ANOVA, and t-test for the statistical differences between growth stages.
3. Results
3.1. Preliminary experiment in6estigating the
relationship between nutrient solution pH and the depletion of ammonium and nitrate in the nutrient solution
nitrate in the nutrient solution is shown in Fig. 1 for the three nutrient concentration levels applied: 1/4, 1/2 and full strength nutrient solution. In all three cases the concentration of ammonium de-clined and as soon as the ammonium concentration attained zero level a stronger decline of the nitrate concentration was found. From this pattern it is clear that ammonium was preferentially taken up by plants. Ammonium uptake was associated with a pH decrease, nitrate uptake in the later phase with a pH increase of the nutrient solution. Hence the pH increase indicated that the N in the nutrient solution was going to be depleted and new addition of 15
N in the form of ammonium nitrate was required.
3.2. 15N release into the soil and unaccounted for
losses
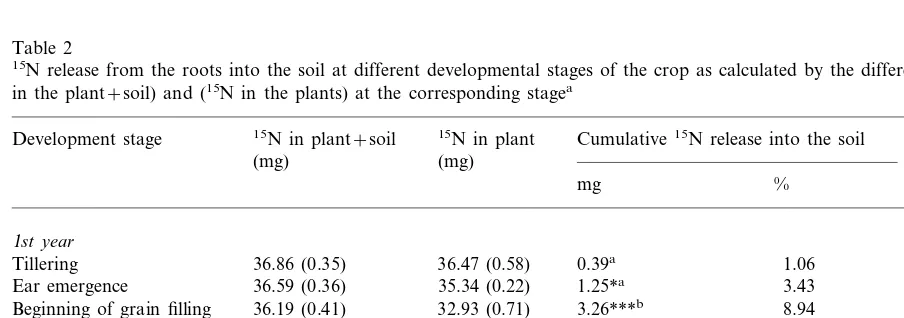
Table 2 shows the cumulative 15N amounts
released into the soil and losses measured indirectly by difference (Eq. (2)) for the 1st and 2nd years. The difference found at tillering between15N in the
plant and15N in the plant+soil was not
statisti-cally significant, while these differences at later
stages (ear emergence, beginning of grain filling, maturation) were significant indicating that 15N
had been released into the soil. 15N release rates
showed a maximum between ear emergence and the beginning of grain filling (Table 2) and were at this stage about three times higher than in the phase of maturation as found in both years. The cumulative amounts of 15N released into the soil
were 1.06 and 1.89% at tillering, 3.43 and 4.36% at ear emergence, 8.94 and 7.71% at grain filling, and 13.00 and 11.03% at maturation for the 1st and 2nd year, respectively (Table 2). These percentage val-ues relate to the 15
N present in plant+soil at tillering (=100%). The cumulative amounts of15
N released at the beginning of grain filling and at maturation were significantly higher than the amounts released at the earlier stages (Table 2).
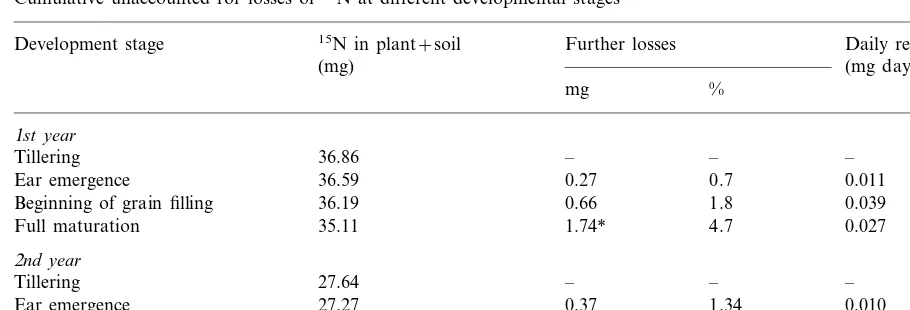
Both years gave practically the same qualitative results. 15N losses other than those released from
roots into the soil (indirectly measured) are shown in Table 3. These were only 1/3 of the 15N
released into the soil by the roots. Similarly to the losses via the roots, highest release rates for the unaccounted losses were found between ear emer-gence and the beginning of grain filling.
Table 2
15N release from the roots into the soil at different developmental stages of the crop as calculated by the difference between (15N in the plant+soil) and (15N in the plants) at the corresponding stagea
Release rate 15N in plant
15N in plant+soil
Development stage Cumulative15N release into the soil
(mg) (mg day−1)
(mg)
% mg
1st year
0.39a 1.06
Tillering 36.86 (0.35) 36.47 (0.58) 35.34 (0.22)
36.59 (0.36) 1.25*a 3.43 0.045
Ear emergence
3.26***b 8.94 0.241
Beginning of grain filling 36.19 (0.41) 32.93 (0.71) 35.11 (0.38) 30.35 (0.51)
Full maturation 4.76***b 13.00 0.064
2nd year
Tillering 27.64 (0.15) 27.12 (0.27) 0.52a 1.89
27.27 (0.46) 26.07 (0.18)
Ear emergence 1.21*a 4.36 0.020
26.87 (0.31) 2.13***b
Beginning of grain filling 24.74 (0.21) 7.71 0.077
23.61 (0.76) 26.66 (0.29)
Full maturation 3.05***b 11.03 0.027
a% release, proportion of 15N in (plant+soil) and at tillering. Standard errors are shown in brackets. Significant differences between15N release at various stages are indicated by letters; different letters meaning a significant difference.
*PB0.05, significantly different between (15N in plant+soil) and (15N in plant).
Table 3
Cumulative unaccounted for losses of15N at different developmental stages
Daily release Development stage 15N in plant+soil Further losses
(mg day−1)
Ear emergence 0.27 0.7 0.011
0.66 1.8
Beginning of grain filling 36.19 0.039
1.74* 4.7
Beginning of grain filling 0.77 2.79 0.033
Full maturation 26.66 0.99* 3.58 0.007
* Indicates significances atP=0.05 between the15N amount in (plant+soil at tillering) and the15N amounts in the (plant+soil at the respective development stages).
These unaccounted losses may result from gaseous losses (NH3, NO2) or losses of plant
material. Under our experimental conditions losses of plant material could only have occurred by dropping of anthers. At flowering, anthers were therefore collected in both years and analysed for total N and 15
N enrichment. It was found that the anthers contained 1 and 0.8% of
the total15N in the soil-plant system at the
begin-ning of the experiment for the 1st and the 2nd year, respectively.
15N enrichment shown in Table 4 considerably
decreased from tillering to ear emergence in shoots and roots, and then remained at almost the same level until maturation. This decrease in 15N
was due to the uptake of14N from the soil which
occurred practically from tillering until ear emer-gence. Thereafter practically no net uptake of nitrogen was found as shown in Table 5.
This finding is in line with results of other authors who also found that most plant species need a lot of nitrogen during the vegetative phase while in the reproductive phase nitrogen uptake by roots is low and retranslocation of organic nitrogen in the plant plays an important role (Imsande and Touraine 1994). At tillering roots had a lower level of 15N enrichment than shoots
which shows that at this stage the 15N of roots
was more diluted than shoots by newly taken up
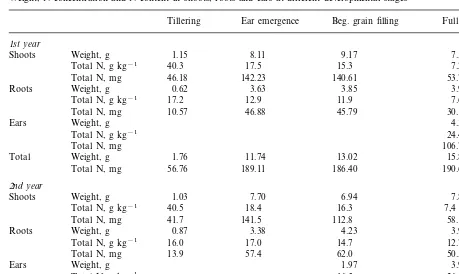
14N from the soil. Table 5 shows the dry weight,
the N concentrations, and the N content of shoots and roots at the four growth stages as well as comparative values for the ears at maturation. At ear emergence no further dry matter production of shoots occurred. The same is also true for the total N uptake (14
N+15
N) of the plants. Table 6 shows the amounts of 15
N present in the plant organs at the various growth stages.
Table 4
15N enrichment in atom% excess in different plant organs during the different developmental stages
Development stages Shoots Roots Ear
1st year
66.86 49.87*** Tillering
18.55
Ear emergence 17.52
Beginning of grain filling 18.70 16.64
14.67***
Beginning of grain filling 12.52 11.91 Full maturation 12.82 12.18 10.76
***PB0.001, significant difference between shoots and
Table 5
Weight, N concentration and N content in shoots, roots and ears at different developmental stages
Tillering Ear emergence Beg. grain filling Full maturation
1st year
Shoots Weight, g 1.15 8.11 9.17 7.53
Total N, g kg−1 40.3 17.5 15.3 7.2
46.18 142.23
Total N, mg 140.61 53.78
Weight, g
Roots 0.62 3.63 3.85 3.97
Total N, g kg−1 17.2 12.9 11.9 7.6
10.57 46.88
Total N, mg 45.79 30.19
Weight, g
Ears 4.38
Total N, g kg−1 24.4
Total N, mg 106.72
Weight, g
Total 1.76 11.74 13.02 15.88
56.76 189.11 186.40
Total N, mg 190.69
2nd year
1.03 7.70
Weight, g 6.94
Shoots 7.88
Total N, g kg−1 40.5 18.4 16.3 7,4
Total N, mg 41.7 141.5 112.8 58.1
0.87 3.38
Weight, g 4.23
Roots 3.98
Total N, g kg−1 16.0 17.0 14.7 12.7
13.9 57.4
Total N, mg 62.0 50.5
Weight, g
Ears 1.97 3.97
16.5
Total N, g kg−1 26.6
Total N, mg 32.6 105.5
Weight, g
Total 1.89 11.09 13.14 15.83
55.6 198.9 207.4 214.1
Total N, mg
This shows clearly that in the stage of ear emer-gence and at the beginning of grain filling the15N
amounts in roots were increased, and that from the beginning of grain filling to full maturation the highest proportion of labelled N was present in the ears.
4. Discussion
The investigation has shown that from tillering until maturation wheat plants release a substantial amount of nitrogen from their roots which is taken up during the early growth stage. The
Table 6
15N amounts in mg per three plants (pot) different plant organs from tillering until full maturation
Beginning of grain filling
Ear emergence Full maturation
Tillering Development stages
1st year
31.5
Shoots 27.1 25.3 10.3
5.3
Roots 8.2 7.6 4.5
15.6 Ear
30.4
36.5 32.9
Total 35.3
2nd year
13.18
Shoots 22.12 17.88 7.20
8.22
Roots 5.00 7.74 6.23
Ears 3.87 10.36
amount released by roots by maturation was ap-proximately the same in both years, namely 13% in the 1st and 11% in the 2nd year of the total15N
taken up (Table 2).
The young plants received almost 1 mg 14N
from their seeds and at transplanting they con-tained 13 mg N plant−1for the 1st and 10 mg
N plant−1for the 2nd year, so that the difference
of 12 and 9 mg N, respectively, originated from the 98 atom% 15N nutrient solution. From the
beginning of plant cultivation in soil, the plants also took up 14
N which diluted the 15
N in the plant as evidenced by the decrease of the 15
N atom excess as shown in Table 4. Even as early as the tillering stage, the15N atom excess was much
lower than that of the labelled N fertilizer with 98 atom%. Presumably at tillering the decrease of the
15N atom% excess (dilution of the 15N) originated
not only from the nitrogen present in the seeds but also from the fertilizer N even though at this first stage of sampling (tillering) the plants had been grown for only 6 days in the soil.
The 15N dilution continued further between
tillering and ear emergence (Table 4) resulting from the high 14
N uptake rates from the soil during this period (Table 5). After ear emergence,
15
N dilution (roots) was very low in the 1st year and almost non-existent in the 2nd because of virtually no uptake of 14N by the plants during
this period. Interestingly, with only one exception (1st year, full maturation), with the beginning of ear emergence the15N enrichments did not differ
significantly between shoots and roots (Table 4). Since the root is the plant organ that contributes to the N release into the soil, from this uniformity one may suppose that the total N released from the roots into the soil had the same15N/14N ratio
as in the shoots. Based on this assumption the15N
values should be representative of the total N released from the roots into the soil. This is also confirmed if one calculates the total N release (14N
+15N) for the period from ear emergence to
full maturation which gives 10.4 and 6.76% of the total N uptake for the 1st and 2nd year, respec-tively. The corresponding figures for the 15N
re-lease of total 15N taken up by the plants are
9.62% (1st year) and 6.67% (2nd year) and demonstrate that the proportions of15N and total
N (14N
+15N) released by the roots from ear
emergence until full maturation are practically identical.
It is suggested that a high proportion of 15N
was incorporated into the leaves of the young plants as shown in Table 6. These younger leaves at tillering become the older leaves in the follow-ing development stages. A major proportion of older leaf proteins is hydrolyzed shortly before anthesis until 2 weeks after anthesis and according to Stoy (1972) (quoted by Mengel and Kirkby, 1987 p. 256) the N is mainly translocated to the roots as amino acids via phloem transport. Some of these amino acids are released from the root phloem and not used in root metabolism (Kosegarten and Mengel, 1998) and may diffuse through the root apoplast into the rhizosphere where they are quickly metabolized by soil mi-croorganisms. According to Matzke (1988) such release of amino acids particularly occurs under conditions of energy stress.
Interestingly, the highest release rates of nitro-gen release by roots were obtained from ear emer-gence until the beginning of grain filling (Table 2). At this stage wheat attains its highest LAI and hence a high photosynthetic activity prevails asso-ciated with the synthesis of amino acids. From ear emergence until the beginning of grain filling, root growth still occurs and a minor portion of amino acids translocated from shoots to roots may be released into the soil.
Later during the main period of grain filling, root N also contributes to grain filling as is evi-denced by the depletion of root N during matura-tion (Table 5), and reported previously by Koch and Mengel (1977) for spring wheat. This demand of root N for grain filling is presumably the reason why the 15N release rates were low during
maturation (Table 2). The low rates of release of
15
ex-change of 15N ammonium or nitrate released by
the roots with 14N homologues in the soil. Had
such an isotopic exchange occurred it would have resulted in a decrease of the 15N excess from ear
emergence until maturation, which was not the case (Table 4).
Our investigation has shown that the labelled N was almost homogeneously distributed in the plant (Table 4) and for this reason the percent of labelled N released into the soil may be used to calculate the total N released by the roots into the soil. The amount of total N (14
N+15
N) released was 13% (1st year) and 11% (2nd year) of the total N uptake of the plants. The percentage release mediated by roots of12% of the total N
uptake (14N
+15N) seems to be a realistic figure
and also representative of wheat stands in the field. This means that a wheat crop with a grain yield of 8 Mg (megagram) taking up 240 kg N
ha−1 would release 29 kg N into the soil by
roots over the growing period. This is in the range of N which is found frequently in the soil profile after the harvest of the wheat crop if nitrogen fertilization is adjusted to the available soil nitro-gen and the demand of the crop (Baumga¨rtel et al., 1989).
Interestingly, the highest rates of unaccounted losses (losses not via the roots) appeared from ear emergence until the beginning of grain filling. Anthers contained 1% of the15N present in the
(plant+soil) at the beginning of the experiment which means a substantial proportion of the un-accounted for loss was due to the loss of anthers. The rest is supposed to be lost mainly in gaseous form (Farquhar et al., 1983). During the period from ear emergence until grain filling, high photo-synthetic rates occur which in C3 crops such as
wheat are associated with high rates of photores-piration (Geiger and Servaites, 1994) with the production of NH3, some of which may be
re-leased into the atmosphere. It should be borne in mind, however, that 15NH
3 released into the leaf
apoplast may be subject to isotopic exchange with the 14NH
3 already present in the atmosphere
(Schjørring, 1997). Such an isotopic exchange will mimic a loss of nitrogen which actually is no loss. Considering this isotopic effect and the loss of anthers, presumably the gaseous nitrogen losses
were less than 3% of total nitrogen uptake of the wheat. This assumption is in agreement with the findings of O’Deen and Porter (1986) and O’Deen (1989) who report NH3-N losses from wheat
plants in the atmosphere of 3 – 4% of the total
plant N.
Acknowledgements
The authors are much indebted to the Deutsche Forschungsgemeinschat for financial support. They express their thanks to Professor Merbach, University of Halle and Miss Remus at the Insti-tute of Plant Nutrition and Rhizosphere Research in ZALF, Mu¨ncheberg for their support in 15N
analyses and to E.A. Kirkby, University of Leeds, for his valuable assistance in preparing the En-glish text.
References
Baumga¨rtel, G., Engels, T., Kuhlman, H., 1989. Wie kann man die ordnungsgema¨ße N-Du¨ngung u¨berpru¨fen? DLG-Mitteilung 9, 474 – 484.
Farquhar, G.D., Wetselaar, R., Weir, B., 1983. Gaseous nitro-gen losses from plants. In: Freney, J.R., Simpson, J.R. (Eds.), Gaseous Loss of Nitrogen from Plant-Soil System. Martinus Nijhof, The Hague, pp. 159 – 180.
Geiger, D.R., Servaites, J.C., 1994. Diurnal regulation of photosynthetic carbon metabolism in C3 plants. Annu. Rev. Plant Physiol. Plant Mol. Biol. 45, 235 – 256. Handley, L.L., Raven, J.A., 1992. The use of natural
abun-dance of nitrogen isotopes in plant physiology and ecology. Plant Cell Environ. 15, 965 – 985.
Imsande, L., Touraine, B.N., 1994. N demand and regulation of nitrate uptake. Plant Physiol. 105, 3 – 7.
Janzen, H.H., 1990. Deposition of nitrogen into rhizosphere by wheat roots. Soil Biol. Biochem. 22, 1155 – 1160. Janzen, H.H., Bruinsma, Y., 1989. Methodology for the
quan-tification of root and rhizosphere nitrogen dynamics by exposure of shoots of 15N-labelled ammonia. Soil Biol. Biochem. 21, 189 – 196.
Janzen, H.H., Bruinsma, Y., 1993. Rhizosphere N-deposition by wheat under varied water stress. Soil Biol. Biochem. 25, 631 – 632.
Koch, K., Mengel, K., 1977. The effect of K on N utilization by spring wheat during grain formation. Agron. J. 69, 477 – 480.
Kosegarten, H., Mengel, K., 1998. Starch depositions in stor-age organs and the importance of nutrients and external factors. Z. Pflanzenerna¨hr. Bodenkd. 161, 273 – 287. Lynch, J.M., Whipps, L.M., 1990. Substrate flow in the
rhizo-sphere. Plant Soil 129, 1 – 10.
Matzke, H., 1988. Anionenabscheidung der Wurzel bei symbi-otisch erna¨hrtem Trifolium pratense. Ph.D. thesis, Justus Liebig University, Giessen, Germany.
McIntyre, G.I., 1997. The role of nitrate in the osmotic and nutritional control of plant development. Aust. J. Plant Physiol. 24, 103 – 118.
Mengel, K., Kirkby, E.A., 1987. Principles of Plant Nutrition. International Potash Institute, Berne, Switzerland. Mengel, K., Robin, P., Salsac, L., 1983. Nitrate reductase
activity in shoots and roots of maize seedlings as affected by the form of nitrogen nutrition and the pH of the nutrient solution. Plant Physiol. 71, 618 – 622.
Palta, J.A., Fillery, I.R., Mathews, E.L., Turner, N.C., 1991. Leaf feeding of [15N]urea for labelling wheat with nitrogen. Aust. J. Plant Physiol. 18, 627 – 636.
Oaks, A., 1994. Primary nitrogen assimilation in higher plants and its regulation. Can. J. Bot. 72, 739 – 750.
O’Deen, W.A., 1989. Wheat volatilized ammonia and resulting nitrogen isotopic fractionation. Agr. J. 81, 980 – 985. O’Deen, W.A., Porter, L.K., 1986. Continuous flow system for
collecting volatile ammonia and amines from scenescing winter wheat. Agron. J. 78, 746 – 749.
Reining, E., Merbach, W., Knof, G., 1995.15N distribution in wheat and chemical fractionation of root borne15N in the soil. Isot. Environ. Health Stud. 31, 345 – 349.
Schjørring, J.K., 1997. Plant-atmosphere ammonia ex-change. Quantification, physiological regulation and inter-actions with environmental factors. D.Sc. degree, pp. 21 – 23.
Toussaint, V., Merbach, W., Reining, E., 1995. Deposition of 15N into soil layers of different proximity to roots by wheat plants. Isot. Environ. Health Stud. 31, 351 – 355. Wetselaar, R., Farquhar, G.D., 1980. Nitrogen losses from
tops of plants. Adv. Agron. 33, 263 – 302.