Vol. 42 (2000) 43–74
Privatization and efficiency: differentiating ownership
effects from political, organizational, and dynamic effects
Belén Villalonga
∗ University of California, Los Angeles, USAReceived 12 October 1998; received in revised form 25 February 1999; accepted 11 March 1999
Abstract
This paper argues that the private-public ownership factor should be differentiated from other
factors that also influence the effect of privatization on efficiency. This is empirically confirmed in
a longitudinal study of 24 Spanish firms, for which several political and organizational factors are
found to influence the estimated effects of privatization on efficiency. The analysis of the timing
of the effects reveals a strong significance for post-privatization years 5–6 (negative), and 7–8
(positive). This suggests that the negative effect of these factors is transitional, being eventually
offset by the positive effects of the change to private ownership. ©2000 Elsevier Science B.V. All
rights reserved.
JEL classification: L33
Keywords: Privatization; Efficiency; Organizational; Change; Panel data
1. Introduction
One of the most significant economic phenomena of recent years has been the privatization
of state-owned enterprises all over the world. According to Megginson and Netter (1997),
the amount raised by all governments during the last two decades, considering only public
offers, is over $400 billion, a figure that would be considerably surpassed if direct sales
were also taken into account.
1While there are several possible reasons why privatization
may be undertaken (Yarrow, 1986), the main driver of this trend has been the search for an
increase in the efficiency of the firms involved (Megginson et al., 1994).
∗Present address: Anderson Graduate School of Management, 110 Westwood Plaza, Box 951481, Los Angeles, CA 90095-1481, USA.
E-mail address: [email protected] (B. Villalonga).
1According to the World Bank, over 2000 firms were privatized during the period 1980–1993 (almost half
between 1991 and 1993), less than 5 percent of which involved public share offerings.
Whether privatization actually leads to that improvement in efficiency has been the subject
of what appears to be a considerable amount of research, both theoretical and empirical.
Most of this research, however, has actually been concerned with whether private ownership
leads to a higher efficiency than state ownership, which is only part of the former question. As
a consequence, empirical results do not always support the theoretical predictions. Several
factors, independent of the private-public distinction, also intervene in the relationship
between privatization on efficiency. Moreover, some of them do so in a dynamic way, thus
affecting the timing of privatization effects. Therefore, they need to be controlled for, not
only in empirical research, but also in a complete theory of privatization.
This paper addresses such need in two ways. First, by discussing the different factors
that affect the privatization-efficiency relationship, which are grouped into political,
orga-nizational, and dynamic factors. The latter reflect the transition and evolution inherent to
any privatization process which are ignored, however, in studies about public-private
own-ership. Second, by empirically testing for the presence of all these factors in a longitudinal
study using a sample of 24 Spanish firms which were privatized between 1985 and 1993.
While the superior efficiency of private (versus state-owned) firms in Spain has been
con-firmed in a number of cross-sectional studies, this is the first time the effects of privatization
processes are analysed in this country. It is also the first time the privatization-efficiency
relationship is examined in a representative sample of firms from a Western country other
than the UK,
2and one of the few statistical analyses of privatization effects that have been
done, as the empirical literature review will show. More importantly, this study is the first
to pay attention to the political, organizational, and transitional effects of privatization on
efficiency.
Section 2 reviews what has been said in theoretical and empirical research about the effect
of privatization on efficiency. Section 3 discusses what is missing from this literature, namely
the political, organizational, and dynamic implications of privatization that may affect firm
efficiency, and states the hypotheses. Section 4 describes the methods and results of the
empirical study, and Section 5 discusses its findings, limitations and implications.
2. Background
Privatization can be defined in a strict sense as the sale of a state-owned firm to the
private sector.
3Many theoretical and empirical articles have examined the differences
between state-owned and private firms and what these differences imply for firm efficiency.
2.1. Theoretical approaches
Three distinct streams of thought have dealt with the public-private firm comparison:
(1) Agency/Property Rights Theory; (2) Public Choice; and (3) organization theories. The
2Barberis et al. (1996) have tested it for Russia, and Dyck (1997) for Eastern Germany. This paper will not consider
those studies or any other about privatization in Eastern countries, given the peculiarities these economies entail.
3Note that this definition of privatization, which is the most widespread, does not include the possible changes
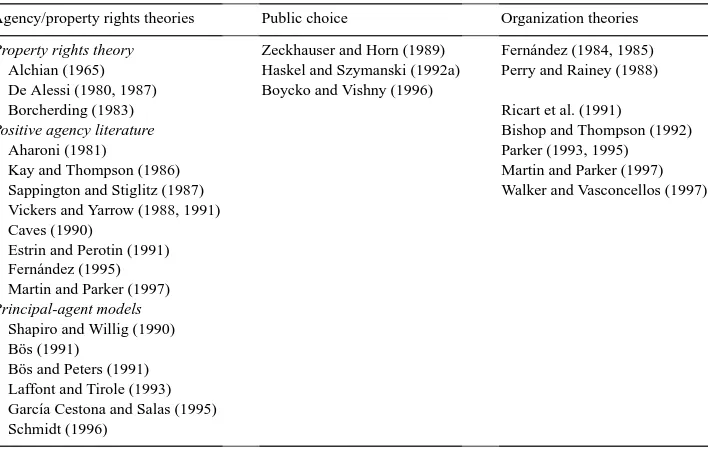
Table 1
Theoretical studies of public versus private ownership and/or privatization
Agency/property rights theories Public choice Organization theories Property rights theory Zeckhauser and Horn (1989) Fern´andez (1984, 1985)
Alchian (1965) Haskel and Szymanski (1992a) Perry and Rainey (1988) De Alessi (1980, 1987) Boycko and Vishny (1996)
Borcherding (1983) Ricart et al. (1991)
Positive agency literature Bishop and Thompson (1992)
Aharoni (1981) Parker (1993, 1995)
Kay and Thompson (1986) Martin and Parker (1997)
Sappington and Stiglitz (1987) Walker and Vasconcellos (1997)
Vickers and Yarrow (1988, 1991) Caves (1990)
Estrin and Perotin (1991) Fern´andez (1995) Martin and Parker (1997) Principal-agent models
Shapiro and Willig (1990) Bös (1991)
Bös and Peters (1991) Laffont and Tirole (1993) Garc´ıa Cestona and Salas (1995) Schmidt (1996)
specific theoretical studies within each of these streams are listed chronologically in Table 1.
The table also incorporates Jensen’s (1983) generic distinction between ‘the two agency
literatures’ (positive agency theory versus principal-agent models), both of which have
been represented in the public-private context. Essentially, each stream provides a different
explanation for a common outcome: private firms are more efficient than state-owned.
The Agency Theory explanation is based on the different agency problems and availability
of solutions to them that are associated with each form of ownership. Managers (the agent)
in both types of firms are assumed to seek the maximization of their own utility rather
than that of the organization or its owners (the principal). In private firms, this divergence
is reduced through the existence of: (1) a market for ownership rights which enables the
owners to sell if they are not satisfied with managerial performance — this is the focus
of Property Rights Theory; (2) the threat of takeover; (3) the threat of bankruptcy; and
(4) a managerial labor market. In the case of state-owned firms, not only are all of these
mechanisms absent,
4but also, the owner-manager relationship is broken down into two
other agency relationships: owner (the public)-politician, and politician-manager.
The Public Choice school’s central argument is that politicians pursue their own utility
rather than the public interest. Accordingly, they impose on state-owned firms goals that
can lead them to gain votes but can conflict with efficiency. For the general public, who
are the ultimate owners of the firm, the costs of monitoring this public sector behavior (e.g.
4The fourth mechanism, the managerial labor market, may not be exactly absent. More typically, there are two
information gathering, lobbying) are likely to offset the benefits (e.g. less taxes, or more
efficient public spending). This is not the case, however, for interest groups such as trade
unions, which makes state-owned enterprises an easy target for rent-seeking activity.
Organizational theories about this topic draw heavily from the other two approaches, but
focus on the organizational characteristics of private firms that are different in state-owned
firms, such as incentives and control mechanisms (Ricart et al., 1991); culture (Bishop and
Thompson, 1992); objectives, organization structure, communications/reporting systems,
nature and location of the business, management, and labor (Parker, 1993, 1995; Martin
and Parker, 1997).
2.2. Empirical approaches
The empirical literature can be classified into two groups: cross sectional studies of
public-private ownership effects, and longitudinal studies of privatization effects.
2.2.1. Cross-sectional studies of public-private ownership effects
Nearly all of the empirical research comparing the efficiency of state-owned and private
firms has been in the form of cross-sectional comparisons of both types of firms in industries
in which they coexist.
5The most rigorous method that has been used for this consists on
calculating the relative inefficiency of firms of both types with respect to an estimated profit,
cost, or production frontier. Pestieau and Tulkens (1993) have argued for the superiority of
this approach to efficiency measurement. They have also reviewed most of its applications
in the private versus public context. Table 2(a) includes all the studies they cite, as well as
others.
Cross-sectional studies of ownership using more traditional methods (regression) are
listed in Table 2(b). Cross-industry comparisons of public and private sectors are also
included in this table, within the ‘various’ industry category. Since most of these studies have
already been included in one or more empirical reviews, and these reviews are frequently
cited in the theoretical literature, the table indicates, for each of the studies, the review(s)
in which they appear.
As Table 2(a) and (b) shows, although a simple count of results would give a considerable
edge to private ownership (adding up in both tables there are 104 in favor, 14 against
and 35 neutral), the cumulative evidence is not wholly conclusive. Two factors play a
significant role in explaining the diversity of results within these tables: the market structure
of each of the industries (and countries) to which the firms studied belong, and the way
their efficiency is measured. With respect to market structure, as Vickers and Yarrow note,
“statistical tests have rarely been sophisticated enough to take account of the interacting
(non-separable) effects of ownership, competition and regulation on incentive structures,
and hence on the performance of firms” (1988, p. 39). As for efficiency measurement,
one thing to be noted first is that many different concepts of efficiency are relevant in this
context: productive and allocative, static and dynamic
. . .
(see Martin and Parker, 1997: pp.
47–53; Walker and Vasconcellos, 1997: pp. 27–29). Second, three different measures —
5All of the articles included in Table 2a and b, except Boussofiane et al. (1997) and Ehrlich et al. (1994), which
profitability, productivity, and costs can be and have been used in these studies, and the
appropriateness of using one or another is highly dependent on market structure (Cuervo
and Peres, 1981; Borins and Boothman, 1985: pp. 100–104; Cuervo, 1995c: pp. 37–38).
Still, after accounting for these two factors, the evidence about which form of ownership is
associated with a higher level of efficiency remains mixed.
In fact, the authors of the various review articles mentioned offer very different
conclu-sions, depending on the studies selected.
6For instance, Borcherding et al. report that “the
findings in most studies are consistent with the notion that public firms have higher unit
cost structures” (1982, p. 134). In contrast, Millward finds “no broad support for private
enterprise superiority” (1982, p. 83). Fifteen years later, during which many more empirical
studies of public-private ownership have been published, Martin and Parker still conclude
from their survey that “on balance it seems that neither private nor public sector production
is inherently or necessarily more efficient” (their emphasis; 1997, p. 93).
2.2.2. Longitudinal studies of privatization effects
The availability and variety of studies in this category sharply contrast with the previous
one. Many summaries of different countries’ privatization programs have been written, but
almost always of a qualitative nature. In fact, so far there has only been one country for
which quantitative studies of privatization are available: the UK (see Martin and Parker, pp.
85–86, for a review). Of these, only five studies have dealt with a sample size large enough
to allow some kind of statistical analysis: Haskel and Szymanski (1992b), Boussofiane et
al. (1997), and Cragg and Dyck (1997a, b, 1998) the last three based on the same data base.
Two cross-country studies are also of a statistical nature: Megginson et al. (1994) and Nash
et al. (1997). Other than this, the only empirical evidence regarding privatization comes
from case studies such as those included in Galal et al. (1994), Vickers and Yarrow (1988),
Ramamurti (1996), Martin and Parker, or Walker and Vasconcellos (1997).
As in the cross-sectional studies of public-private ownership, the evidence from
lon-gitudinal studies about whether privatization leads to an efficiency increase is not totally
conclusive.
3. Political, organizational and dynamic implications of privatization
The previous literature review shows that the positive effects of privatization on efficiency
predicted by the different theories are not always supported by the existing empirical
evi-dence. Why is there such a mismatch between theory and evidence?
The answer proposed here is that the existing privatization literature has only looked at
part of the problem, which is whether private ownership leads to a higher efficiency than
6While a proper meta-analysis is beyond the scope of this paper, Table 2 can give some hints on: (1) how
state ownership. Privatization implies a change in a firm’s ownership, from state to
pri-vate. Hence, the superiority of private to public ownership in terms of firm efficiency is a
necessary condition for the existence of a positive relationship between privatization and
efficiency. However, the condition is not sufficient, for two reasons. First, public versus
private ownership is primarily a static question, which can be typically addressed by
com-paring both types of firm in a given period of time, as the above classification of empirical
research has highlighted.
7However, privatization is by definition a change, and needs to
be addressed dynamically by looking at a given firm’s evolution and transition between its
private and public stages within a given firm.
8Second, privatization has other implications,
political and organizational, that are likely to affect the firm’s efficiency, either positively
or negatively, and therefore, reinforce or counteract the effect of the change in ownership
per se.
All these other implications of privatization, however, have been overlooked by previous
researchers, even within the organizational stream. In fact, among all the theoretical
priva-tization studies listed in Table 1, there are only two exceptions to this oversight: Boycko
and Vishny (1996), for whom the effect of privatization on efficiency hinges on the firm’s
restructuring which for them means strictly reducing employment, and Martin and Parker,
who argue: “
. . .
in so far as ownership and competition are important, they impact on
per-formance through an internal adjustment process” (their emphasis, p. 170).
9Moreover,
my classification of the empirical research, by separating out ownership (cross-sectional)
studies from privatization (longitudinal) studies, shows that the evidence regarding the
re-lationship between privatization and efficiency is actually much more scarce than what has
been implied by (1) previous empirical reviews of this relationship (e.g. Yarrow, 1986); and
(2) previous theoretical works about privatization claiming support for their theories (e.g.
Bös, 1991).
The basic prediction of all existing privatization theories is the following:
Hypothesis 1. Privatization increases firm efficiency.
How, exactly, is this prediction affected by the political, organizational, and dynamic
factors mentioned?
3.1. Political and organizational implications of privatization
Political implications of privatization are all the government decisions triggered by the
decision to privatise a given firm.
10These may affect the firm’s efficiency either positively
or negatively. A positive effect will take place if, for instance, the government chooses to
7Of 153 studies of the public-private distinction, 151 are cross-sectional and only two are longitudinal. 8Obviously, all the empirical privatization studies cited are longitudinal.
9The former points to what we call an organizational implication of privatization, the latter to a transitional
implication.
10Decisions about competition or regulation that frequently accompany the privatization decision but are not
privatize a firm from an industry that will rapidly grow, in order to make privatization look
good. On the other hand, negative effects are typically a consequence of giving priority
to privatization goals other than efficiency, when the choice between those goals and that
of efficiency involves a trade-off. Such would be the case, for instance, of privatizing a
monopoly before introducing competition or an appropriate regulation, as opposed to
afterwards, in order to increase the revenue from privatization (Vickers and Yarrow, 1988);
or of hastening to privatize the firm in a period of recession in the industry or in all of the
economy, as opposed to waiting for a better time, because the government wants to increase
its revenues in that period for political reasons. There is also the possibility of unintended
negative effects, such as a government’s mistake or failure in choosing the optimal buyer
or privatization method.
Organizational implications of privatization are all the decisions taken by the new owners
or managers of the privatized firm that cannot be predicted by the government at the time
of choosing who to sell the firm to. Again, these can affect the firm’s efficiency either
positively or negatively. As an example of a positive effect, consider a firm which, under
state ownership, is being managed through a large conglomerate, and is privatized through
its direct sale to a more specialized company. If the buyer is able to exploit some synergies
with its former business, and part of the savings are passed on to its acquired (the privatized)
firm, the gains in efficiency for this one would have been obviously brought about by its
privatization, but would have nothing to do with the private/public distinction. Negative
effects may also take place if, like government representatives before privatization, managers
of a newly-privatized firm give a higher priority to other conflicting objectives. For instance,
consider a firm which is privatized by direct sale to another firm, and is maintained as a
separate business unit of the acquirer. The corporate strategy of a firm may be such that not
all business units are treated equally (Brush and Bromiley, 1997); thus, it may be the case
that it is not in the acquiring firm’s interest as a whole to maximize the performance of the
individual unit constituted by the privatized firm. Also, as with political decisions, there is the
possibility of unintended negative effects from the new management’s decisions: managers
may find themselves unable to turn around a low-performing firm, encounter resistance to
change at some level of the organization, or face any other unintended situation.
These two groups of implications, then, lead to the following hypothesis:
Hypothesis 2. The observed effect of privatization on efficiency is influenced by political
and organizational factors.
Which of these implications actually take place, and hence whether their overall effect
on efficiency is positive or negative, is ultimately an empirical question that depends on the
specific case(s) examined.
3.2. Dynamic implications of privatization
under the latter all such searched is blocked, regardless of how good or poor an owner
the government proves to be. One implication of such argument for privatization is that a
privatized firm may not show an efficiency improvement immediately after privatization,
but it may exhibit an increasing trend in the evolution of its post-privatization efficiency.
In addition, some of the political and organizational factors with negative effects
dis-cussed have an important dynamic component associated to them, in the sense that those
negative effects are likely to diminish over time. Such would be the case of the political
decision to privatize the firm in a period of industrial or economic recession, when the
industry or economy starts to recover; or of the organizational inertia encountered by the
newly-privatized firm’s management, as the initial resistance to change begins to be
over-come. All these are reflections of the transition inherent to any privatization process, as a
result of which, political and organizational factors not only may influence the observed
effect of privatization on efficiency, but also the timing of this effect. Thus, I hypothesize:
Hypothesis 3. The observed effect of privatization on efficiency is contingent upon the
time period considered.
4. Privatization in Spain, 1985–1996
The three hypotheses are tested in a sample of 24 Spanish firms which were privatized
between 1985 and 1993. The superior efficiency of private (versus state-owned) firms in
Spain has been confirmed in a number of cross-sectional studies (see Maroto, 1991, for a
review; Azofra et al., 1991; Argimón et al., 1997). However, this is the first time the effects of
privatization processes are analysed in this country.
11Before Spain’s official privatization
program was started in 1996, 73 firms were fully privatized (all except two through direct
sales) by the former government, and four others had their privatization process started
through public share offerings (Villalonga, 1996).
12Therefore, time has gone by for enough
firms to allow an analysis of privatization effects, for which the Spanish case may be as good
as any other country’s. Besides, given the scarcity of empirical privatization (longitudinal)
analyses and of samples studied (British firms, and Megginson et al.’s sample), this study
may add some variety to the literature; I do not attempt to extend any specific conclusion
drawn from its results beyond the Spanish case, though, since the institutional environment
and the privatization process during the socialist government were highly idiosyncratic
(Villalonga, 1996; Cuervo, 1997). Details of the Spanish state-owned sector’s structure and
reorganizations during that period can be found in Sanch´ıs (1996). For the purpose of this
11Sanch´ıs (1996) claims to be doing so on a dataset that ends in 1990. However, of the 17 firms in his sample
for which he examines the effects of ‘privatization’, 11 were not really privatized (3 were transferred to another state-owned firm, 8 — counting Repsol as 5 had just minority stakes sold through IPO, and remained under the state’s control and majoritary ownership), and 5 (plus the 5 included in Repsol) were privatized in 1989 (including 3 that he says were privatized in 1988), so he just has 1 year of post-privatization data for them. Thus, only his results for one company (Seat) may be trustworthy estimates of the effect of privatization on efficiency, and so it cannot be properly considered as a privatization study.
12See, for a dynamic source of information on Spain’s privatization program, Expansion newspaper’s website at:
paper, it is sufficient to note that all the firms in the sample were operating in competitive
environments at the time of their privatization, so no de- or re-regulation interferes with the
estimation of strict privatization effects.
Following the order of the three hypotheses, I first determine whether privatization has
actually increased the efficiency of each of the firms in the sample (Hypothesis 1). I then
examine some of the political and organizational factors that may have played a role in
arriving at those results (Hypothesis 2). Although I am constrained by the data in the choice
of the specific factors to be examined, I have been able to include the following: As political
factors, (1) the stage of the business cycle at which the company was privatized (which
captures the government’s decision of when exactly to privatize the firm); and (2) the
foreignness of the buyer, which is typically an issue of political concern. As organizational
factors, (1) the company’s starting performance level as a private firm, which is assumed
to be reflecting the difficulty of running or turning around a low-performing privatized
firm; (2) the size of the organization at the time of its privatization, which is assumed to
be proportional to any possible resistance to change encountered; and (3) the firm’s capital
intensity (also at the time it was privatized), since if a firm in a capital-intensive business has
its capital investment increased as a result of being privatized, its efficiency will probably
increase in the longer run, but might not appear so in the early post-privatization years. This
issue particularly merits investigation in the Spanish case between 1985 and 1996, since
several firms were privatized in that period for lack of appropriate size or technology (De la
Dehesa, 1992). Note that all three organizational factors, as well as the first political factor
mentioned, are also transitional in nature. However, following Hypothesis 3, the actual
dynamic effect of these factors is tested separately.
4.1. Method
4.1.1. Population
The population of interest is comprised of the 77 Spanish firms privatized between 1985
and 1995, as listed in Villalonga (1996). Unlike more recent Spanish privatizations, these
were undertaken by the socialist government without any explicit privatization program or
goal statement and can, therefore, be considered as a separate population.
4.1.2. Sample
My sample of 24 firms results from excluding companies from the population in the
following order: (1) Those that were privatized after 1993, for which a maximum of only 2
years of post-privatization data would be available; (2) partial privatizations, i.e. those that
remained under state control; (3) those for which data could not be obtained for a minimum
of 3 years of public and 3 years of private ownership, on the following variables: profits
before taxes, assets, financial expenses (interests), sales, and number of employees.
and/or phone and/or in person. If and when the request was denied, company reports were
requested from the Registro Mercantil of the province in which the firm was incorporated.
The requirement to file in company reports is fairly recent, though (1989) and, as it appears,
often disregarded. The most recent year of data in the sample is 1996. In addition, data on
the average profitability of Spanish firms until 1995 is available from the annual reports of
the Central de Balances del Banco de España (Spain’s central bank).
This information has allowed me to construct a panel data set on profitability, sales,
employees, a dummy for whether the buyer was a foreign company or not, and average
profitability of Spanish firms, for 24 firms and a number of years between 7 and 14 (between
3 and 5 pre-privatization, the privatization year, and between 3 and 8 post-privatization).
The average number of years per firm is 9.9.
The list of firms in the sample, together with the available data for each of them in the
year of their privatization, is shown in Table 3. The table also contains information on the
year each firm was privatized, the industry, the buyer, and whether such buyer is foreign or
not.
4.1.3. Dependent variable(s)
As will be explained in more detail within the models section, a different econometric
model is used to test each of the three hypotheses. The dependent variable in Model 1 is
efficiency (EFFI), measured by Return on Assets (ROA) — calculated as earnings before
interest and taxes divided by total net assets. It is the measure more commonly used in
cross-industry privatization studies, and is considered a correct indicator of efficiency in
competitive environments (Borins and Boothman, 1985; Cuervo, 1995), as it is the case for
all the firms in the sample in the time period considered.
In Model 2, the dependent variable is efficiency increase (EFFINC), measured by the
estimated coefficient of the time*post-privatization period interaction term from Model 1.
In Model 3, it is efficiency growth (EFFGROwth), measured as (ROA
t– ROA
t–
1)/ROA
t−1.
4.1.4. Independent variables
In Model 1 there are two main independent variables: post-privatization period (PRIV),
which is a dummy variable (
=
1 if within period, 0 otherwise), and TIME (a discrete variable
ranging from 1 (year –5 before privatization) to 14 (year 8 after privatization). In Model
3 there are two groups of variables: (a) Political, which include: (1) initial stage of cycle
(CYCLE 0) — average ROA of Spanish firms in the year the firm was privatized — ,
as published in the annual reports of the Central de Balances del Banco de España; and
(2) a dummy for whether the buyer was foreign (
=
1) or not (
=
0) — FBUYER; and (b)
Organizational: (1) initial level of performance (PERF 0) — firm’s ROA; (2) initial firm
size (SIZE 0), measured as real sales (in 1990-pesetas);
13and (3) initial capital intensity
(CAPINT 0) — firm’s assets per employee. All three variables are measured in the year the
13Nominal sales have been deflated using year-wide averages of industry-specific industrial price indices (IPRI)
firm was privatized. In Model 2, all the independent variables are bi-yearly time dummies
(YEARt
1t
2).
4.1.5. Control variables
Control variables in Model 1 refer to external factors not implied by privatization that may
affect firm efficiency, and therefore, should be discounted in order to estimate the net effect
of privatization. These are: firm size (SIZE) and business cycle (CYCLE) — measured as
indicated above. In Model 3, the only factors considered as external are industry dummies
for all industries which are represented by more than one firm in the sample: aluminum
(ALUM), automobile (AUTO), ELECTRONIC, FOOD, and equipment (EQUIP).
4.2. Models
Hypothesis 1 is tested using similar methods to those that have been used in previous
statistical analyses of this hypothesis (or of the superiority of private ownership) on
lon-gitudinal datasets like mine. Similarly to Megginson et al., the differences between the
means and medians of the efficiency measure in the pre- and post-privatization periods are
compared through t-statistics, and z-statistics are used to test if the proportion of firms that
changed in the expected direction is significantly different from 0.5.
14As in Ehrlich et al.
(1994), the time trends of efficiency in both periods are also compared, by estimating the
following fixed-effects model:
15Model 1 : EFFI
it=
α
i+
β
li∗PRIV
it+
β
2∗iTIME
it+
β
3∗iTIME
∗
PRIV
it+
γ
1∗SIZE
it+
γ
2∗CYCLE
it+
ε
it,
(1)
where
E(ε
iε
′j)
=
σ
ij.
The effect of privatization in this model can be seen from the coefficients of PRIV
and TIME
∗PRIV: PRIV captures differences in performance levels before and after
pri-vatization, while TIME
∗PRIV captures changes in performance trends. That is, a positive
coefficient in TIME
∗PRIV would indicate that performance increases more over time after
privatization than before (or decreases less, if the time coefficient is negative).
16Chow
specification tests shown at the bottom of Table 5 lead to reject the hypothesis of common
intercept and slope coefficients across pool members for the PRIV, TIME and TIME
∗PRIV
terms. Thus, those coefficients are estimated individually for each firm (
α
i,
β
1i,
β
2i, and
14A 0.5 proportion corresponds to the null hypothesis of privatization having no effect on efficiency. A proportion
significantly above (below) 0.5 would provide statistical evidence of privatization having a positive (negative) effect on efficiency.
15Ehrlich et al. use a similar model to test the effect of public versus private ownership (though not of privatization)
on a panel of 23 international airlines over a 10-year period.
16I am treating the effects as fixed, as opposed to random, for two reasons: (1) Given the idiosyncratic nature of
β
3i), but those of the control variables, size and cycle, (
γ
4and
γ
5) in common.
17The error
structure specification, based on the evidence and diagnostic tests reported in Table A.1 of
the Appendix, allows for groupwise heteroskedasticity and cross-sectional correlation, but
not for autocorrelation.
18Given this error structure, the appropriate method of estimation
is Feasible Generalized Least Squares (FGLS), as in a Seemingly Unrelated Regressions
(SUR) model (Zellner, 1962). That is, the covariance matrix across pool members is
es-timated in a preliminary OLS regression and then applied in GLS estimation in a second
stage.
Hypothesis 2 is tested as a second step after the estimation of Model 1. The estimated
firm-specific parameters of TIME
∗PRIV from Table 5 (those of
β
3i
in Model 1) are used
as measures of efficiency increase (in trend), which becomes the dependent variable in the
following cross-sectional model:
Model 2 : EFFINC
i=
α
+
β
1∗CYCLE
i0+
β
2∗FBUYER
i+
β
3∗PERF
i0+
β
4∗SIZE
i0+
β
5∗CAPINT
i0+
β
6∗ALUM
i+
β
7∗AUTO
i+
β
∗8
ELECTRONIC
i+
β
9∗FOOD
i+
β
10∗EQUIP
i+
ε
i,
(2)
where
E(ε
iε
′j)
=
σ
i2and the regressors represent all the political and organizational
fac-tors and controls, as described before. Hypothesis 2 may be tested from this model by a
Wald test of the joint significance of the coefficients of CYCLE, FBUYER, PERF, SIZE,
and CAPINT. The correlation matrix of the data used for this regression is reported in
Table A.2 of the Appendix A weighted least squares (WLS) estimator is now used to
correct for heteroskedasticity, which in this case arises from the dependent variable’s
be-ing estimated with varybe-ing precision. Followbe-ing Saxonhouse (1976), each observation is
weighted on all variables by the inverse of the estimated standard error of the dependent
variable.
Hypothesis 3 is tested by regressing efficiency growth on time dummies. The diagnostic
tests (also shown in Table A.1) and assumptions support the same error structure as in
Model 1, so the same estimation procedure is followed. I have chosen to specify and report
results from the regression in bi-yearly dummies to keep the specification parsimonious
(results were similar, though, when yearly dummies were used). Thus, the model can be
written as:
17Since the number of cross-sectional units (firms) in the data set is very small, I do not need to difference away the
intercepts through a ‘deviation from individual means’ transformation, as it is common practice in the estimation of fixed effects models in large N panels.
18I find evidence of groupwise heteroskedasticity in the residual variances for each firm, which differ by as much
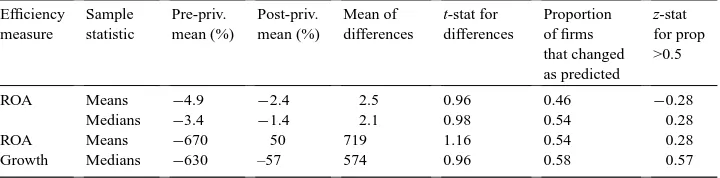
Table 4
Tests for changes in efficiency after privatizationa
Efficiency
Growth Medians −630 –57 574 0.96 0.58 0.57
aN=24.
Model 3 : EFFGROWTH
it=
α
+
β
li∗YEAR43
it+
β
2∗iYEAR21
it+
β
3∗iYEAR12
it+
β
4∗iYEAR34
it+
β
5∗iYEAR56
it+
β
6∗iYEAR78
it+
ε
it,
(3)
where
E(ε
iε
j′)
=
σ
ijand the coefficients on the bi-yearly time dummies measure the increase
in efficiency growth that takes places in each pair of years with respect to the privatization
year, which is the base period captured by the intercept.
4.3. Results
The values of the t and z-statistics used to test Hypothesis 1 are reported in Table 4. As the
table shows, none of the statistics are significant at the conventional levels. This hypothesis
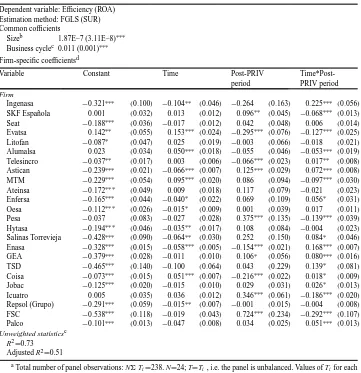
is also tested through the estimation of Model 1, the results of which are reported in Table
5. There it can be seen that the coefficient of the post-privatization period dummy (PRIV)
is significant in nine (out of 24) cases, of which five are positive and four negative. The
coefficient of TIME
∗PRIV is significant in 13 cases, which are also split into six positive
and seven negative.
Results of the estimation of Model 2 appear in Table 6. As the table shows, the two
variables representing political factors are significant and positive, and so are, among the
three organizational factors, firm size and capital intensity (the latter only at the 10 percent
level). However, the initial performance level has no significant effect on efficiency increase.
The Wald test of the joint significance of the coefficients of these five variables (the political
and organizational factors altogether), through which Hypothesis 2 may be more directly
tested, yields a chi-square statistic of 246.28, with a probability value of 0.001. Four of the
five industry dummies included (all except equipment) also turn out to have a significant
positive effect.
Table 5
Model 1: Fixed-effects regression of efficiency on time, post-privatization period, and time*post-privatization perioda
Dependent variable: Efficiency (ROA) Estimation method: FGLS (SUR) Common cofficients
Sizeb 1.87E–7 (3.11E–8)∗∗∗ Business cyclec 0.011 (0.001)∗∗∗ Firm-specific coefficientsd
Salinas Torrevieja −0.428∗∗∗
(0.090) −0.064∗∗
aTotal number of panel observations: N6T
i=238. N=24; T=Ti, i.e. the panel is unbalanced. Values of Tifor each firm appear in Table 8. Average T=9.9.
bReal sales, measured in millions of January 1990-pesetas. Nominal sales are deflated using year-wide averages of
industry-specific industrial price indices (or the food and drinks consumer price index,in the case of Jobac); Sources: Firms’ and state holding companies’s (Instituto Nacional de Industria (INI), Teneo, or Patrimonio) annual reports, for nominal sales figures; Instituto Nacional de Estad´ıstica (INE), Spain, for inflation indices.
cAverage ROA of Spanish firms for each year. Source: Central de Balances del Banco de España, Spain. dF-statistics from Chow tests of different coefficients across firms: 184.86 for intercept; 99.24 for Time; 43.98 for
Post-PRIV period; 108.85 for Time*Post-PRIV period. All test statistics are significant at the 1% level.
eThe unweighted are reported because the GLS transformation inflates the R2from the regression (Greene, 1997).
These unweighted statistics come from regressing the untransformed dependent variable on the predicted values using untransformed regressors and the coefficients from the weighted (GLS) regression. Standard errors are in parentheses.
∗
Statistically significant at the 10% level. ∗∗Statistically significant at the 5% level. ∗∗∗
Table 6
Model 2: Regression of efficiency increase on political and organizational factorsa
Dependent variable: efficiency increaseb
Estimation method: weighted least squares (WLS)
Constant −0.324∗∗∗
(0.037) Political factorsc
Business cycle at privatization dated 2.210∗∗∗
(0.379)
Foreign buyere 0.093∗∗
(0.029) Organizational factors
Initial performance levelf 0.086 (0.170)
Sizeg 1.14E−7∗∗
(4.1E–8)
Capital intensityh 0.002∗
(0.001) Controls
Aluminum industrye 0.251∗∗ (0.078)
Automotive industrye 0.160∗ (0.072)
Electronic industrye 0.151∗∗∗ (0.024)
Food industrye 0.124∗∗ (0.037)
Equipment industrye −0.045 (0.035)
Unweighted statisticsi
R2=0.95
Adjusted R2=0.80 aN=22.
bMeasured by the estimated coefficient of the Time*Post-privatization period interaction term from Table 3. cWald test of joint significance of political and organizational factors:
x
2-statistic=246.28, p-value=0.001.dAverage ROA of Spanish firms in the year the firm was privatized. Source: Central de Balances del Banco
de España, Spain.
eDummy variable (=1 if true, 0 otherwise). Source: Villalonga (1996). fFirm’s ROA at privatization date. Source: Firms’ annual reports.
gReal sales, measured in millions of January 1990-pesetas. Nominal sales are deflated using year-wide averages
of industry-specific industrial price indices (or the food and drinks consumer price index,in the case of Jobac). Source: Instituto Nacional de Estad´ıstica, Spain.
hFirm’s assets per employee at privatization date. Source: Firms’ annual reports.
iThe unweighted statistics are reported because the GLS transformation inflates the R2from the regression
(Greene, 1997). These unweighted statistics come from regressing the untransformed dependent variable on the predicted values using untransformed regressors and the coefficients from the weighted regression. Standard errors are in parentheses.
∗
Statistically significant at the 10% level. ∗∗
Statistically significant at the 5% level. ∗∗∗
Statistically significant at the 1% level.
5. Discussion and implications
Table 7
Model 3: Regression of efficiency growth on bi-yearly dummiesa
Dependent variable: Efficiency (ROA) growth Estimation method: FGLS (SUR)
Year 0 (Privatization year) −141.753∗∗∗
(30.013) Years –4 to –3 (pre-privatization) 159.345∗∗∗
(39.463) Years –2 to –1 (pre-privatization) −13.288 (37.666) Years 1 to 2 (post-privatization) 89.889∗∗
(36.758) Years 3 to 4 (post-privatization) 87.297∗∗
(37.029) Years 5 to 6 (post-privatization) −344.345∗∗∗ (51.030) Years 7 to 8 (post-privatization) 2402.241∗∗∗ (276.720) Unweighted statisticsb
R2=0.92
Adjusted R2=0.91
aTotal number of panel observations: N6(T
i−1)=214, due to loss of the first observation for each firm to calculate growth series (N=24; T=Ti–1, Values of Tifor each firm are reported in Table 8. Average T=9.9.).
bThe unweighted statistics are reported because the GLS transformation inflates the R2from the regression
(Greene, 1997). These unweighted statistics come from regressing the untransformed dependent variable on the predicted values using untransformed regressors and the coefficients from the weighted (GLS) regression. Standard errors are in parentheses:∗Statistically significant at the 10% level;∗∗Statistically significant at the 5% level; ∗∗∗Statistically significant at the 1% level.
efficiency in about as many cases as it has led to significant decreases. Consequently,
Hypothesis 1 is rejected. This finding, together with the evidence reported in previous studies
that, in the same country and period, private ownership was significantly associated with
higher levels of performance, lends support to my claim that privatization involves more
than pure ownership effects. Neither does the positive effect of ownership on efficiency
observed in other studies lead to a positive effect of privatization on efficiency, nor does the
inconclusive effect of privatization on efficiency observed in this study imply that ownership
has no effect on efficiency, as would be concluded from estimating the effect of private
versus public ownership in this sample in the ‘traditional’ way ignoring the effect of all
factors other than ownership. Thus, the discrepancy can only be resolved by examining what
other factors may have intervened in the observed relationship between privatization and
efficiency.
around a low-performing privatized firm does not seem to have played a role in arriving
at the observed effects of privatization in efficiency. Firm size, however, does have a
pos-itive and significant effect. If, as it has been assumed, size is proxying for the resistance
to change encountered within the organization, the positive sign found appears to
contra-dict my expectation (that larger firms would be less prone to confirm the positive effects
of privatization on efficiency). On the other hand, as a dynamic and transitional factor, it
is consistent with the overall timing of effects observed from Model 3 (discussed below).
Finally, the positive sign on capital intensity reveals that efficiency increases are associated
with the more capital-intensive firms within the sample and, insofar as it is another
transi-tional factor, its effect is also consistent with the observed timing of the total privatization
effect.
The estimation of Model 3 yields the strongest evidence of efficiency increase for years
7 and 8 after privatization, as well as fairly strong evidence of decrease for the 2
pre-vious years (5 and 6). This confirms Hypothesis 3 (that the observed effect of
privati-zation on efficiency is contingent upon the time period considered), thus making clear
that conclusions about the privatization-efficiency hypothesis drawn from looking at short
post-privatization periods (e.g. Sanch´ıs, 1996) may be misleading. It also suggests that
one or more of the negative transitional factors described might have actually been
op-erating during the first 6 years after privatization, but their impact has finally been offset
by the effects of private ownership and possibly other positive implications of
privatiza-tion. The positive significance of years 4–3 before privatization is worth noting. None of
the theories mentioned offer any prediction about the efficiency of privatized firms
be-fore they are privatized, but there is typically a popular concern, supported by empirical
evidence from some British companies, that governments pick out for privatization firms
that have already begun to experience an efficiency increase. On the other hand, such an
explanation easily fits within the framework presented here, as another possible political
factor. Nevertheless, the fact that the positive significance is observed 4–3 years before
privatization, but not immediately before (e.g. in years 2–1), seems at odds even with that
explanation. In this sense, all that can be said is that both my specific finding and the
more general issue of the timing of efficiency effects before privatization deserve further
investigation.
well be the case that large firms have been able to downsize themselves to a greater
ex-tent than small firms, and that the higher efficiency increase observed for them is just a
consequence of that restructuring. Third, given the evidence I have provided that the
ef-fect of privatization on efficiency is contingent upon the time period considered, this is
a limitation of any empirical privatization study to which mine is no exception. For
in-stance, it is possible that some of the results would have been different if the panel had been
balanced.
These limitations are hardly solvable within the context of the population of this
study, since they are mostly data-driven and I believe I have exhausted all possible
means of data collection for most of the sample. However, they may be solved by
investigat-ing a different population of privatized firms for which more internal data
are available. Given the large number of firms that have been privatized all over the
world in recent years, this extension is likely to become increasingly feasible. Moreover, I
believe this is highly desirable, since (1) there are still very few statistical studies
of
privatization
effects,
and
(2)
my
findings
definitely
encourage
further
research.
This study has important implications for the privatization literature, since it has
iden-tified a major mismatch between privatization theories and evidence, and contributed to
explain it. It has proven the relevance of some implications of privatization that had,
how-ever, been ignored by previous privatization theorists and empiricists, namely, political,
organizational, and dynamic implications that go beyond the private-public distinction. I
think this should be of interest not only to academics, but also to the multiple stakeholders
involved in privatization programs: governments undertaking these programs, companies
or investors participating on the demand side, and even the general public, to the extent
that we are all the ultimate owners of the state-‘owned’ enterprises of our countries of
citizenship.
Acknowledgements
I would like to thank Alvaro Cuervo, Harold Demsetz, Javier Gómez Biscarri, Bill
McKelvey, and Pavel Pelikan for their comments and suggestions on earlier versions of
this paper. All remaining errors are of course my own. Financial support for my doctoral
studies from the Fulbright Commission, Fundación Caja de Madrid, Fundación Ramón
Areces, and the Anderson School Doctoral Program Office is also gratefully
acknowledged.
Appendix
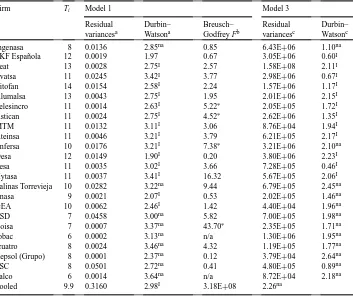
Table A.1
Heteroskedasticity and autocorrelation tests for Models 1 and 3: residual variances, Durbin–Watson, and F-statistic from Breusch–Godfrey test equations
Ingenasa 8 0.0136 2.85na 0.85 6.43E+06 1.10na
SKF Española 12 0.0019 1.97 0.67 3.05E+06 0.60I
Seat 13 0.0028 2.75I 2.57 1.58E+08 2.11I
Evatsa 11 0.0245 3.42I 3.77 2.98E+06 0.67I
Litofan 14 0.0154 2.58I 2.24 1.57E+06 1.17I
Alumalsa 13 0.0043 2.75I 1.95 2.01E+06 2.15I
Telesincro 11 0.0014 2.63I 5.22∗
2.05E+05 1.72I
Astican 11 0.0024 2.75I 4.52∗
2.62E+06 1.35I
MTM 11 0.0132 3.11I 3.06 8.76E+04 1.94I
Ateinsa 11 0.0046 3.21I 3.79 6.21E+05 2.17I
Enfersa 10 0.0176 3.21I 7.38∗
3.21E+06 2.10na
Oesa 12 0.0149 1.90I 0.20 3.80E+06 2.23I
Pesa 11 0.0035 3.02I 3.66 7.28E+05 0.46I
Hytasa 11 0.0037 3.41I 16.32 5.67E+05 2.06I
Salinas Torrevieja 10 0.0282 3.22na 9.44 6.79E+05 2.45na
Enasa 9 0.0021 2.07I 0.53 2.02E+05 1.46na
Repsol (Grupo) 8 0.0001 2.37na 0.12 3.79E+04 2.64na
FSC 8 0.0501 2.72na 0.41 4.80E+05 0.89na
Palco 6 0.0014 3.64na n/a 8.72E+04 2.18na
Pooled 9.9 0.3160 2.98I 3.18E+08 2.26na
aThe residual variances and Durbin–Watson statistics come from the individual firm regressions:
EFFIt=α+β1∗PRIVt+β2∗TIMEt+β3∗TIME
∗
PRIVt+β4∗SIZEt+β5∗CYCLEt+εt, I=Test is inconclusive; na=dL and dU critical values are not available in tables for this sample size.
bThe Breusch–Godfrey F-statistic is testing the null hypothesis that the coefficient of the lagged residuals
eit−1is zero in the individual firm regressions:
et =α+β1∗PRIVt+β2∗TIMEt+β3∗TIME
∗
PRIVt+β4∗CYCLEt+β5∗eit−1+uit, where etare the estimated residuals ofǫitfor each firm i from Model 1 (Table 5).
cThe residual variances and Durbin–Watson statistics come from the individual firm regressions:
EFFGROWTHt=α+β1∗YEAR43t+β2∗YEAR21t+β3∗YEAR12t+β4∗YEAR34t+β5∗YEAR56t +β6∗YEAR78t+εt,
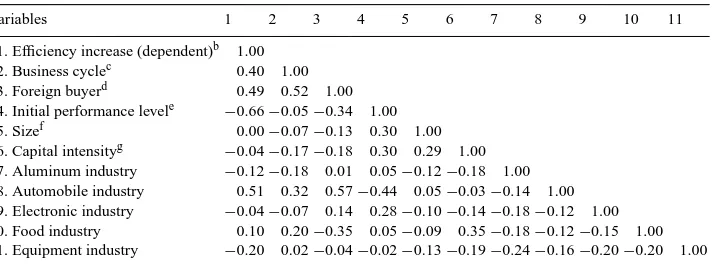
Table A.2
Correlation matrix of variables in Model 2a
Variables 1 2 3 4 5 6 7 8 9 10 11
1. Efficiency increase (dependent)b 1.00
2. Business cyclec 0.40 1.00
3. Foreign buyerd 0.49 0.52 1.00
4. Initial performance levele −0.66−0.05−0.34 1.00
5. Sizef 0.00−0.07−0.13 0.30 1.00
6. Capital intensityg −0.04−0.17−0.18 0.30 0.29 1.00
7. Aluminum industry −0.12−0.18 0.01 0.05−0.12−0.18 1.00 8. Automobile industry 0.51 0.32 0.57−0.44 0.05−0.03−0.14 1.00 9. Electronic industry −0.04−0.07 0.14 0.28−0.10−0.14−0.18−0.12 1.00 10. Food industry 0.10 0.20−0.35 0.05−0.09 0.35−0.18−0.12−0.15 1.00 11. Equipment industry −0.20 0.02−0.04−0.02−0.13−0.19−0.24−0.16−0.20−0.20 1.00
aN=24.
bFirm’s assets per employee at privatization date. Source: Firms’ annual reports.
cAverage ROA of Spanish firms in the year the firm was privatized. Source: Central de Balances del Banco
de España, Spain.
dDummy variable (=1 if true, 0 otherwise). Source: Villalonga (1996). eFirm’s ROA at privatization date. Source: Firms’ annual reports.
fReal sales, measured in millions of January 1990-pesetas. Nominal sales are deflated using year-wide averages
of industry-specific industrial price indices (or the food and drinks consumer price index, in the case of Jobac); Source: Instituto Nacional de Estad´ıstica (INE), Spain.
gFirm’s assets per employee at privatization date. Source: Firms’ annual reports.
References
Adhikari, R., Kirkpatrick, C., 1990. Surveys of practice and principles. In: Heath, J.(Ed.), Public Enterprise At The Crossroads. Routledge, London.
Aharoni, Y., 1981. Managerial discretion, In: Vernon, R., Aharoni Y. (Eds.), State-Owned Enterprises in the Western Economies. St. Martin’s Press, New York, pp. 184–193.
Ahlbrandt Jr., R., 1973. Efficiency in the provision of fire services Public Choice 16, 1–15.
Ahlbrandt Jr., R., 1974. Implications of contracting for public service Urban Affairs Quarterly 9, 337–358. Al-Obaidan, A.M., Scully, G.W., 1991. Efficiency differences between private and state-owned enterprises in the
international petroleum industry Applied Economics 23, 237–246.
Alchian, A.A., 1965. Some economics of property rights Il Politico 30, 816–829.
Argimón, I., Artola, C., González Páramo, J.M., 1997. Empresa pública y empresa privada, Titularidad y eficiencia relativa. Borrador de trabajo. Banco de España.
Ashworth, M., Forsyth, P., 1984. Civil aviation policy and the privatisation of British Airways. IFS Report 12. Institute for Fiscal Studies, London.
Atkinson, S., Halvorsen, R., 1986. The relative efficiency of public and private firms in a regulated environment: the case of U.S. electric utilities Journal of Public Economics 29, 281–294.
Audit Commission, 1984, Securing Further Improvements in Refuse Collection. HMSO, London.
Azofra, V., Fernández, A.I., Hernangómez, J., De Miguel, A., 1991. Análisis sectorial del comportamiento financiero de las empresas públicas and privadas en España. Anales de Estudios Económicos and Empresariales, 6, Valladolid.
Bails, D., 1979. Provision of transportation services Public Choice 34, 65–68. Baltagi, B., 1995. Econometric Analysis of Panel Data. Wiley, New York.
Barla, P., Perelman, S., 1989. Technical efficiency in airlines under regulated and deregulated environment Annals of Public and Cooperative Economics 60, 103–124.
Becker, E.R., Sloan, F.A., 1985. Hospital ownership and performance Economic Inquiry 23, 21–36.
Bennett, J.T., Johnson, M.H., 1979. Public versus private provision of collective goods and services: garbage collection revisited Public Choice 34, 55–63.
Bennett, J.T., Johnson, M.H., 1980. Tax reduction without sacrifice, private sector production of public services Public Finance Quarterly 8, 363–396.
Bhaskar, V., Khan, M., 1995. Privatization and employment: a study of the jute industry in Bangladesh American Economic Review 85 (1), 267–273.
Bishop, C.E., 1980. Nursing home cost studies and reimbursement issues Health Care Financing Review 1, 47–64. Bishop, M., Thompson, D., 1992. Regulatory reform and productivity growth in the U.K.’s public utilities Applied
Economics 24, 1181–1190.
Boardman, A., Vining, A., 1989. Ownership and performance in competitive environments: a comparison of the performance of private Journal of Law and Economics 32, 1–33.
Boland, J.J., 1983. Water and wastewater pricing and financial practices in the U.S. metametrics, Washington, DC. Boorsma, P.B., 1982. Public sector productivity and relative efficiency in the netherlands, mimeo, Department of
Public Administration, Twente University.
Borcherding, T.E., 1983. Towards a positive theory of public sector supply arrangements, In: Prichard, J.R.S. (Ed.), Crown Corporations in Canada, The Calculus of Instrument Choice. Butterworth, Toronto.
Borcherding, T., Pommerehne, W., Schneider, F., 1982. Comparing the efficiency of private and public production, the evidence from five countries Zeitschrift für Nationalökonomie Suppl. 2, 127–156.
Borins, S.F., Boothman, B.E.C., 1985. Crown corporations and economic efficiency, In: McFetridge, D.G. (Ed.), Canadian Industrial Policy in Action. University of Toronto Press, Toronto, pp. 75–129.
Bös, D., 1991. Privatization: A Theoretical Treatment. Clarendon Press, Oxford.
Bös, D., Peters, W., 1991. A principal-agent approach on manager effort and control in privatized and public firms. In: Ott, A.F., Hartley, K. (Eds.), Privatization and Economic Efficiency. A Comparative Analysis of Developed and Developing Countries. Edward Elgar, Aldershot, pp. 26–52.
Boussofiane, A., Martin, S., Parker, D., 1997. Estimating technical efficiency using data envelopment analysis. In: Martin, S., Parker, D. (Eds.), The Impact of Privatisation. Ownership and Corporate Performance in the UK. Routledge, London, pp. 127–150.
Boycko, A.S., Vishny, R., 1996. A theory of privatization Economic Journal 106, 309–319.
Boyd, C.W., 1986. The comparative efficiency of state-owned enterprises, In: Neghandi, Thomas, Rao (Eds.) , Multinational Corporations and State-Owned Enterprises, A New Challenge in International Business. Research in International Business and International Relations 1, pp. 179–194.
Bruggink, T.H., 1982. Public versus regulated private enterprise in the municipal water industry: a comparison of operating costs Quarterly Review of Economics and Business 22, 111–125.
Brush, T.H., Bromiley, P., 1997. What does a small corporate effect mean? A variance components simulation of corporate and business effects Strategic Management Journal 18, 825–835.
Bundesrechnungshof, 1972. Bemerkungen des bundesrechnungshofs zur bundeshaushalts-rechnung: einschlies-slich bundesvermögensrechnung) für das haushaltsjahr 1972, Bundestagsdrucksache 7(2709) 110-111. Bundesregierung Deutschland, Agrarbericht 1976. Bundestagsdrucksache, 7(4680), 63-65.
Bundesregierung Deutschland, 1976. Agrarbericht 1976. Bundestagsdrucksache, 7(4681), 146.
Burgat, P., Jeanrenaud, C., 1990. Mésure de l’éfficacité productive et de l’éfficacité-coût: cas de déchets ménagers en suisse. Working Paper 9002, Institut de Recherches Economiques et Régionales, Université de Neuchâtel. Caves, R.E., 1990. Lessons from privatization in Britain. State enterprise behavior, public choice, and corporate
governance Journal of Economic Behavior and Organization 13, 145–169.
Caves, D.W., Christensen, L.R., 1980. The relative efficiency of public and private firms in a competitive environment: the case of Canadian railroads Journal of Political Economy 88, 958–976.
Caves, D.W., Christensen, L.R., Swanson, J.A., Tretheway, M.W., 1982. Economic performance of U.S. and Canadian railroads: the significance of ownership and the regulatory environment, In: Stanbury, W.T., Thompson, F. (Eds.), Managing Public Enterprises. Prager, New York, pp. 123–151.
Collins, J.N., Downes, B.T., 1977. The effect of size on the provisions of public services: the case of solid waste collection in smaller cities Urban Affairs Quarterly 12, 333–345.
Côte, D., 1989. Firm efficiency and ownership structure. The case of U.S. electric utilities using panel data Annals of Public and Cooperative Economics 60, 431–450.
Crain, W.M., Zardkoohi, A., 1978. A test of the property rights theory of the firm: water utilities in the U.S. Journal of Law and Economics 21, 395–408.
Cragg, M.I., Dyck, I.J.A., 1997a. Management control and privatization in the UK: a quiet life disturbed. Harvard Business School Working Paper 97–045.
Cragg, M.I., Dyck, I.J.A., 1997b. Fat cats or corporate agents? U.K. privatization and corporate control. mimeo, Harvard Business School, November.
Cragg, M.I., Dyck, I.J.A., 1998. Executive pay and U.K. privatization, the demise of ’one country, two systems’, mimeo, Harvard Business School, January.
Cubbin, J., Domberger, S., Meadowcroft, S., 1987. Competitive tendering and refuse collection: identifying the sources of efficiency gains Fiscal Studies 8, 431–450.
Cuervo, A., 1995. Opiniones ante la reforma de la empresa pública Cuadernos de Información Económica 101/102, 34–41.
Cuervo, A., 1997. La privatización de la empresa pública (Ediciones Encuentro, Madrid).
Cuervo, A., Peres, W., 1981. Eficacia y eficiencia de la empresa pública: Reflexiones Hacienda Pública Española 68, 27–46.
Davies, D.G., 1971. The efficiency of public versus private firms: the case of Australia’s two airlines Journal of Law and Economics 14, 149–165.
Davies, D.G., 1977. Property rights and economic efficiency — the Australian airlines revisited Journal of Law and Economics 20, 223–226.
Davies, D.G., 1981. Property rights and economic behaviour in private and government enterprises: the case of Australia’s banking system Research in Law and Economics 3, 111–142.
Davies, D.G., Brucato Jr., P.F., 1987. Property rights and transaction costs: theory and evidence on privately-owned and government-owned enterprises Journal of Institutional and Theoretical Economics 143, 7–22.
De Alessi, L., 1974. An economic analysis of government ownership and regulation: theory and the evidence from the electric power industry Public Choice 19, 1–42.
De Alessi, L., 1975. Some effects of ownership on the wholesale prices of electric power Economic Inquiry 13, 338–526.
De Alessi, L., 1977. Ownership and peak-load pricing in the electric power industry Quarterly Review of Economics and Business 17, 7–26.
De Alessi, L., 1980. The economics of property rights: a review of the evidence Research in Law and Economics 2, 1–47.
De Alessi, L., 1987. Property rights and privatization Proceedings of the Academy of Political Science 36 (3), 24–35.
De la Dehesa, G., 1992. Privatización europea: El caso de España Información Comercial Española Revista de Econom´ıa 707, 55–71.
Denny, M., de Fontenay, A., Werner, W., 1983. Comparing the efficiency of firms: Canadian telecommunications companies, In: Courville, L., de Fontenay, A., Dobell, R. (Eds.), Economic Analysis Of Telecommunications: Theory and Applications. Elsevier Science, New York.
Di Lorenzo, T.J., Robinson, R., 1982. Managerial objectives subject to political market constraints: electric utilities in the U.S. Quarterly Review of Economics and Business 22 (2), 113–125.
Distexhe, V., 1993. L’éfficacité productive des services d’enlèvement des inmondices en Wallonie Cahiers Economiques de Bruxelles 137, 119–138.
Domberger, S., Piggott, J., 1986. Privatization policies and public enterprise: a survey The Economic Record 62, 145–162.
Duch, R.M., 1991. Privatizing The Economy. Telecommunications Policy In Comparative Perspective. University of Michigan Press, Ann Arbor.
Dyck, A., 1997. Privatization in Eastern Germany: management selection and economic transition, American Economic Review, 565–597.