L
Journal of Experimental Marine Biology and Ecology 249 (2000) 29–49
www.elsevier.nl / locate / jembe
Separating the elements of habitat structure: independent
effects of habitat complexity and structural components on
rocky intertidal gastropods
* Michael W. Beck
Institute of Marine Ecology, A11, University of Sydney, Sydney, NSW 2006, Australia Received 6 September 1999; received in revised form 1 February 2000; accepted 9 February 2000
Abstract
It has been difficult to understand the effects of habitat structure on assemblages because the different elements of habitat structure are often confounded. For example, few studies consider that the effects of structural components of a habitat (rocks, trees, pits, pneumatophores) may be separate from the complexity (e.g. surface area hSAj) they create. From prior observations and experiments, I developed three hypotheses about the effects of habitat structure on gastropods on rocky intertidal shores in Botany Bay, Australia. (1) The complexity of habitats positively affects the density and richness of gastropods. (2) The fractal dimension (D) represents elements of complexity that affect the density and richness of gastropods better than other indices of complexity. (3) The effects of specific structural components on the density and richness of gastropods are independent of their complexity. To test these hypotheses, treatments composed of pits and pneumatophores were used to independently manipulate complexity and structural components in experiments repeated at five different times on two shores. There was support for hypotheses (1) and (3) at most times and places but not for hypothesis (2). Richness, total density, and the densities of two of the three most common gastropods were greater in treatments with greater complexity. D was not definitively better than other indices of complexity, but D and SA were recommended for further consideration. When complexity was held constant, species richness and the density of most gastropods, except Austrocochlea porcata, was greater in treatments with pits than with pneumatophores. A common mechanistic explanation for the effects of habitat complexity on rocky intertidal gastropods relies on a specific characteristic of pits; they pool water and reduce desiccation stress. This assumption may be appropriate for many gastropods, but it was inappropriate for A. porcata. Habitat complexity affected its density, but this was not because of a characteristic specific to pits. The complexity and structural components of habitats have separate effects on assemblages, and it confuses the study of habitat structure to combine them. 2000 Elsevier Science B.V. All rights reserved.
*Present address: The Nature Conservancy, A316 Earth and Marine Sciences, University of California, Santa Cruz, CA 95064, USA. Tel.: 11-831-469-3608; fax: 11-831-459-4882.
E-mail address: [email protected] (M.W. Beck)
30 M.W. Beck / J. Exp. Mar. Biol. Ecol. 249 (2000) 29 –49
Keywords: Fractal dimension; Gastropod; Habitat structure; Habitat complexity; Structural components; Rocky intertidal
1. Introduction
Habitat structure may affect the diversity and abundance of species in many systems (Grinnell, 1917; Gause, 1934; Huffaker, 1958; Connell, 1961; Kohn and Leviten, 1976; Connor and McCoy, 1979; Menge and Lubchenco, 1981; Werner et al., 1983; Leber, 1985; Underwood and Chapman, 1989). Studies of the effects of habitat structure are nearly as common as those of competition and predation, but there are few reviews of habitat structure, and it is rarely discussed in textbooks (McCoy and Bell, 1991). This lacuna occurs because there has been little consistency in the (1) definition or (2) measurement of habitat structure between different studies or habitats. These problems make it difficult to compare methods and results between studies, which constrains the development of a broader understanding of the effects of habitat structure on the diversity and abundance of species.
To address the first problem, McCoy and Bell (1991) offered a definition of habitat structure, which can help guide research and enhance interpretability of results from different studies and habitats. Their definition of habitat structure proposes that it is composed of at least two major factors, complexity and heterogeneity, and their effects and measurement are scale-dependent (McCoy and Bell, 1991; Beck, 1998; Downes et al., 1998). Complexity encompasses variation in habitat structure attributable to the absolute abundance of individual structural components. Structural components are distinct physical elements of the habitat, e.g. rocks, trees, pits, and pneumatophores (McCoy and Bell, 1991; Downes et al., 1998). Heterogeneity encompasses variation in habitat structure attributable to variation in the relative abundance of different structural components (McCoy and Bell, 1991; Beck, 1998; Downes et al., 1998). The basis of an effect of heterogeneity is that the effects of different structural components are independent of their complexity.
McCoy and Bell (1991) helped clarify the difference between complexity and structural components, but these two elements of habitat structure are often confounded. Some studies suggested that particular structural components affected the density and diversity of animals but did not account for differences in complexity (e.g. Inglis, 1994; Dittel et al., 1996; Primavera, 1997). For example, Miller and Carefoot (1989) compared the effects of two different structural components, rocky pits and adult barnacles, on the density of juvenile barnacles. They concluded that adult barnacles had a greater effect on the density of juvenile barnacles than pits but did not consider that these results might be largely explained by the greater complexity (e.g. SA) of their treatments with adult barnacles.
in each treatment by changing either the type of structural component (e.g. one species of algae vs. another) or the number of different structural components (e.g. one vs. two types of vegetation). These latter studies confounded complexity, structural components, and heterogeneity. When studies of habitat structure are confounded, it is not possible to identify the important elements of habitat structure or the mechanistic basis for their effects on species.
Habitat complexity and structural components have been experimentally separated in just a few studies (McGuinness, 1984; Dean and Connell, 1987; Jenkins and Sutherland, 1997). Stoner and Lewis (1985) showed that the total abundance of epifaunal crustaceans was affected primarily by the surface area of vegetation. It mattered little whether this complexity was created by seagrass or algal components. A few species, however, had greater densities in plots with algae than in plots with similar complexities of seagrass (i.e. there were effects of structural components over and above the effects of complexity).
The lack of distinction between complexity and structural components is tied to the second major problem that limits our understanding of habitat structure; there is little consistency in the measurement of complexity between different studies and habitats (McCoy and Bell, 1991; Beck, 1998). This problem arises because most indices of complexity are based on specific structural components (e.g. counts of number of trees or pits), which severely limits their use and interpretation. A number of indices of complexity, e.g. D and SA, can be used more broadly, because their measure of complexity is independent of specific structural components. At present, there is little justification for the use of one index over another (but see Carleton and Sammarco, 1987; Underwood and Chapman, 1989; McCormick, 1994; Beck, 1998), and experi-ments are necessary to determine which index best represents the eleexperi-ments of complexity that affect species (e.g. Jacobi and Langevin, 1996).
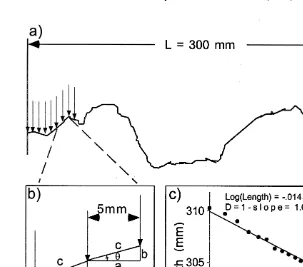
In previous work, I showed that the effects of complexity on gastropods could be measured and compared in rocky intertidal and mangrove habitats (Beck, 1998). These habitats had very different components (pits and pneumatophores, respectively) and complexities as measured by several indices of complexity (Fig. 1): D, vector dispersion
2
(VD), chain-and-tape (Chain), and consecutive substratum height difference (odh ). In
the rocky intertidal habitat, the density of gastropods was significantly and positively correlated with most indices of complexity, and D had the highest correlations with density.
32 M.W. Beck / J. Exp. Mar. Biol. Ecol. 249 (2000) 29 –49
Fig. 1. Measurement of the indices of structural complexity. (a) Transect showing profile of habitat (profile 2 can be obtained from a real habitat or an experimental mimic). (b) Illustration of the calculation of VD,odh
n
and Chain at the 5-mm interval. VD is a measure of the variance inu; VD5sn2ho1sa /cdjd
Y
sn21 , n is thed number of separate triangles along the transect. (c) Illustration of the calculation of D by the dividers method. The points are the apparent length of the transect measured by ‘dividers’ of increasingly greater intervals. The equation for the line and the calculation of D are shown.reduce the confusion that hinders our understanding of the effects of habitat structure on community structure.
2. Methods
2.1. Natural history
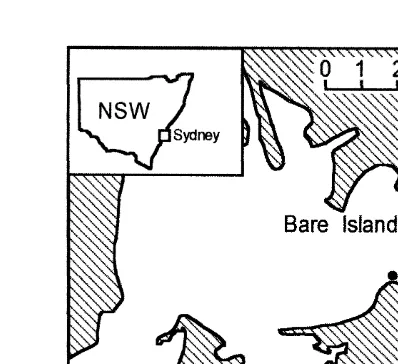
Fig. 2. Map of Botany Bay showing rocky intertidal shores.
also occurs in nearby mangrove habitats, but the other species do not. There are detailed descriptions of these shores, their habitat structure, and the gastropods (e.g. Underwood, 1975, 1976; Underwood and Chapman, 1996; Beck, 1998).
2.2. Habitat mimics and experimental design
To test predictions from hypotheses 1–3, complexity and structural components were
2
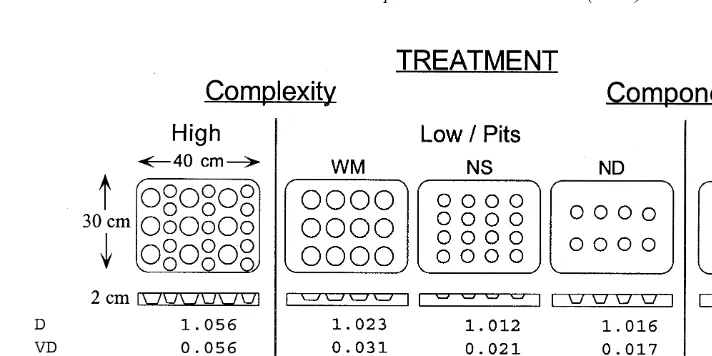
manipulated with 0.12-m polyester resin plates (Fig. 3). These plates were designed from computer models to have levels of complexity similar to those observed in rocky intertidal habitats (Beck, 1998) and to have components that were similar to those found in rocky intertidal and mangrove habitats (Fig. 3). A gold pigment paste which was inert when dried was added to the resin so that the color of the plates approximated the color of the natural rock surface (rust-colored sandstone) (e.g. Walters and Wethey, 1996). The plates were fastened on to the shore with stainless steel screws that were countersunk into the plates and screwed into wall plugs in the rock.
Complexity was measured with a variety of indices (Fig. 3). The calculation of D, VD,
2
odh , and Chain is explained in Fig. 1 and Beck (1998). It is necessary to choose a clear
scale for measurements of complexity (McCoy and Bell, 1991). In prior work it was shown that the gastropods at these sites were most affected by complexity measured at 5-mm intervals as compared to greater intervals (Beck, 1998). Therefore, 5 mm was the finest scale of measurement used in the development of these treatments. Only gastropods larger than 5 mm in size were included in analyses. This size cutoff also helped to focus analyses on gastropods that moved onto treatments not larvae that settled on them. There were few gastropod or barnacle settlers on the plates during the experiments.
34 M.W. Beck / J. Exp. Mar. Biol. Ecol. 249 (2000) 29 –49
Fig. 3. Experimental design for manipulation of complexity and structural components. Values underneath treatments indicate their complexity as computed by different indices. The low complexity treatments are coded so that the first letter indicates diameter (4 or 6 cm) and the second indicates depth of the pits (0.75, 1.0, or 1.5 cm); WM5wide, medium; NS5narrow, shallow; ND5narrow, deep; Pneum5pneumatophores. Pits on the High complexity treatment were 4 and 6 cm in diameter and 1.7 cm deep. Pneumatophores were 3 cm tall and 1.0 cm in base diameter. These dimensions were similar to the dimensions of natural structural components in these habitats.
habitat mimics and hypotheses 1–3 from the Introduction. The response variables were
2 2
the density (no. of individuals / 0.12 m ) and richness (no. of species / 0.12 m ) of gastropods on each treatment.
2.2.1. Assumption 1: The plates were reasonable mimics of the habitat
If this assumption is correct, it is predicted that the density and richness of gastropods on the high and low complexity treatments would be similar to the density and richness
of gastropods in undisturbed reference quadrats (5control treatment) on the
surround-ing rocky intertidal platform. The high and low complexity plates were explicitly designed to have complexities (Beck, 1998) and components similar to those measured previously on the rocky intertidal platforms at these sites. The reference quadrats had the
same dimensions as the plates (30340 cm) and their locations were haphazardly
determined.
2.2.2. Hypothesis 1: Habitat complexity positively affects the density and richness of
gastropods
2.2.3. Hypothesis 2: D represents elements of complexity that affect the density and
2
richness of gastropods better than other indices, i.e. VD, odh , surface area, number
of pits
The three low complexity treatments with pits were explicitly designed to separate among these indices. If D best represents elements of complexity that affect gastropods, as predicted by Beck (1998), their density and richness on the treatments should be
NS,ND,WM (Table 1, Fig. 3). The other indices make different predictions about
the rank order of density and richness on treatments (Table 1, Fig. 3). D and Chain measure complexity in similar ways (Beck, 1998), and it was not possible to construct manipulations from which contrasting predictions about their effects on the density and richness of gastropods could be derived.
2.2.4. Hypothesis 3: Specific components have effects on the density and richness of
gastropods that are independent of complexity
This hypothesis is tested by manipulating only structural components and holding complexity constant. Mimics of pits and pneumatophores of the mangrove Avicennia
marina were used to manipulate structural components. Pneumatophores were chosen,
because (i) they are a definitively different component from pits, (ii) gastropods occur on pneumatophores on mangrove shores around Sydney, and (iii) in a companion study, manipulations of the complexity of pneumatophores affected the density and diversity of gastropods in mangrove habitats (Beck, unpublished data). If this hypothesis is correct, the density and richness of gastropods is predicted to be greater on the three low complexity treatments with pits than on the treatment with pneumatophores. It was not possible to hold all indices of complexity constant on these treatments (Fig. 3), and an emphasis was placed on holding SA and D constant based in part on prior results (Beck, 1998).
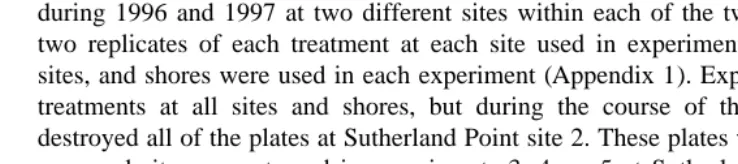
Experiments with these treatments were repeated as many as five different times during 1996 and 1997 at two different sites within each of the two shores. There were two replicates of each treatment at each site used in experiments. Not all treatments, sites, and shores were used in each experiment (Appendix 1). Experiment 3 included all treatments at all sites and shores, but during the course of the experiment vandals destroyed all of the plates at Sutherland Point site 2. These plates were not replaced, and a second site was not used in experiments 3, 4, or 5 at Sutherland Point. Before each
Table 1
a Predicted responses of gastropods to low complexity treatments based on different indices of complexity Index Predicted density and richness
36 M.W. Beck / J. Exp. Mar. Biol. Ecol. 249 (2000) 29 –49
experiment, plates were scrubbed clean and randomly allocated to positions at the sites. Each experiment lasted approximately two months with variation in duration because weather and tides limited accessibility.
The five experiments were concluded in August, December 1996, February, April, and June 1997. The experiments examine the reproducibility and temporal consistency of these results at different random times; they were not intended to test seasonal hypotheses per se. The experiments do, however, cover periods with different prevailing climatic conditions.
2.3. Data analysis
The total density and richness of gastropods were analyzed for each experiment by ANOVA. Treatment was a fixed factor and site was a random factor. In experiment 2, site was nested within shore, which was a random factor. The factor, shore, could not be used in ANOVAs for experiments 3–5, because the plates at the second site at
Sutherland Point were destroyed. Densities were transformed (log x) to meet conditionse
of homoscedasticity. In experiment 4, one replicate plate was lost, and in experiment 5, four plates were lost in storms (Appendix 1). To balance the ANOVAs for these missing replicates, the data were replaced with the value from the other replicate at that time and place. The residual df were reduced by 1 and 4, respectively. Mean square values were obtained from SAS (Release 6.04, SAS Institute Inc., Cary, NC, USA).
When the effect of treatment was significant, a priori contrasts were done to test the predictions of the assumption and hypotheses 1–3 above. To test the predictions from hypothesis 2 (Table 1), it was necessary to do all the pairwise comparisons among the three low complexity treatments. These comparisons were non-orthogonal. To hold the
type I error constant at a 50.05 for this group of comparisons each comparison was
tested ata 9 50.017 following Dunn–Sidak’s procedure (Underwood, 1997). When there
were significant treatment3site interactions, contrasts were done within each site with
Student–Newman–Keuls (SNK) tests (Underwood, 1997).
2.4. Combining data from experiments.
These separate experiments provided independent tests of the predictions identified above, and it was possible with rank-order statistics to combine the data across the different experiments. Data were combined across experiments, because in some cases the results from individual experiments did not indicate significant differences among treatments, but there appeared to be clear patterns at most times and places. It also was possible to summarize the results briefly and clearly by combining data across experiments. In addition, it was possible to examine the effects of the treatments on the densities of the three most abundant species across the experiments. ANOVAs were not done on the densities of the individual species, because these data did not meet the assumptions of the test.
Two non-parametric tests were used to combine data; one proposed originally by Anderson (Anderson, 1959; Winer et al., 1991), which will hereafter be referred to as
2
treatments are ranked at the different times and places (trials) for each contrast or comparison, and the likelihood that the rankings are randomly distributed among treatments is assessed. In these tests, each site in each experiment was a separate trial (i.e. each row in Appendix 1 represents a separate trial), and the responses to the treatments were ranked within each trial for each of the a priori contrasts identified in assumption 1 and hypotheses 1–3. There was thus a maximum of 14 possible trials at separate places and times (Appendix 1).
2
Anderson’s Q was used to examine distributions of ranks in the contrasts (one vs. three treatments) when there were no tied ranks. In cases with tied ranks and for comparisons (e.g. high vs. control), binomial tests were used to combine results across experiments. If there was no difference in density or richness between treatments, each
treatment should be ranked first on average 50% of the time (i.e. binomial p5q50.5).
When the binomial test was used for contrasts that involved the three low complexity treatments with pits (i.e. low vs. control, high vs. low, pits vs. pneumatophores), density and richness were averaged among the three treatments to condense the contrast to a comparison of two groups. In trials with tied values, a tie was counted against the predictions (i.e. in support of the null prediction) if there was just one tie. When there were two tied values, one value was counted in support of predictions and one against. In the analyses of the a priori contrasts for the individual species, a few trials were dropped from consideration, because no individuals of that species were observed on any treatment in the trial. The number of omitted trials was noted on every occasion when this procedure was done.
3. Results
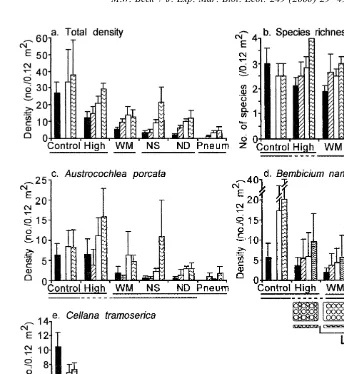
The ANOVAs indicated that there were differences in density and to a lesser extent richness among the different sites and treatments (Tables 2, 3). The three most common species accounted for most of the density of gastropods on the treatments (Fig. 4). The differences among sites were not surprising (Fig. 4), because these sites were haphazardly chosen. There were a few site by treatment interactions (Tables 2, 3); these interactions generally occurred because of variation in the magnitude, but not direction, of differences in treatments among sites. The differences among treatments were examined in the a priori contrasts.
3.1. Assumption 1: control vs. high and low complexity treatments
In most cases, the results were consistent with the predictions of no difference between control and complexity treatments. Total density was generally similar between control and high complexity treatments in the individual experiments (Table 2, Fig. 5a). When the data were combined across the different times and places, there was no significant difference in the ranking of density among trials (Table 4, Appendix 1,
binomial P.0.1). There was not a significant difference between the density of
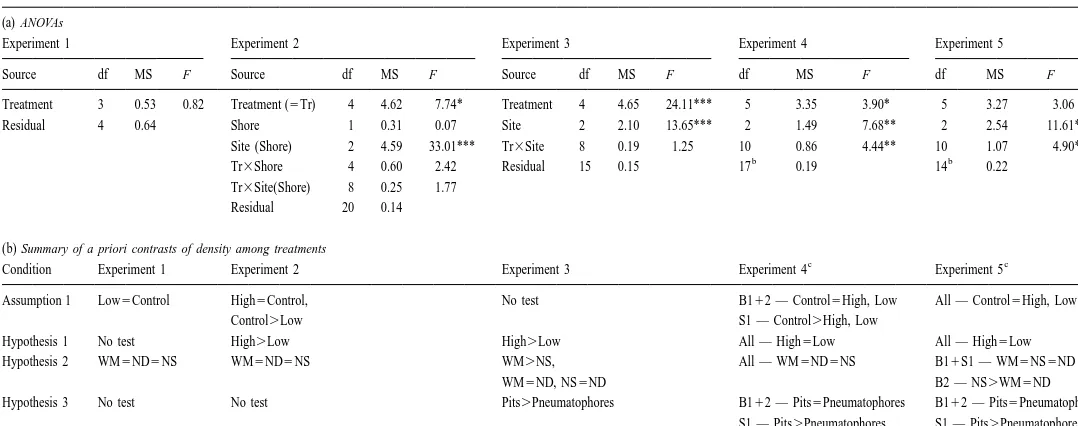
38 Comparisons of total density among treatments, sites, and shores in five separate experiments
(a) ANOVAs
Experiment 1 Experiment 2 Experiment 3 Experiment 4 Experiment 5
Source df MS F Source df MS F Source df MS F df MS F df MS F
Treatment 3 0.53 0.82 Treatment (5Tr) 4 4.62 7.74* Treatment 4 4.65 24.11*** 5 3.35 3.90* 5 3.27 3.06
Residual 4 0.64 Shore 1 0.31 0.07 Site 2 2.10 13.65*** 2 1.49 7.68** 2 2.54 11.61***
Site (Shore) 2 4.59 33.01*** Tr3Site 8 0.19 1.25 10 0.86 4.44** 10 1.07 4.90**
b b
Tr3Shore 4 0.60 2.42 Residual 15 0.15 17 0.19 14 0.22
Tr3Site(Shore) 8 0.25 1.77
Residual 20 0.14
(b) Summary of a priori contrasts of density among treatments
c c
Condition Experiment 1 Experiment 2 Experiment 3 Experiment 4 Experiment 5
Assumption 1 Low5Control High5Control, No test B112 — Control5High, Low All — Control5High, Low
Control.Low S1 — Control.High, Low
Hypothesis 1 No test High.Low High.Low All — High5Low All — High5Low
Hypothesis 2 WM5ND5NS WM5ND5NS WM.NS, All — WM5ND5NS B11S1 — WM5NS5ND
WM5ND, NS5ND B2 — NS.WM5ND
Hypothesis 3 No test No test Pits.Pneumatophores B112 — Pits5Pneumatophores B112 — Pits5Pneumatophores
S1 — Pits.Pneumatophores S1 — Pits.Pneumatophores
a
In the F-ratios, the mean squares for most terms are tested over the Residual. In experiment 2, Shore is tested over Site(Shore), Treatment is tested over Treatment3Shore, which is tested over Treatment3Site(Shore). In experiments 3–5, Treatment is tested over Treatment3Site.
b
Df reduced to account for replacement of missing replicates (see text). c
M
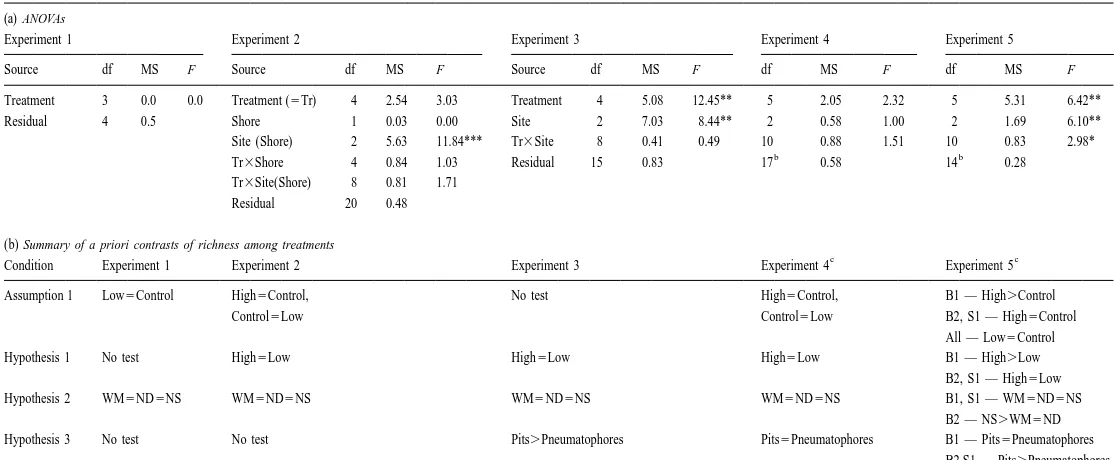
Comparisons of richness among treatments, sites, and shores in the five experiments
(a) ANOVAs
Experiment 1 Experiment 2 Experiment 3 Experiment 4 Experiment 5
Source df MS F Source df MS F Source df MS F df MS F df MS F
Treatment 3 0.0 0.0 Treatment (5Tr) 4 2.54 3.03 Treatment 4 5.08 12.45** 5 2.05 2.32 5 5.31 6.42**
Residual 4 0.5 Shore 1 0.03 0.00 Site 2 7.03 8.44** 2 0.58 1.00 2 1.69 6.10**
Site (Shore) 2 5.63 11.84*** Tr3Site 8 0.41 0.49 10 0.88 1.51 10 0.83 2.98*
b b
Tr3Shore 4 0.84 1.03 Residual 15 0.83 17 0.58 14 0.28
Tr3Site(Shore) 8 0.81 1.71
Residual 20 0.48
(b) Summary of a priori contrasts of richness among treatments
c c
Condition Experiment 1 Experiment 2 Experiment 3 Experiment 4 Experiment 5
Assumption 1 Low5Control High5Control, No test High5Control, B1 — High.Control
Control5Low Control5Low B2, S1 — High5Control
All — Low5Control
Hypothesis 1 No test High5Low High5Low High5Low B1 — High.Low
B2, S1 — High5Low
Hypothesis 2 WM5ND5NS WM5ND5NS WM5ND5NS WM5ND5NS B1, S1 — WM5ND5NS
B2 — NS.WM5ND
Hypothesis 3 No test No test Pits.Pneumatophores Pits5Pneumatophores B1 — Pits5Pneumatophores
B2,S1 — Pits.Pneumatophores
a
The mean squares in the F-ratios are the same as in Table 2. b
Df reduced to account for replacement of missing replicates (see text). c
40 M.W. Beck / J. Exp. Mar. Biol. Ecol. 249 (2000) 29 –49
Fig. 5. Density and richness of gastropods by treatment and experiment. Data were averaged first within sites before calculating the average and standard error among sites. The value is the mean11 S.E. Data from experiment 1 are not included, because only one site was used in the experiment. Lines underneath the bars indicate results of tests when data are combined across all experiments. Treatments on the same solid line are statistically similar. Pneum5treatment with pneumatophores.
first in most trials above densities on all three low complexity treatments (Table 4,
2
Appendix 1, Q 514.09, df53, P,0.01).
Species richness was similar between control and complexity treatments in most experiments (Table 3, Fig. 5b). When the data were combined across the different times
and places they were statistically similar (Table 4, high.control in five of ten trials,
binomial P.0.1; low.control in four of 11 trials, binomial P.0.1).
42
M
.W
.
Beck
/
J.
Exp
.
Mar
.
Biol
.
Ecol
.
249
(2000
)
29
–
49
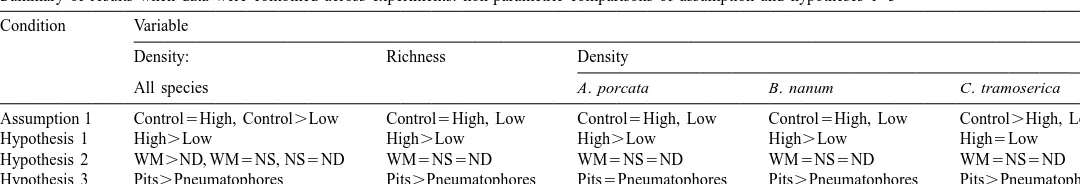
Table 4
Summary of results when data were combined across experiments: non-parametric comparisons of assumption and hypotheses 1–3 Condition Variable
Density: Richness Density
All species A. porcata B. nanum C. tramoserica
Assumption 1 Control5High, Control.Low Control5High, Low Control5High, Low Control5High, Low Control.High, Low
Hypothesis 1 High.Low High.Low High.Low High.Low High5Low
Hypothesis 2 WM.ND, WM5NS, NS5ND WM5NS5ND WM5NS5ND WM5NS5ND WM5NS5ND
similar between complexity and control treatments, but the density of C. tramoserica was not (Table 4, Fig. 5c–e). The density of A. porcata was similar between the control
and the complexity treatments (high.control in six of ten trials, binomial P.0.1;
low.control in three of 11 trials, binomial P.0.1) as was the density of B. nanum
(high.control in two of six trials after four all-zero trials dropped, binomial P.0.1;
low.control in four of eight trials after three all-zero trials dropped, binomial P.0.1).
The density of C. tramoserica was, however, significantly greater in the control treatment than on the complexity treatments when the responses were combined across
experiments (high.control in zero of ten trials, P,0.001; low.control in one of 11
trials, P,0.01). Inferences about the effects of treatments on C. tramoserica must be
regarded with caution, because they may not accurately reflect the effects of habitat structure on this species in unmanipulated habitats.
3.2. Hypothesis 1: high vs. low complexity treatments
Total density of gastropods was greater on high than on low complexity treatments at all times and places. When the data were examined for each experiment, the ANOVAs indicated significant differences between high and low complexity treatments only in experiments 2 and 3 (Table 2, Fig. 5a). When the data were combined across experiments, the density of gastropods on the high complexity treatment was ranked first above the densities on the three low complexity treatments in all 13 trials; a result that is
2
highly unlikely to occur by chance (Table 4, Appendix 1, Q 539, df53, P,0.001).
Species richness was greater on the high than low complexity treatments at most times and places (Table 3, Fig. 5b). There was, however, only one statistically significant difference among these treatments when the data were analyzed for each experiment (Table 3). When the responses to treatments were combined across experiments, richness was greater on the high complexity treatment than on the low complexity treatments in
ten of 13 trials (Table 4, binomial P,0.05).
Of the three most abundant species, the densities of A. porcata and B. nanum were affected by complexity, but the density of C. tramoserica was not (Table 4, Fig. 5c–e). When the data were combined across the experiments, the densities of A. porcata and B.
nanum were significantly greater on high than on low complexity treatments after four
all-zero trials were dropped (A. porcata — high.low in nine of nine trials, binomial
P,0.01; B. nanum — high.low in eight of nine trials, binomial P,0.05). The
density of C. tramoserica was not affected by complexity (high.low in five of 13
trials, P.0.1).
3.3. Hypothesis 2: comparison of indices among low complexity treatments
44 M.W. Beck / J. Exp. Mar. Biol. Ecol. 249 (2000) 29 –49
P,0.01). There were no significant differences in rankings of density among trials
between WM and NS treatments or NS and ND treatments (Table 4, binomial P.0.05
for both) (Appendix 1).
The ANOVAs revealed only two significant differences in richness among the three low complexity treatments (Table 3, Fig. 5b). When the data were combined across the experiments, there were no significant differences in richness among the three low complexity treatments (Table 4).
There were also no significant differences in the density of any of the three most abundant species on the low complexity treatments when the results were combined across experiments (Table 4, Fig. 5c–e).
3.4. Hypothesis 3: pits vs. pneumatophores
Total density was greater on treatments with pits than on treatments with pneumatophores at most times and places (Table 2, Fig. 5a). The ANOVAs for the individual experiments indicated that there were significant differences in total density between these treatments at most times and places (Table 2b). When the data were combined across experiments, the density of gastropods was greater on treatments with
pits in seven of eight trials (Table 4, Appendix 1, binomial P,0.05).
Richness was greater on treatments with pits than on treatments with pneumatophores at all times and places. The ANOVAs indicated that richness was significantly greater on treatments with pits at most times and places (Table 3, Fig. 5b). When the responses to treatments were combined across experiments, richness was greater on treatments with
pits in eight of eight trials (Table 4, binomial P,0.01).
Of the three most abundant species, the densities of B. nanum and C. tramoserica
were significantly greater on treatments with pits than on treatments with
pneumatophores (Table 4, Fig. 5d,e; B. nanum — pits.pneumatophores in six of six
trials after two all-zero trials dropped, binomial P,0.05; C. tramoserica — pits.
pneumatophores in seven of eight trials, P,0.05). The density of A. porcata was not
significantly different between treatments with pits vs. pneumatophores (Table 4, Fig.
5c; pits.pneumatophores in four of six trials after two all-zero trials dropped, P.0.1).
4. Discussion
density and richness of gastropods than did plates with pneumatophores. This result suggests that the effects of habitat heterogeneity are likely to have important effects on some of these gastropods, because the basis of an effect of heterogeneity is that the effects of different structural components are independent of their complexity (McCoy and Bell, 1991).
The effects of complexity and structural components were species specific. Complexi-ty affected the densities of A. porcata and B. nanum, but not C. tramoserica. The lack of a response by C. tramoserica could be an experimental artifact, because its density on plates was less than on controls. The lack of a response was, however, consistent with prior results that showed no correlation between the density of C. tramoserica and complexity on these shores (Beck, 1998). Specific structural components affected the densities of B. nanum and C. tramoserica but not the density of A. porcata.
Few studies define, measure, or manipulate complexity and structural components independently of one another, and their effects are often confounded. The complexity created by pits, pools, and crevices is thought to have strong effects on many rocky intertidal species including some of the gastropods examined in this study (e.g. Emson and Faller-Fritsch, 1976; Underwood, 1976; Raffaelli and Hughes, 1978; Menge et al., 1983; Moran, 1985; Fairweather, 1988; Underwood and Chapman, 1992). Explanations for these effects of complexity often hinge on features that are specific to pits per se, e.g. they pool water and reduce desiccation stress. If just the complexity of pits had been manipulated in this study, it would appear that pits had strong effects on the density of
A. porcata. A. porcata, however, responded in similar abundances to pits and
pneumatophores; it was complexity not pits per se that affected the density of this species. Explanations for the behavior of A. porcata that rely on pooled water would be inappropriate. On the other hand, C. tramoserica did not respond to changes in complexity, and it might have been suggested that habitat structure did not have strong effects on this species. Specific structural components did, however, affect the density of
C. tramoserica; pits were important but complexity per se was not.
Each of the three main species responded differently to changes in complexity and structural components. The ability to separate the effects of these elements will help improve studies that examine the mechanistic basis for the effects of habitat structure on species (e.g. Coull and Wells, 1983; Fletcher and Underwood, 1987; Miller and Carefoot, 1989; Beck, 1995, 1997; Persson and Eklov, 1995). In this study, B. nanum was affected by complexity and specific structural components, pits. This species may use pits in particular to avoid the direct effects of desiccation on themselves (e.g. McGuinness and Underwood, 1986) or the indirect effects of desiccation on their microalgal food. C. tramoserica was not strongly affected by changes in complexity, but it was affected by specific structural components when complexity was held constant. The complexity of pits may be less important to this limpet than to the snails, because it can clamp tightly to flat surfaces to reduce the direct effects of desiccation stress or
wave forces. C. tramoserica may, however, have avoided treatments with
pneumatophores, because they hindered its movements or provided fewer places for attachment. Thus, the complexity of pits may have neutral or negligible effects on C.
tramoserica, but pneumatophores may have a negative effect on its density. In the rocky
46 M.W. Beck / J. Exp. Mar. Biol. Ecol. 249 (2000) 29 –49
between pits and pneumatophores; a similar result was observed in a comparable study in nearby mangrove habitats (Beck, unpublished data). The same mechanism may underlie the response of A. porcata to complexity in both habitats. A. porcata may respond to any component that creates complexity to avoid predators in both habitats. It is also possible that there may be separate explanations for the similarity in responses of
A. porcata between habitats, as Crowe (1996) has shown for another gastropod.
In addition to confounding of the elements of habitat structure, lack of realistic manipulations or controls further constrain the development of our understanding of the effects of habitat structure on species. In some experiments complexity has been manipulated with structural components that bear little or no relationship to natural components (e.g. Bourget et al., 1994; Jacobi and Langevin, 1996; Lemire and Bourget, 1996). Artificial components often are assumed to resemble natural components, but this assumption is rarely tested (e.g. Hart, 1978; Russ, 1980; Gilinsky, 1984; Bell et al., 1987; Gunnarsson, 1992; Caley and St. John, 1996).
D was not definitively better than the other indices of complexity examined in this study. When differences in complexity were great enough to affect these gastropods (i.e. high vs. low complexity treatments), all indices predicted their responses. When differences in complexity between treatments were small enough to separate among the indices (i.e. low complexity treatments), these differences were generally not great enough to affect the gastropods. D did predict the result that the density of gastropods
2
would be greater on WM than on ND treatments, but all indices except odh predicted
this response. The lack of a definitive result in comparisons of indices is common (Carleton and Sammarco, 1987; Underwood and Chapman, 1989; McCormick, 1994)
In the absence of a more definitive experimental result, D and SA are recommended for further examination. The prior observation that D was more highly correlated with the density of gastropods than other indices still suggests that D could be better than other indices at describing features of the habitat that affected these gastropods (Beck, 1998) and that of other rocky shore gastropods (Kostylev et al. 1997). D is also useful, because it is calculated explicitly across different intervals of measurement, which forces consideration of the concordance in scale between measures of complexity and the size of the species in question (Gee and Warwick, 1994; Beck, 1998). The use of D does not imply that surfaces are ‘fractal’ or self-similar; it only implies that D can usefully describe some features of the habitat (e.g. Avnir et al., 1998). SA is intuitively appealing, because researchers are familiar with it. Caution is urged, because this appeal does not necessarily make SA relevant to other species, and SA can be difficult to measure in the field.
It seems unlikely that any one index will be best in most habitats. Measures of several indices should be provided in studies of habitat complexity. It will be counterproductive to become mired in measures of complexity, but consideration of multiple indices will reiterate that the observation or manipulation of habitat structure involves many correlated features not just those that seem obvious to the observer. This information will also increase the possibility of comparisons of complexity between different studies and habitats (Beck, 1998).
complexity and structural components of habitats. Complexity and structural components have separate effects on assemblages, and it confuses the study of habitat structure to combine them.
Acknowledgements
This work was supported by a Fulbright Fellowship and an ARC Postdoctoral Research Fellowship. I thank T. Glasby, M. Haddon, B. Kelaher, I. Montgomery for field assistance and G. Housefield for technical advice on the manufacture of fractal surfboards. This paper benefited from discussion with and reviews by L. Airoldi, M. J. Anderson, B. Gillanders, and A.J. Underwood. [RW]
2
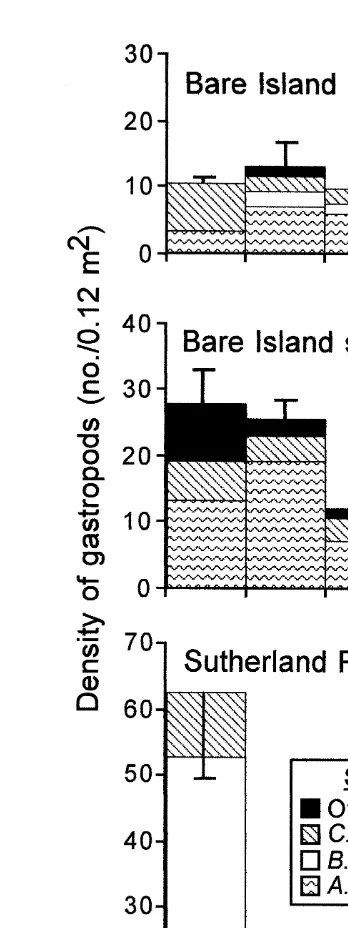
Appendix 1. Average density of gastropods (no. / 0.12 m ) on treatments (n52 /
cell).
Not all treatments were used at each time and place. Bare Is.5Bare Island, Suth.
Pt.5Sutherland Point.
Experiment Shore Site Treatment
Control High WM NS ND Pneum.
1 Bare Is. 1 13.8 – 47.0 18.0 30.5 –
Anderson, R.L., 1959. Use of contingency tables in the analysis of consumer preference studies. Biometrics 15, 582–590.
Avnir, D., Biham, O., Lidar, D., Malcai, O., 1998. Is the geometry of nature fractal. Science 279, 39–40. Beck, M.W., 1995. Size-specific shelter limitation in stone crabs: a test of the demographic bottleneck
hypothesis. Ecology 76, 968–980.
48 M.W. Beck / J. Exp. Mar. Biol. Ecol. 249 (2000) 29 –49
Beck, M.W., 1998. Comparison of the measurement and effects of habitat structure on gastropods in rocky intertidal and mangrove habitats. Mar. Ecol. Prog. Ser. 169, 165–178.
Bell, J.D., Westoby, M., Steffe, A.S., 1987. Fish larvae settling in seagrass: do they discriminate between beds of different leaf density. J. Exp. Mar. Biol. Ecol. 111, 133–144.
Bourget, E., Deguise, J., Daigle, G., 1994. Scales of substratum heterogeneity, structural complexity, and the early establishment of a marine epibenthic community. J. Exp. Mar. Biol. Ecol. 181, 31–51.
Caley, M.J., St. John, J., 1996. Refuge availability structures assemblages of tropical reef fishes. J. Anim. Ecol. 65, 414–428.
Carleton, J.H., Sammarco, P.W., 1987. Effects of substratum irregularity on success of coral settlement: quantification by comparative geomorphological techniques. Bull. Mar. Sci. 40, 85–98.
Connell, J.H., 1961. Effects of competition, predation by Thais lapillus, and other factors on the distribution of the barnacle Balanus balanoides. Ecol. Monogr. 31, 61–104.
Connor, E.F., McCoy, E.D., 1979. The statistics and biology of the species–area relationship. Am. Nat. 113, 791–833.
Coull, B.C., Wells, J.B.J., 1983. Refuges from fish predation: experiments with phytal meiofauna from the New Zealand rocky intertidal. Ecology 64, 1599–1609.
Crowe, T., 1996. Different effects of microhabitat fragmentation on patterns of dispersal of an intertidal gastropod in two habitats. J. Exp. Mar. Biol. Ecol. 206, 83–107.
Dean, R.L., Connell, J.H., 1987. Marine invertebrates in an algal succession. III. mechanisms linking habitat complexity with diversity. J. Exp. Mar. Biol. Ecol. 109, 249–273.
Diehl, S., 1993. Effects of habitat structure on resource availability, diet and growth of benthivorous perch,
Perca fluviatilis. Oikos 67, 403–414.
Dittel, A., Epifanio, C.E., Natunewicz, C., 1996. Predation on mud crab megalopae, Panopeus herbstii H. Milne Edwards: effect of habitat complexity, predator species and postlarval densities. J. Exp. Mar. Biol. Ecol. 198, 191–202.
Downes, B.J., Lake, P.S., Schreiber, E.S.G., Glaister, A., 1998. Habitat structure and regulation of local species diversity in a stony, upland stream. Ecol. Monogr. 68, 237–258.
Emson, R.H., Faller-Fritsch, R.J., 1976. An experimental investigation into the effect of crevice availability on abundance and size-structure in a population of Littorina rudis (Maton): Gastropoda: Prosobranchia. J. Exp. Mar. Biol. Ecol. 23, 285–297.
Fairweather, P.G., 1988. Movements of intertidal whelks (Morula marginalba and Thais orbita) in relation to availability of prey and shelter. Mar. Biol. 100, 63–68.
Fletcher, W.J., Underwood, A.J., 1987. Interspecific competition among subtidal limpets: effects of substratum heterogeneity. Ecology 68, 387–400.
Gause, G.F., 1934. The Struggle for Existence, Hafner, New York.
Gee, J.M., Warwick, R.M., 1994. Metazoan community structure in relation to the fractal dimensions of marine macroalgae. Mar. Ecol. Prog. Ser. 103, 141–150.
Gilinsky, E., 1984. The role of fish predation and habitat heterogeneity in determining benthic community structure. Ecology 65, 455–468.
Grinnell, J., 1917. The niche relationships of the California Thrasher. The Auk 34, 427–433.
Gunnarsson, B., 1992. Fractal dimension of plants and body size distribution in spiders. Func. Ecol. 6, 636–641.
Hart, D.D., 1978. Diversity in stream insects: regulation by rock size and microspatial complexity. Proc. Int. Assoc. Theor. Appl. Limnol. (Verhandlungen) 20, 1376–1381.
Huffaker, C.B., 1958. Experimental studies on predation: dispersion factors and predator–prey oscillations. Hilgardia 27, 343–383.
Inglis, G.J., 1994. Contrasting effects of habitat structure on the recruitment and mortality of an epibiotic macroalga. Oecologia (Berl.) 99, 352–365.
Jacobi, C.M., Langevin, R., 1996. Habitat geometry of benthic substrata: effects on arrival and settlement of mobile epifauna. J. Exp. Mar. Biol. Ecol. 206, 39–54.
Jenkins, G.P., Sutherland, C.R., 1997. The influence of habitat structure on nearshore fish assemblages in a southern Australian embayment: colonisation and turnover rate of fishes associated with artificial macrophyte beds of varying physical structure. J. Exp. Mar. Biol. Ecol. 218, 103–125.
Kostylev, V., Erlandsson, J., Johannesson, K., 1997. Microdistribution of the polymorphic snail Littorina
saxatalis (Olivi) in a patchy rocky shore habitat. Ophelia 47, 1–12.
Leber, K.M., 1985. The influence of predatory decapods, refuge, and microhabitat selection on seagrass communities. Ecology 66, 1951–1964.
Lemire, M., Bourget, E., 1996. Substratum heterogeneity and complexity influence micro-habitat selection of
Balanus sp. and Tubularia crocea larvae. Mar. Ecol. Prog. Ser. 135, 77–87.
McCormick, M.I., 1994. Comparison of field methods for measuring surface topography and their associations with a tropical reef fish assemblage. Mar. Ecol. Prog. Ser. 112, 87–96.
McCoy, E.D., Bell, S.S., 1991. Habitat structure: the evolution and diversification of a complex topic. In: Bell, S.S., McCoy, E.D., Mushinsky, H.R. (Eds.), Habitat Structure: The Physical Arrangement of Objects in Space, Chapman and Hall, New York, pp. 3–27.
McGuinness, K.A., 1984. Communities of organisms on intertidal boulders: the effects of disturbance and other factors. PhD thesis, University of Sydney, Australia.
McGuinness, K.A., Underwood, A.J., 1986. Habitat structure and the nature of communities on intertidal boulders. J. Exp. Mar. Biol. Ecol. 104, 97–123.
Menge, B.A., Ashkenas, L.R., Matson, A., 1983. Use of artificial holes in studying community development in cryptic marine habitats in a tropical rocky intertidal region. Mar. Biol. 77, 129–142.
Menge, B.A., Lubchenco, J., 1981. Community organization in temperate and tropical rocky intertidal habitats: prey refuges in relation to consumer pressure gradients. Ecol. Monogr. 51, 429–450.
Miller, K.M., Carefoot, T.H., 1989. The role of spatial and size refuges in the interaction between juvenile barnacles and grazing limpets. J. Exp. Mar. Biol. Ecol. 137, 157–174.
Moran, M.J., 1985. The timing and significance of sheltering and foraging behaviour of the predatory intertidal gastropod Morula marginalba Blainville (Muricidae). J. Exp. Mar. Biol. Ecol. 93, 103–114.
Pennings, S.C., 1990. Predator–prey interactions in opisthobranch gastropods: effects of prey body size and habitat complexity. Mar. Ecol. Prog. Ser. 62, 95–101.
Persson, L., Eklov, P., 1995. Prey refuges affecting interactions between piscivorous perch and juvenile perch and roach. Ecology 76, 70–81.
Primavera, J.H., 1997. Fish predation on mangrove associated penaeids: the role of structures and substrate. J. Exp. Mar. Biol. Ecol. 215, 205–216.
Raffaelli, D.G., Hughes, R.N., 1978. The effects of crevice size and availability on populations of Littorina
rudis and Littorina neritoides. J. Anim. Ecol. 47, 71–83.
Russ, G.R., 1980. Effects of predation by fishes, competition, and structural complexity of the substratum on the establishment of a marine epifaunal community. J. Exp. Mar. Biol. Ecol. 42, 55–69.
Stoner, A.W., Lewis, III F.G., 1985. The influence of quantitative and qualitative aspects of habitat complexity in tropical sea-grass meadows. J. Exp. Mar. Biol. Ecol. 94, 19–40.
Underwood, A.J., 1975. Intertidal zonation of prosobranch gastropods: analysis of densities of four coexisting species. J. Exp. Mar. Biol. Ecol. 19, 197–216.
Underwood, A.J., 1976. Analysis of patterns of dispersion of intertidal prosobranch gastropods in relation to macroalgae and rockpools. Oecologia (Berl.) 25, 145–154.
Underwood, A.J., 1997. Experiments in Ecology: Their Logical Design and Interpretation Using Analysis of Variance, Cambridge University Press, Cambridge.
Underwood, A.J., Chapman, M.G., 1989. Experimental analyses of the influences of topography of the substratum on movements and density of an intertidal snail, Littorina unifasciata. J. Exp. Mar. Biol. Ecol. 134, 175–196.
Underwood, A.J., Chapman, M.G., 1992. Experiments on the topographic influences on density and dispersion of Littorina unifasciata in New South Wales. In: Mill, P.J., Reid, D.G. (Eds.), Proc. 3rd Int. Symp. on Littorinid Biology, The Malacological Society of London, London, pp. 181–195.
Underwood, A.J., Chapman, M.G., 1996. Scales of spatial patterns of distribution of intertidal invertebrates. Oecologia (Berl.) 107, 212–224.
Walters, L.J., Wethey, D.S., 1996. Settlement and early post-settlement survival of sessile marine invertebrates on topographically complex surfaces: the importance of refuge dimensions and adult morphology. Mar. Ecol. Prog. Ser. 137, 161–171.
Werner, E.E., Gilliam, J.F., Hall, D.J., Mittelbach, G.G., 1983. An experimental test of the effects of predation risk on habitat use in fish. Ecology 64, 1540–1548.